Grundläggande statistik
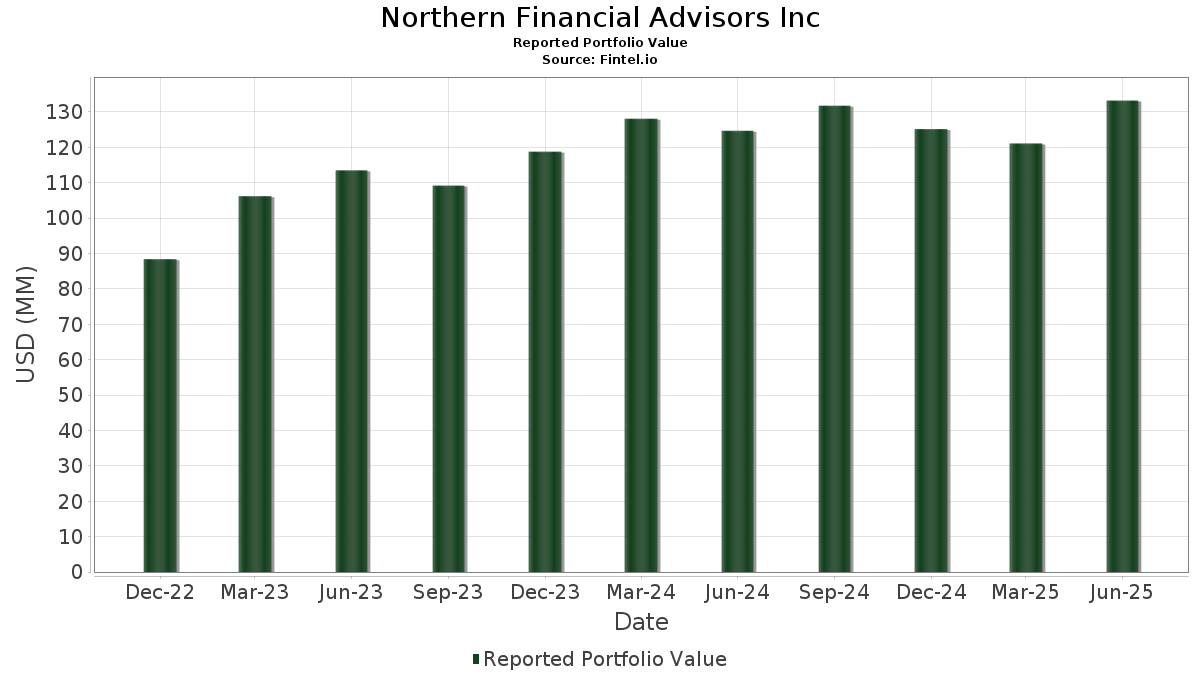
| Portföljvärde | $ 133 229 407 |
| Aktuella positioner | 107 |
Senaste innehav, resultat, förvaltat kapital (från 13F, 13D)
Northern Financial Advisors Inc har redovisat 107 totala innehav i sina senaste SEC-arkiveringar. Det senaste portföljvärdet beräknas vara $ 133 229 407 USD. Faktiskt förvaltade tillgångar (AUM) är detta värde plus likvida medel (som inte redovisas). Northern Financial Advisors Incs största innehav är SPDR S&P 500 ETF (US:SPY) , Netflix, Inc. (US:NFLX) , SPDR Dow Jones Industrial Average ETF Trust (US:DIA) , Broadcom Inc. (US:AVGO) , and Walmart Inc. (US:WMT) . Northern Financial Advisors Incs nya positioner inkluderar CONV. NOTE (US:US780153BQ43) , .
Största ökningarna detta kvartal
Vi använder förändringen i portföljallokeringen eftersom det är det mest meningsfulla måttet. Förändringar kan bero på transaktioner eller förändringar i aktiekurser.
| Värdepapper | Aktier (MM) |
Värde (MM$) |
Portfölj % av | ΔPortfölj % av |
|---|---|---|---|---|
| 0,02 | 4,38 | 3,2856 | 1,0943 | |
| 0,00 | 5,74 | 4,3120 | 1,0372 | |
| 0,02 | 3,54 | 2,6581 | 1,0354 | |
| 0,02 | 1,22 | 0,9180 | 0,9180 | |
| 0,01 | 2,73 | 2,0487 | 0,6296 | |
| 0,01 | 4,04 | 3,0338 | 0,4706 | |
| 0,00 | 0,56 | 0,4223 | 0,4223 | |
| 0,00 | 2,65 | 1,9926 | 0,2975 | |
| 0,00 | 0,37 | 0,2780 | 0,2780 | |
| 0,00 | 2,23 | 1,6760 | 0,2620 |
Största minskningarna detta kvartal
Vi använder förändringen i portföljallokeringen eftersom det är det mest meningsfulla måttet. Förändringar kan bero på transaktioner eller förändringar i aktiepriser.
| Värdepapper | Aktier (MM) |
Värde (MM$) |
Portfölj % av | ΔPortfölj % av |
|---|---|---|---|---|
| 0,00 | 0,56 | 0,4208 | −0,8468 | |
| 0,01 | 0,14 | 0,1018 | −0,7902 | |
| 0,02 | 3,84 | 2,8857 | −0,5582 | |
| 0,00 | 0,71 | 0,5312 | −0,5469 | |
| 0,00 | 0,60 | 0,4470 | −0,3581 | |
| 0,02 | 2,57 | 1,9317 | −0,3238 | |
| 0,01 | 1,49 | 1,1199 | −0,2713 | |
| 0,00 | 0,97 | 0,7283 | −0,2545 | |
| 0,01 | 0,56 | 0,4172 | −0,2436 | |
| 0,00 | 0,63 | 0,4701 | −0,2193 |
13F- och fond arkiveringar
Denna blankett lämnades in den 2025-07-23 för rapporteringsperioden 2025-06-30. Klicka på länksymbolen för att se hela transaktionshistoriken.
Uppgradera för att låsa upp premiumdata och exportera till Excel![]() .
.
| Värdepapper | Typ | Genomsnittligt aktiepris | Aktier (MM) |
ΔAktier (%) |
ΔAktier (%) |
Värde ($MM) |
Portfölj (%) |
ΔPortfölj (%) |
|
|---|---|---|---|---|---|---|---|---|---|
| SPY / SPDR S&P 500 ETF | 0,02 | −0,95 | 11,41 | 9,40 | 8,5656 | −0,0478 | |||
| NFLX / Netflix, Inc. | 0,00 | 0,87 | 5,74 | 44,83 | 4,3120 | 1,0372 | |||
| DIA / SPDR Dow Jones Industrial Average ETF Trust | 0,01 | −0,27 | 4,77 | 4,67 | 3,5831 | −0,1827 | |||
| AVGO / Broadcom Inc. | 0,02 | 0,19 | 4,38 | 64,98 | 3,2856 | 1,0943 | |||
| WMT / Walmart Inc. | 0,04 | −0,41 | 4,29 | 10,92 | 3,2188 | 0,0266 | |||
| MSFT / Microsoft Corporation | 0,01 | −1,73 | 4,04 | 30,19 | 3,0338 | 0,4706 | |||
| AAPL / Apple Inc. | 0,02 | −0,20 | 3,84 | −7,82 | 2,8857 | −0,5582 | |||
| NVDA / NVIDIA Corporation | 0,02 | 23,62 | 3,54 | 80,20 | 2,6581 | 1,0354 | |||
| NVR / NVR, Inc. | 0,00 | 0,00 | 3,32 | 1,97 | 2,4891 | −0,1967 | |||
| JPM / JPMorgan Chase & Co. | 0,01 | 0,71 | 3,21 | 19,06 | 2,4102 | 0,1825 | |||
| AXP / American Express Company | 0,01 | −1,00 | 2,80 | 17,38 | 2,1041 | 0,1320 | |||
| ORCL / Oracle Corporation | 0,01 | 1,56 | 2,73 | 58,85 | 2,0487 | 0,6296 | |||
| GSCE / GS Connect S&P GSCI Enhanced Commodity Total Return ETN | 0,00 | −0,19 | 2,65 | 29,34 | 1,9926 | 0,2975 | |||
| XOM / Exxon Mobil Corporation | 0,02 | 3,94 | 2,57 | −5,79 | 1,9317 | −0,3238 | |||
| QQQ / Invesco QQQ Trust, Series 1 | 0,00 | 0,07 | 2,31 | 17,72 | 1,7306 | 0,1133 | |||
| NOW / ServiceNow, Inc. | 0,00 | 0,98 | 2,23 | 30,37 | 1,6760 | 0,2620 | |||
| V / Visa Inc. | 0,01 | 1,56 | 2,11 | 2,88 | 1,5818 | −0,1098 | |||
| IBM / International Business Machines Corporation | 0,01 | 0,10 | 2,08 | 18,64 | 1,5623 | 0,1138 | |||
| CAT / Caterpillar Inc. | 0,01 | −1,37 | 1,95 | 16,12 | 1,4657 | 0,0768 | |||
| META / Meta Platforms, Inc. | 0,00 | −2,27 | 1,90 | 25,20 | 1,4286 | 0,1727 | |||
| TRV / The Travelers Companies, Inc. | 0,01 | 1,87 | 1,79 | 3,05 | 1,3452 | −0,0907 | |||
| LLY / Eli Lilly and Company | 0,00 | 11,21 | 1,74 | 4,95 | 1,3060 | −0,0627 | |||
| MMM / 3M Company | 0,01 | 17,02 | 1,70 | 21,30 | 1,2741 | 0,1187 | |||
| SAP / SAP SE - Depositary Receipt (Common Stock) | 0,01 | −0,81 | 1,64 | 12,39 | 1,2326 | 0,0259 | |||
| COST / Costco Wholesale Corporation | 0,00 | 1,14 | 1,58 | 5,82 | 1,1881 | −0,0466 | |||
| KO / The Coca-Cola Company | 0,02 | 0,41 | 1,55 | −0,77 | 1,1642 | −0,1270 | |||
| TMUS / T-Mobile US, Inc. | 0,01 | −0,87 | 1,49 | −11,46 | 1,1199 | −0,2713 | |||
| HON / Honeywell International Inc. | 0,01 | −6,65 | 1,47 | 2,66 | 1,1000 | −0,0787 | |||
| RTX / RTX Corporation | 0,01 | 1,36 | 1,46 | 11,72 | 1,0946 | 0,0169 | |||
| GJR / Strats Trust For Procter & Gambel Security - Preferred Security | 0,01 | −0,58 | 1,40 | −7,04 | 1,0510 | −0,1929 | |||
| CSCO / Cisco Systems, Inc. | 0,02 | 6,49 | 1,31 | 19,74 | 0,9839 | 0,0798 | |||
| MA / Mastercard Incorporated | 0,00 | −0,91 | 1,28 | 1,58 | 0,9642 | −0,0800 | |||
| PGR / The Progressive Corporation | 0,00 | 0,00 | 1,27 | −5,71 | 0,9542 | −0,1590 | |||
| HD / The Home Depot, Inc. | 0,00 | 5,38 | 1,26 | 5,37 | 0,9434 | −0,0410 | |||
| ETN / Eaton Corporation plc | 0,00 | 0,00 | 1,26 | 31,38 | 0,9429 | 0,1531 | |||
| NKE / NIKE, Inc. | 0,02 | 1,22 | 0,9180 | 0,9180 | |||||
| COF / Capital One Financial Corporation | 0,01 | 7,45 | 1,21 | 27,52 | 0,9119 | 0,1251 | |||
| LOW / Lowe's Companies, Inc. | 0,01 | −3,77 | 1,20 | −8,49 | 0,8981 | −0,1811 | |||
| SHW / The Sherwin-Williams Company | 0,00 | 17,05 | 1,04 | 15,10 | 0,7840 | 0,0346 | |||
| MCD / McDonald's Corporation | 0,00 | −0,51 | 1,02 | −7,00 | 0,7684 | −0,1400 | |||
| T / AT&T Inc. | 0,04 | 0,25 | 1,01 | 2,63 | 0,7616 | −0,0550 | |||
| GILD / Gilead Sciences, Inc. | 0,01 | −0,42 | 1,01 | −1,47 | 0,7559 | −0,0881 | |||
| EPD / Enterprise Products Partners L.P. - Limited Partnership | 0,03 | 0,00 | 1,00 | −9,24 | 0,7527 | −0,1589 | |||
| GD / General Dynamics Corporation | 0,00 | 0,41 | 1,00 | 7,43 | 0,7498 | −0,0179 | |||
| AMGN / Amgen Inc. | 0,00 | −9,03 | 0,97 | −18,49 | 0,7283 | −0,2545 | |||
| INTU / Intuit Inc. | 0,00 | 1,26 | 0,95 | 29,88 | 0,7147 | 0,1094 | |||
| TDG / TransDigm Group Incorporated | 0,00 | 0,00 | 0,84 | 9,95 | 0,6312 | −0,0005 | |||
| BLK / BlackRock, Inc. | 0,00 | −1,24 | 0,83 | 9,59 | 0,6261 | −0,0030 | |||
| ELV / Elevance Health, Inc. | 0,00 | 34,50 | 0,79 | 20,27 | 0,5930 | 0,0506 | |||
| EBAY / eBay Inc. | 0,01 | 49,22 | 0,79 | 64,17 | 0,5917 | 0,1949 | |||
| MS / Morgan Stanley | 0,01 | 1,74 | 0,75 | 22,95 | 0,5632 | 0,0588 | |||
| ABBV / AbbVie Inc. | 0,00 | 16,53 | 0,74 | 3,23 | 0,5530 | −0,0363 | |||
| CMG / Chipotle Mexican Grill, Inc. | 0,01 | 0,01 | 0,72 | 11,78 | 0,5415 | 0,0089 | |||
| TXN / Texas Instruments Incorporated | 0,00 | −53,08 | 0,71 | −45,82 | 0,5312 | −0,5469 | |||
| BAC / Bank of America Corporation | 0,01 | −2,35 | 0,66 | 10,67 | 0,4988 | 0,0033 | |||
| CVX / Chevron Corporation | 0,00 | −12,36 | 0,63 | −24,94 | 0,4701 | −0,2193 | |||
| MRK / Merck & Co., Inc. | 0,01 | −8,14 | 0,62 | −18,96 | 0,4686 | −0,1678 | |||
| DE / Deere & Company | 0,00 | 12,23 | 0,60 | 21,59 | 0,4484 | 0,0427 | |||
| AMZN / Amazon.com, Inc. | 0,00 | −47,02 | 0,60 | −38,97 | 0,4470 | −0,3581 | |||
| MET / MetLife, Inc. | 0,01 | 0,00 | 0,59 | 0,17 | 0,4426 | −0,0435 | |||
| AMD / Advanced Micro Devices, Inc. | 0,00 | 0,56 | 0,4223 | 0,4223 | |||||
| UNH / UnitedHealth Group Incorporated | 0,00 | −38,69 | 0,56 | −63,52 | 0,4208 | −0,8468 | |||
| YUM / Yum! Brands, Inc. | 0,00 | 2,65 | 0,56 | −3,30 | 0,4184 | −0,0578 | |||
| DD / DuPont de Nemours, Inc. | 0,01 | −24,38 | 0,56 | −30,62 | 0,4172 | −0,2436 | |||
| LIN / Linde plc | 0,00 | −0,85 | 0,55 | 0,00 | 0,4124 | −0,0417 | |||
| CMI / Cummins Inc. | 0,00 | 0,00 | 0,53 | 4,50 | 0,4012 | −0,0212 | |||
| C / Citigroup Inc. | 0,01 | 3,12 | 0,53 | 23,72 | 0,3994 | 0,0440 | |||
| SLB / Schlumberger Limited | 0,02 | 0,00 | 0,53 | −19,20 | 0,3955 | −0,1425 | |||
| LMT / Lockheed Martin Corporation | 0,00 | 0,83 | 0,51 | 4,54 | 0,3810 | −0,0199 | |||
| ITW / Illinois Tool Works Inc. | 0,00 | −12,61 | 0,51 | −12,89 | 0,3808 | −0,1000 | |||
| CL / Colgate-Palmolive Company | 0,01 | 0,82 | 0,50 | −2,33 | 0,3790 | −0,0473 | |||
| NOC / Northrop Grumman Corporation | 0,00 | 5,43 | 0,49 | 2,92 | 0,3715 | −0,0254 | |||
| CI / The Cigna Group | 0,00 | 99,47 | 0,49 | 100,81 | 0,3712 | 0,1675 | |||
| VZ / Verizon Communications Inc. | 0,01 | 4,86 | 0,48 | 0,21 | 0,3595 | −0,0359 | |||
| SBUX / Starbucks Corporation | 0,01 | −2,41 | 0,48 | −9,00 | 0,3573 | −0,0738 | |||
| CRM / Salesforce, Inc. | 0,00 | −5,79 | 0,47 | −4,28 | 0,3533 | −0,0527 | |||
| JNJ / Johnson & Johnson | 0,00 | −25,13 | 0,47 | −31,07 | 0,3501 | −0,2083 | |||
| MU / Micron Technology, Inc. | 0,00 | 0,00 | 0,46 | 41,90 | 0,3487 | 0,0783 | |||
| QCOM / QUALCOMM Incorporated | 0,00 | −19,32 | 0,45 | −16,45 | 0,3359 | −0,1059 | |||
| PH / Parker-Hannifin Corporation | 0,00 | 0,00 | 0,41 | 15,08 | 0,3093 | 0,0132 | |||
| CB / Chubb Limited | 0,00 | −2,83 | 0,39 | −6,73 | 0,2914 | −0,0525 | |||
| DELL / Dell Technologies Inc. | 0,00 | 0,06 | 0,38 | 34,63 | 0,2865 | 0,0523 | |||
| TGT / Target Corporation | 0,00 | 0,37 | 0,2780 | 0,2780 | |||||
| PNC / The PNC Financial Services Group, Inc. | 0,00 | 0,05 | 0,36 | 6,18 | 0,2712 | −0,0099 | |||
| ACN / Accenture plc | 0,00 | −2,06 | 0,36 | −6,08 | 0,2665 | −0,0461 | |||
| SCHX / Schwab Strategic Trust - Schwab U.S. Large-Cap ETF | 0,01 | 1,19 | 0,34 | 12,13 | 0,2572 | 0,0046 | |||
| GOOGL / Alphabet Inc. | 0,00 | −5,06 | 0,33 | 8,20 | 0,2481 | −0,0042 | |||
| DHR / Danaher Corporation | 0,00 | −11,61 | 0,33 | −14,84 | 0,2460 | −0,0717 | |||
| GOOG / Alphabet Inc. | 0,00 | 10,23 | 0,32 | 25,10 | 0,2395 | 0,0289 | |||
| ADBE / Adobe Inc. | 0,00 | 3,32 | 0,30 | 4,15 | 0,2262 | −0,0126 | |||
| DBEF / DBX ETF Trust - Xtrackers MSCI EAFE Hedged Equity ETF | 0,01 | 3,23 | 0,30 | 4,17 | 0,2258 | −0,0123 | |||
| SPYX / SPDR Series Trust - SPDR S&P 500 Fossil Fuel Reserves Free ETF | 0,01 | 0,26 | 0,30 | 11,94 | 0,2252 | 0,0032 | |||
| DFUS / Dimensional ETF Trust - Dimensional U.S. Equity Market ETF | 0,00 | 0,09 | 0,29 | 11,07 | 0,2186 | 0,0018 | |||
| SU / Suncor Energy Inc. | 0,01 | 0,00 | 0,27 | −3,19 | 0,2054 | −0,0282 | |||
| ABT / Abbott Laboratories | 0,00 | 10,76 | 0,26 | 13,54 | 0,1954 | 0,0061 | |||
| KDP / Keurig Dr Pepper Inc. | 0,01 | 3,31 | 0,26 | −0,39 | 0,1935 | −0,0198 | |||
| US780153BQ43 / CONV. NOTE | 0,00 | 0,24 | 0,1836 | 0,1836 | |||||
| IWM / iShares Trust - iShares Russell 2000 ETF | 0,00 | 0,18 | 0,24 | 8,72 | 0,1780 | −0,0027 | |||
| USB / U.S. Bancorp | 0,01 | 5,03 | 0,23 | 12,38 | 0,1709 | 0,0039 | |||
| EMN / Eastman Chemical Company | 0,00 | −3,75 | 0,22 | −18,61 | 0,1681 | −0,0586 | |||
| IWD / iShares Trust - iShares Russell 1000 Value ETF | 0,00 | 0,00 | 0,22 | 3,29 | 0,1653 | −0,0109 | |||
| AVY / Avery Dennison Corporation | 0,00 | 0,00 | 0,22 | −1,35 | 0,1649 | −0,0191 | |||
| PFE / Pfizer Inc. | 0,01 | −5,98 | 0,21 | −10,08 | 0,1611 | −0,0359 | |||
| PEP / PepsiCo, Inc. | 0,00 | −32,73 | 0,21 | −40,78 | 0,1593 | −0,1365 | |||
| DON / WisdomTree Trust - WisdomTree U.S. MidCap Dividend Fund | 0,00 | 0,66 | 0,21 | 1,98 | 0,1549 | −0,0123 | |||
| DIS / The Walt Disney Company | 0,00 | −20,66 | 0,21 | 0,00 | 0,1548 | −0,0160 | |||
| QEPC / Q.E.P. Co., Inc. | 0,01 | −83,42 | 0,14 | −87,50 | 0,1018 | −0,7902 | |||
| TMO / Thermo Fisher Scientific Inc. | 0,00 | −100,00 | 0,00 | 0,0000 | |||||
| APD / Air Products and Chemicals, Inc. | 0,00 | −100,00 | 0,00 | 0,0000 |