Grundläggande statistik
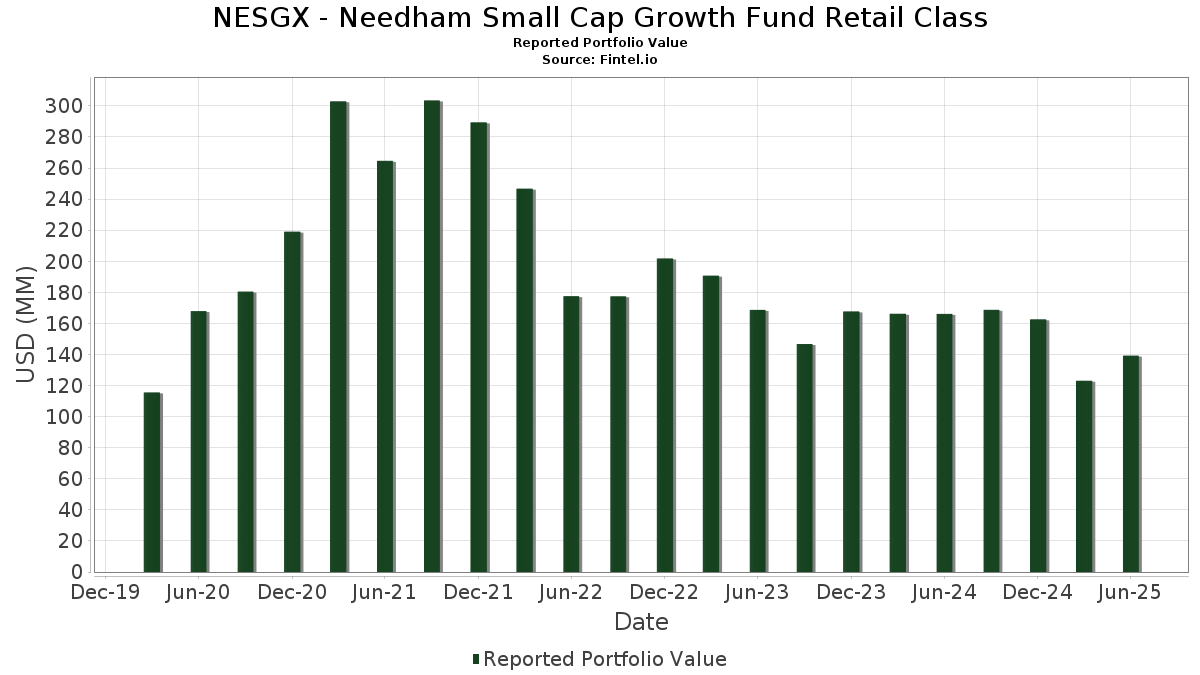
| Portföljvärde | $ 139 172 815 |
| Aktuella positioner | 61 |
Senaste innehav, resultat, förvaltat kapital (från 13F, 13D)
NESGX - Needham Small Cap Growth Fund Retail Class har redovisat 61 totala innehav i sina senaste SEC-arkiveringar. Det senaste portföljvärdet beräknas vara $ 139 172 815 USD. Faktiskt förvaltade tillgångar (AUM) är detta värde plus likvida medel (som inte redovisas). NESGX - Needham Small Cap Growth Fund Retail Classs största innehav är Dreyfus Treasury Securities Cash Management - Dreyfus Treasury Securities Cash Management Institutional Shares (US:DIRXX) , ADTRAN Holdings, Inc. (US:ADTN) , TTM Technologies, Inc. (US:TTMI) , PDF Solutions, Inc. (US:PDFS) , and Harmonic Inc. (US:HLIT) . NESGX - Needham Small Cap Growth Fund Retail Classs nya positioner inkluderar Circle Internet Group, Inc. (US:CRCL) , .
Största ökningarna detta kvartal
Vi använder förändringen i portföljallokeringen eftersom det är det mest meningsfulla måttet. Förändringar kan bero på transaktioner eller förändringar i aktiekurser.
| Värdepapper | Aktier (MM) |
Värde (MM$) |
Portfölj % av | ΔPortfölj % av |
|---|---|---|---|---|
| 14,51 | 14,51 | 10,4354 | 9,9880 | |
| 0,54 | 5,10 | 3,6656 | 1,3599 | |
| 0,16 | 3,70 | 2,6607 | 0,9347 | |
| 0,03 | 2,11 | 1,5199 | 0,9234 | |
| 0,04 | 0,79 | 0,5679 | 0,5679 | |
| 0,15 | 2,35 | 1,6888 | 0,4498 | |
| 0,01 | 1,52 | 1,0920 | 0,4207 | |
| 0,06 | 2,70 | 1,9380 | 0,4053 | |
| 0,28 | 2,07 | 1,4910 | 0,3529 | |
| 0,01 | 0,97 | 0,6958 | 0,2686 |
Största minskningarna detta kvartal
Vi använder förändringen i portföljallokeringen eftersom det är det mest meningsfulla måttet. Förändringar kan bero på transaktioner eller förändringar i aktiepriser.
| Värdepapper | Aktier (MM) |
Värde (MM$) |
Portfölj % av | ΔPortfölj % av |
|---|---|---|---|---|
| 0,04 | 2,13 | 1,5296 | −4,5850 | |
| 0,05 | 2,27 | 1,6306 | −1,9862 | |
| 0,15 | 2,95 | 2,1223 | −1,8552 | |
| 0,01 | 1,47 | 1,0566 | −1,1884 | |
| 0,03 | 0,26 | 0,1833 | −0,6439 | |
| 0,93 | 8,30 | 5,9653 | −0,5991 | |
| 0,42 | 2,12 | 1,5278 | −0,5817 | |
| 0,01 | 0,54 | 0,3872 | −0,5772 | |
| 0,56 | 5,35 | 3,8468 | −0,5629 | |
| 0,16 | 0,86 | 0,6185 | −0,4578 |
13F- och fond arkiveringar
Denna blankett lämnades in den 2025-08-20 för rapporteringsperioden 2025-06-30. Klicka på länksymbolen för att se hela transaktionshistoriken.
Uppgradera för att låsa upp premiumdata och exportera till Excel![]() .
.
| Värdepapper | Typ | Genomsnittligt aktiepris | Aktier (MM) |
ΔAktier (%) |
ΔAktier (%) |
Värde ($MM) |
Portfölj (%) |
ΔPortfölj (%) |
|
|---|---|---|---|---|---|---|---|---|---|
| DIRXX / Dreyfus Treasury Securities Cash Management - Dreyfus Treasury Securities Cash Management Institutional Shares | 14,51 | 2 540,65 | 14,51 | 2 543,72 | 10,4354 | 9,9880 | |||
| ADTN / ADTRAN Holdings, Inc. | 0,93 | 0,00 | 8,30 | 2,86 | 5,9653 | −0,5991 | |||
| TTMI / TTM Technologies, Inc. | 0,18 | −44,24 | 7,55 | 10,98 | 5,4293 | −0,1082 | |||
| PDFS / PDF Solutions, Inc. | 0,33 | 4,49 | 7,04 | 16,91 | 5,0594 | 0,1604 | |||
| HLIT / Harmonic Inc. | 0,56 | 0,00 | 5,35 | −1,26 | 3,8468 | −0,5629 | |||
| AIP / Arteris, Inc. | 0,54 | 30,49 | 5,10 | 79,95 | 3,6656 | 1,3599 | |||
| ASPN / Aspen Aerogels, Inc. | 0,77 | 10,64 | 4,59 | 2,50 | 3,2964 | −0,3439 | |||
| VSH / Vishay Intertechnology, Inc. | 0,26 | 10,64 | 4,13 | 10,49 | 2,9684 | −0,0725 | |||
| ROG / Rogers Corporation | 0,06 | 0,00 | 3,77 | 1,40 | 2,7078 | −0,3149 | |||
| GTLS / Chart Industries, Inc. | 0,02 | −6,25 | 3,70 | 6,93 | 2,6634 | −0,1562 | |||
| RPD / Rapid7, Inc. | 0,16 | 100,00 | 3,70 | 74,53 | 2,6607 | 0,9347 | |||
| LASR / nLIGHT, Inc. | 0,15 | −76,15 | 2,95 | −39,59 | 2,1223 | −1,8552 | |||
| SMCI / Super Micro Computer, Inc. | 0,06 | 0,00 | 2,70 | 43,12 | 1,9380 | 0,4053 | |||
| CEVA / CEVA, Inc. | 0,12 | 25,00 | 2,53 | 7,26 | 1,8173 | −0,1002 | |||
| VECO / Veeco Instruments Inc. | 0,12 | 0,00 | 2,44 | 1,20 | 1,7531 | −0,2079 | |||
| PRO / PROS Holdings, Inc. | 0,15 | 87,50 | 2,35 | 54,34 | 1,6888 | 0,4498 | |||
| COHU / Cohu, Inc. | 0,12 | 0,00 | 2,27 | 30,84 | 1,6322 | 0,2196 | |||
| VICR / Vicor Corporation | 0,05 | −47,37 | 2,27 | −48,96 | 1,6306 | −1,9862 | |||
| MXL / MaxLinear, Inc. | 0,15 | 3,33 | 2,20 | 35,17 | 1,5835 | 0,2578 | |||
| TRNS / Transcat, Inc. | 0,03 | 0,00 | 2,15 | 15,48 | 1,5450 | 0,0303 | |||
| CALX / Calix, Inc. | 0,04 | −81,13 | 2,13 | −71,69 | 1,5296 | −4,5850 | |||
| BIGC / Commerce.com, Inc. | 0,42 | −5,56 | 2,12 | −18,02 | 1,5278 | −0,5817 | |||
| CAMT / Camtek Ltd. | 0,03 | 100,00 | 2,11 | 188,80 | 1,5199 | 0,9234 | |||
| VPG / Vishay Precision Group, Inc. | 0,07 | −23,23 | 2,11 | −10,45 | 1,5152 | −0,4003 | |||
| CYRX / Cryoport, Inc. | 0,28 | 20,87 | 2,07 | 48,28 | 1,4910 | 0,3529 | |||
| UIS / Unisys Corporation | 0,44 | 0,00 | 2,01 | −1,33 | 1,4428 | −0,2121 | |||
| MKSI / MKS Inc. | 0,02 | 0,00 | 1,99 | 23,96 | 1,4287 | 0,1241 | |||
| PENG / Penguin Solutions, Inc. | 0,10 | 0,00 | 1,98 | 14,05 | 1,4242 | 0,0106 | |||
| MTN / Vail Resorts, Inc. | 0,01 | 0,00 | 1,96 | −1,80 | 1,4121 | −0,2158 | |||
| ALGM / Allegro MicroSystems, Inc. | 0,05 | 0,00 | 1,71 | 36,07 | 1,2290 | 0,2065 | |||
| BSY / Bentley Systems, Incorporated | 0,03 | 0,00 | 1,62 | 37,20 | 1,1640 | 0,2036 | |||
| GNRC / Generac Holdings Inc. | 0,01 | 0,00 | 1,58 | 13,07 | 1,1326 | −0,0012 | |||
| BRKR / Bruker Corporation | 0,04 | 0,00 | 1,54 | −1,28 | 1,1108 | −0,1631 | |||
| NSIT / Insight Enterprises, Inc. | 0,01 | 100,00 | 1,52 | 84,22 | 1,0920 | 0,4207 | |||
| CGNX / Cognex Corporation | 0,05 | 0,00 | 1,51 | 6,36 | 1,0832 | −0,0699 | |||
| BMI / Badger Meter, Inc. | 0,01 | −58,62 | 1,47 | −46,74 | 1,0566 | −1,1884 | |||
| PSN / Parsons Corporation | 0,02 | 0,00 | 1,44 | 21,20 | 1,0320 | 0,0682 | |||
| MATW / Matthews International Corporation | 0,06 | 26,32 | 1,43 | 35,80 | 1,0314 | 0,1717 | |||
| MRVL / Marvell Technology, Inc. | 0,02 | 0,00 | 1,39 | 25,72 | 1,0016 | 0,0997 | |||
| FORM / FormFactor, Inc. | 0,04 | −20,00 | 1,38 | −2,69 | 0,9896 | −0,1616 | |||
| ICHR / Ichor Holdings, Ltd. | 0,07 | 60,71 | 1,33 | 39,62 | 0,9531 | 0,1803 | |||
| PLAB / Photronics, Inc. | 0,07 | 0,00 | 1,32 | −9,29 | 0,9476 | −0,2350 | |||
| SITM / SiTime Corporation | 0,01 | −28,57 | 1,07 | −0,47 | 0,7660 | −0,1049 | |||
| MBLY / Mobileye Global Inc. | 0,05 | 0,00 | 0,97 | 25,03 | 0,6967 | 0,0653 | |||
| ENTG / Entegris, Inc. | 0,01 | 100,00 | 0,97 | 84,54 | 0,6958 | 0,2686 | |||
| KVHI / KVH Industries, Inc. | 0,16 | −35,44 | 0,86 | −34,95 | 0,6185 | −0,4578 | |||
| ECG / Everus Construction Group, Inc. | 0,01 | 0,00 | 0,79 | 71,49 | 0,5709 | 0,1936 | |||
| UCTT / Ultra Clean Holdings, Inc. | 0,04 | 0,79 | 0,5679 | 0,5679 | |||||
| MDU / MDU Resources Group, Inc. | 0,04 | 0,00 | 0,75 | −1,32 | 0,5393 | −0,0800 | |||
| AKAM / Akamai Technologies, Inc. | 0,01 | 0,00 | 0,72 | −0,97 | 0,5161 | −0,0735 | |||
| TENB / Tenable Holdings, Inc. | 0,02 | 100,00 | 0,68 | 93,41 | 0,4857 | 0,2010 | |||
| AXTI / AXT, Inc. | 0,30 | −45,45 | 0,63 | −19,10 | 0,4508 | −0,1804 | |||
| PSTG / Pure Storage, Inc. | 0,01 | 0,00 | 0,58 | 30,09 | 0,4140 | 0,0537 | |||
| MRCY / Mercury Systems, Inc. | 0,01 | −63,64 | 0,54 | −54,56 | 0,3872 | −0,5772 | |||
| CTRI / Centuri Holdings, Inc. | 0,02 | 0,00 | 0,50 | 36,96 | 0,3630 | 0,0629 | |||
| LAB / Standard BioTools Inc. | 0,40 | −20,00 | 0,48 | −11,11 | 0,3451 | −0,0944 | |||
| EXTR / Extreme Networks, Inc. | 0,03 | 0,00 | 0,45 | 35,76 | 0,3226 | 0,0535 | |||
| POWI / Power Integrations, Inc. | 0,01 | 50,00 | 0,42 | 66,27 | 0,3014 | 0,0959 | |||
| YEXT / Yext, Inc. | 0,03 | −81,82 | 0,26 | −74,90 | 0,1833 | −0,6439 | |||
| CMTL / Comtech Telecommunications Corp. | 0,10 | 0,00 | 0,24 | 53,13 | 0,1761 | 0,0459 | |||
| CRCL / Circle Internet Group, Inc. | 0,00 | 0,19 | 0,1332 | 0,1332 | |||||
| APLD / Applied Digital Corporation | 0,00 | −100,00 | 0,00 | −100,00 | −0,0457 | ||||
| TTD / The Trade Desk, Inc. | 0,00 | −100,00 | 0,00 | −100,00 | −0,2227 |