Grundläggande statistik
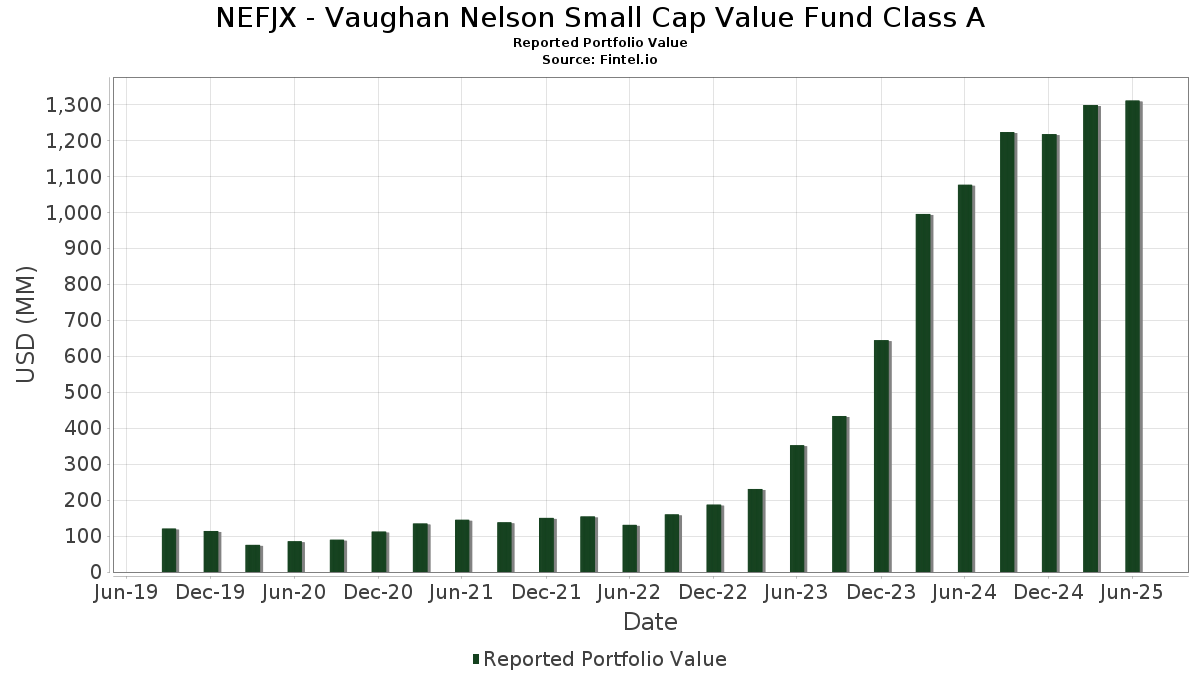
| Portföljvärde | $ 1 310 373 273 |
| Aktuella positioner | 55 |
Senaste innehav, resultat, förvaltat kapital (från 13F, 13D)
NEFJX - Vaughan Nelson Small Cap Value Fund Class A har redovisat 55 totala innehav i sina senaste SEC-arkiveringar. Det senaste portföljvärdet beräknas vara $ 1 310 373 273 USD. Faktiskt förvaltade tillgångar (AUM) är detta värde plus likvida medel (som inte redovisas). NEFJX - Vaughan Nelson Small Cap Value Fund Class As största innehav är iShares Trust - iShares Russell 2000 Value ETF (US:IWN) , Artisan Partners Asset Management Inc. (US:APAM) , Western Alliance Bancorporation (US:WAL) , Cullen/Frost Bankers, Inc. (US:CFR) , and Installed Building Products, Inc. (US:IBP) . NEFJX - Vaughan Nelson Small Cap Value Fund Class As nya positioner inkluderar WESCO International, Inc. (US:WCC) , Silgan Holdings Inc. (US:SLGN) , Clean Harbors, Inc. (US:CLH) , Herc Holdings Inc. (US:HRI) , and Hexcel Corporation (US:HXL) .
Största ökningarna detta kvartal
Vi använder förändringen i portföljallokeringen eftersom det är det mest meningsfulla måttet. Förändringar kan bero på transaktioner eller förändringar i aktiekurser.
| Värdepapper | Aktier (MM) |
Värde (MM$) |
Portfölj % av | ΔPortfölj % av |
|---|---|---|---|---|
| 46,79 | 3,5693 | 3,5693 | ||
| 0,13 | 23,46 | 1,7893 | 1,7893 | |
| 0,33 | 29,56 | 2,2551 | 1,6963 | |
| 0,38 | 20,59 | 1,5706 | 1,5706 | |
| 0,09 | 19,85 | 1,5141 | 1,5141 | |
| 0,28 | 22,48 | 1,7150 | 1,2993 | |
| 0,13 | 16,80 | 1,2813 | 1,2813 | |
| 0,29 | 16,36 | 1,2481 | 1,2481 | |
| 0,41 | 16,32 | 1,2446 | 1,2446 | |
| 1,51 | 14,22 | 1,0844 | 1,0844 |
Största minskningarna detta kvartal
Vi använder förändringen i portföljallokeringen eftersom det är det mest meningsfulla måttet. Förändringar kan bero på transaktioner eller förändringar i aktiepriser.
| Värdepapper | Aktier (MM) |
Värde (MM$) |
Portfölj % av | ΔPortfölj % av |
|---|---|---|---|---|
| 0,05 | 5,72 | 0,4365 | −1,3653 | |
| 0,02 | 1,79 | 0,1367 | −1,0285 | |
| 0,00 | 0,00 | −0,8797 | ||
| 0,58 | 34,37 | 2,6218 | −0,5556 | |
| 0,45 | 34,86 | 2,6588 | −0,5133 | |
| 0,16 | 25,44 | 1,9404 | −0,4982 | |
| 0,35 | 17,84 | 1,3612 | −0,4810 | |
| 0,19 | 11,26 | 0,8587 | −0,4782 | |
| 0,40 | 17,44 | 1,3305 | −0,4542 | |
| 1,35 | 30,59 | 2,3332 | −0,3547 |
13F- och fond arkiveringar
Denna blankett lämnades in den 2025-08-29 för rapporteringsperioden 2025-06-30. Klicka på länksymbolen för att se hela transaktionshistoriken.
Uppgradera för att låsa upp premiumdata och exportera till Excel![]() .
.
| Värdepapper | Typ | Genomsnittligt aktiepris | Aktier (MM) |
ΔAktier (%) |
ΔAktier (%) |
Värde ($MM) |
Portfölj (%) |
ΔPortfölj (%) |
|
|---|---|---|---|---|---|---|---|---|---|
| IWN / iShares Trust - iShares Russell 2000 Value ETF | 0,42 | 2,52 | 65,98 | 7,13 | 5,0329 | 0,2955 | |||
| FIXED INC CLEARING CORP.REPO / RA (000000000) | 46,79 | 3,5693 | 3,5693 | ||||||
| APAM / Artisan Partners Asset Management Inc. | 0,83 | 22,79 | 36,61 | 39,22 | 2,7928 | 0,7700 | |||
| WAL / Western Alliance Bancorporation | 0,45 | −16,73 | 34,86 | −15,48 | 2,6588 | −0,5133 | |||
| CFR / Cullen/Frost Bankers, Inc. | 0,27 | 11,11 | 34,78 | 14,07 | 2,6529 | 0,3079 | |||
| IBP / Installed Building Products, Inc. | 0,19 | 9,92 | 34,57 | 15,60 | 2,6371 | 0,3368 | |||
| CMA / Comerica Incorporated | 0,58 | −17,62 | 34,37 | −16,80 | 2,6218 | −0,5556 | |||
| 2IY / Cushman & Wakefield plc | 3,10 | 13,14 | 34,35 | 22,55 | 2,6203 | 0,4643 | |||
| ZION / Zions Bancorporation, National Association | 0,63 | −10,94 | 32,52 | −7,23 | 2,4805 | −0,2155 | |||
| SIGI / Selective Insurance Group, Inc. | 0,37 | 1,06 | 32,47 | −4,33 | 2,4767 | −0,1339 | |||
| HII / Huntington Ingalls Industries, Inc. | 0,13 | 22,16 | 32,35 | 44,56 | 2,4674 | 0,7463 | |||
| RRR / Red Rock Resorts, Inc. | 0,61 | 8,09 | 31,48 | 29,68 | 2,4016 | 0,5341 | |||
| VVV / Valvoline Inc. | 0,82 | 17,13 | 31,22 | 27,42 | 2,3811 | 0,4968 | |||
| CADE / Cadence Bank | 0,97 | 18,06 | 31,16 | 24,36 | 2,3768 | 0,4496 | |||
| ESI / Element Solutions Inc | 1,35 | −12,63 | 30,59 | −12,47 | 2,3332 | −0,3547 | |||
| PB / Prosperity Bancshares, Inc. | 0,42 | 12,25 | 29,72 | 10,47 | 2,2666 | 0,1977 | |||
| COHR / Coherent Corp. | 0,33 | 196,23 | 29,56 | 306,94 | 2,2551 | 1,6963 | |||
| AR / Antero Resources Corporation | 0,72 | 9,50 | 29,06 | 9,07 | 2,2167 | 0,1673 | |||
| KEX / Kirby Corporation | 0,24 | 10,01 | 27,21 | 23,52 | 2,0756 | 0,3812 | |||
| JBTM / JBT Marel Corporation | 0,22 | 17,89 | 26,66 | 16,01 | 2,0335 | 0,2661 | |||
| THG / The Hanover Insurance Group, Inc. | 0,16 | 22,73 | 26,51 | 19,85 | 2,0221 | 0,3208 | |||
| FCFS / FirstCash Holdings, Inc. | 0,19 | −11,63 | 26,31 | −0,74 | 2,0068 | −0,0319 | |||
| GXO / GXO Logistics, Inc. | 0,54 | −8,97 | 26,24 | 13,44 | 2,0016 | 0,2224 | |||
| CLS / Celestica Inc. | 0,16 | −49,40 | 25,44 | −14,42 | 1,9404 | −0,4982 | |||
| STAG / STAG Industrial, Inc. | 0,67 | −0,16 | 24,24 | 0,28 | 1,8492 | −0,0102 | |||
| WCC / WESCO International, Inc. | 0,13 | 23,46 | 1,7893 | 1,7893 | |||||
| SR / Spire Inc. | 0,31 | 7,10 | 22,63 | −0,10 | 1,7259 | −0,0161 | |||
| CIEN / Ciena Corporation | 0,28 | 209,10 | 22,48 | 316,06 | 1,7150 | 1,2993 | |||
| GATX / GATX Corporation | 0,15 | 49,53 | 22,43 | 47,88 | 1,7110 | 0,5443 | |||
| HWKN / Hawkins, Inc. | 0,15 | 32,87 | 21,75 | 78,26 | 1,6591 | 0,7206 | |||
| LECO / Lincoln Electric Holdings, Inc. | 0,10 | 25,00 | 21,24 | 37,00 | 1,6204 | 0,4278 | |||
| EXP / Eagle Materials Inc. | 0,10 | 192,00 | 20,85 | 165,94 | 1,5904 | 0,9874 | |||
| VMI / Valmont Industries, Inc. | 0,06 | 40,11 | 20,61 | 60,35 | 1,5718 | 0,5833 | |||
| SLGN / Silgan Holdings Inc. | 0,38 | 20,59 | 1,5706 | 1,5706 | |||||
| GIL / Gildan Activewear Inc. | 0,41 | 13,84 | 20,37 | 26,77 | 1,5537 | 0,3178 | |||
| CLH / Clean Harbors, Inc. | 0,09 | 19,85 | 1,5141 | 1,5141 | |||||
| BRKR / Bruker Corporation | 0,45 | 83,79 | 18,63 | 81,41 | 1,4213 | 0,6313 | |||
| RUSHA / Rush Enterprises, Inc. | 0,35 | −22,75 | 17,84 | −25,49 | 1,3612 | −0,4810 | |||
| NNN / NNN REIT, Inc. | 0,40 | −25,75 | 17,44 | −24,83 | 1,3305 | −0,4542 | |||
| WTS / Watts Water Technologies, Inc. | 0,07 | 326,73 | 16,94 | 403,72 | 1,2918 | 0,7754 | |||
| HRI / Herc Holdings Inc. | 0,13 | 16,80 | 1,2813 | 1,2813 | |||||
| FSS / Federal Signal Corporation | 0,16 | 29,29 | 16,78 | 87,09 | 1,2801 | 0,5901 | |||
| HXL / Hexcel Corporation | 0,29 | 16,36 | 1,2481 | 1,2481 | |||||
| NWN / Northwest Natural Holding Company | 0,41 | 16,32 | 1,2446 | 1,2446 | |||||
| TNET / TriNet Group, Inc. | 0,22 | 85,69 | 15,94 | 71,40 | 1,2162 | 0,5007 | |||
| WRBY / Warby Parker Inc. | 0,70 | 104,91 | 15,44 | 146,50 | 1,1780 | 0,6961 | |||
| BWXT / BWX Technologies, Inc. | 0,10 | −45,59 | 15,09 | −20,54 | 1,1514 | −0,3097 | |||
| CCCS / CCC Intelligent Solutions Holdings Inc. | 1,51 | 14,22 | 1,0844 | 1,0844 | |||||
| GMED / Globus Medical, Inc. | 0,19 | −19,67 | 11,26 | −35,23 | 0,8587 | −0,4782 | |||
| ADMA / ADMA Biologics, Inc. | 0,61 | 11,03 | 0,8410 | 0,8410 | |||||
| MTDR / Matador Resources Company | 0,23 | −6,17 | 10,74 | −12,36 | 0,8194 | −0,1234 | |||
| PR / Permian Resources Corporation | 0,78 | −10,89 | 10,67 | −12,38 | 0,8137 | −0,1226 | |||
| MUR / Murphy Oil Corporation | 0,45 | −3,28 | 10,02 | −23,37 | 0,7643 | −0,2414 | |||
| COKE / Coca-Cola Consolidated, Inc. | 0,05 | 186,40 | 5,72 | −70,53 | 0,4365 | −1,3653 | |||
| LNW / Light & Wonder, Inc. | 0,02 | −4,76 | 1,79 | 10,35 | 0,1367 | −1,0285 | |||
| ITGR / Integer Holdings Corporation | 0,00 | −100,00 | 0,00 | −100,00 | −0,8797 |