Grundläggande statistik
| Portföljvärde | $ 9 853 648 |
| Aktuella positioner | 139 |
Senaste innehav, resultat, förvaltat kapital (från 13F, 13D)
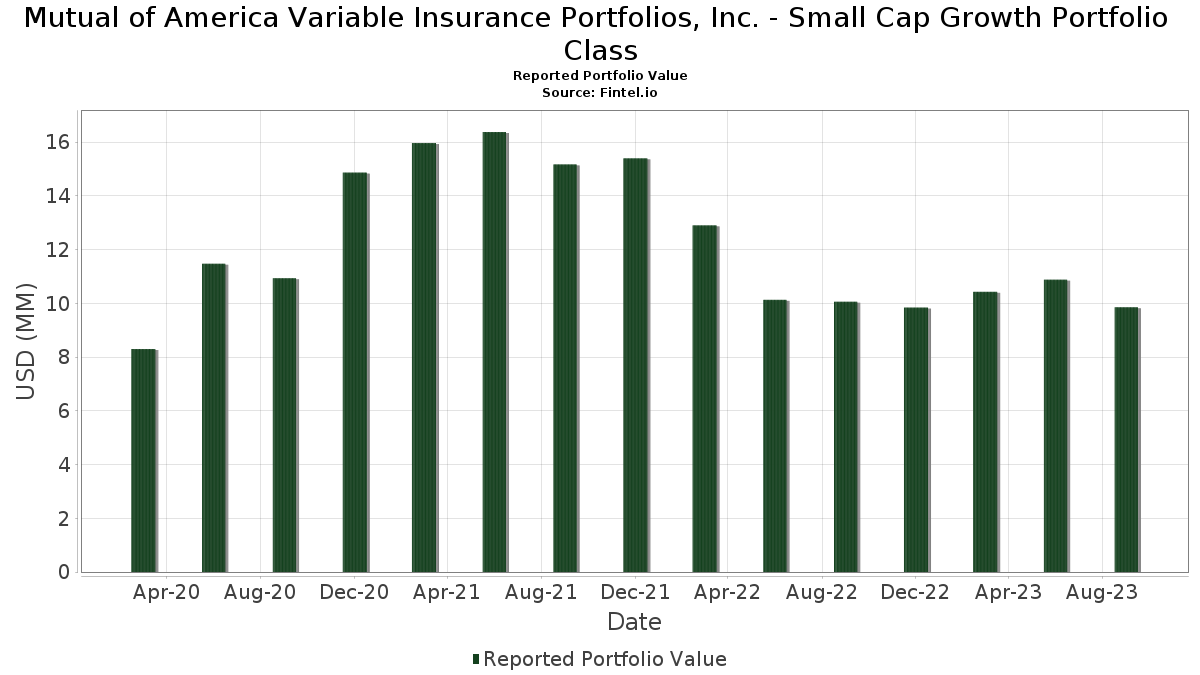
Mutual of America Variable Insurance Portfolios, Inc. - Small Cap Growth Portfolio Class har redovisat 139 totala innehav i sina senaste SEC-arkiveringar. Det senaste portföljvärdet beräknas vara $ 9 853 648 USD. Faktiskt förvaltade tillgångar (AUM) är detta värde plus likvida medel (som inte redovisas). Mutual of America Variable Insurance Portfolios, Inc. - Small Cap Growth Portfolio Classs största innehav är Northern Oil and Gas, Inc. (US:NOG) , ESCO Technologies Inc. (US:ESE) , Chart Industries, Inc. (US:GTLS) , Federal Signal Corporation (US:FSS) , and EMCOR Group, Inc. (US:EME) . Mutual of America Variable Insurance Portfolios, Inc. - Small Cap Growth Portfolio Classs nya positioner inkluderar Rambus Inc. (US:RMBS) , Advanced Energy Industries, Inc. (US:AEIS) , Coca-Cola Consolidated, Inc. (US:COKE) , Harmonic Inc. (US:HLIT) , and Axcelis Technologies, Inc. (US:ACLS) .
Största ökningarna detta kvartal
Vi använder förändringen i portföljallokeringen eftersom det är det mest meningsfulla måttet. Förändringar kan bero på transaktioner eller förändringar i aktiekurser.
| Värdepapper | Aktier (MM) |
Värde (MM$) |
Portfölj % av | ΔPortfölj % av |
|---|---|---|---|---|
| 0,00 | 0,14 | 1,4100 | 0,9083 | |
| 0,00 | 0,08 | 0,7565 | 0,7565 | |
| 0,00 | 0,06 | 0,6234 | 0,6234 | |
| 0,00 | 0,06 | 0,6064 | 0,6064 | |
| 0,01 | 0,05 | 0,5179 | 0,5179 | |
| 0,00 | 0,05 | 0,4823 | 0,4823 | |
| 0,00 | 0,20 | 1,9809 | 0,4571 | |
| 0,01 | 0,21 | 2,1328 | 0,4377 | |
| 0,00 | 0,09 | 0,8479 | 0,4162 | |
| 0,00 | 0,04 | 0,4013 | 0,4013 |
Största minskningarna detta kvartal
Vi använder förändringen i portföljallokeringen eftersom det är det mest meningsfulla måttet. Förändringar kan bero på transaktioner eller förändringar i aktiepriser.
| Värdepapper | Aktier (MM) |
Värde (MM$) |
Portfölj % av | ΔPortfölj % av |
|---|---|---|---|---|
| 0,00 | 0,07 | 0,6920 | −1,2883 | |
| 0,00 | 0,00 | −1,1187 | ||
| 0,00 | 0,02 | 0,1753 | −0,6171 | |
| 0,00 | 0,09 | 0,9346 | −0,5413 | |
| 0,00 | 0,04 | 0,4107 | −0,5278 | |
| 0,00 | 0,03 | 0,2747 | −0,4817 | |
| 0,00 | 0,04 | 0,3768 | −0,4637 | |
| 0,00 | 0,06 | 0,5715 | −0,4440 | |
| 0,00 | 0,03 | 0,3088 | −0,4318 | |
| 0,00 | 0,03 | 0,3416 | −0,3849 |
13F- och fond arkiveringar
Denna blankett lämnades in den 2023-11-16 för rapporteringsperioden 2023-09-30. Klicka på länksymbolen för att se hela transaktionshistoriken.
Uppgradera för att låsa upp premiumdata och exportera till Excel![]() .
.
| Värdepapper | Typ | Genomsnittligt aktiepris | Aktier (MM) |
ΔAktier (%) |
ΔAktier (%) |
Värde ($MM) |
Portfölj (%) |
ΔPortfölj (%) |
|
|---|---|---|---|---|---|---|---|---|---|
| NOG / Northern Oil and Gas, Inc. | 0,01 | −1,51 | 0,21 | 15,05 | 2,1328 | 0,4377 | |||
| ESE / ESCO Technologies Inc. | 0,00 | −1,51 | 0,20 | −0,49 | 2,0278 | 0,1533 | |||
| GTLS / Chart Industries, Inc. | 0,00 | 12,70 | 0,20 | 19,16 | 1,9809 | 0,4571 | |||
| FSS / Federal Signal Corporation | 0,00 | −17,51 | 0,19 | −23,02 | 1,9269 | −0,3708 | |||
| EME / EMCOR Group, Inc. | 0,00 | −11,62 | 0,18 | 0,55 | 1,8106 | 0,1596 | |||
| ICFI / ICF International, Inc. | 0,00 | −15,87 | 0,16 | −18,59 | 1,6153 | −0,1985 | |||
| THS / TreeHouse Foods, Inc. | 0,00 | −1,52 | 0,16 | −14,59 | 1,5716 | −0,1211 | |||
| CHX / ChampionX Corporation | 0,00 | −1,50 | 0,15 | 13,24 | 1,5313 | 0,2882 | |||
| SMCI / Super Micro Computer, Inc. | 0,00 | 134,39 | 0,14 | 158,18 | 1,4100 | 0,9083 | |||
| HURN / Huron Consulting Group Inc. | 0,00 | −1,52 | 0,14 | 20,51 | 1,4030 | 0,3373 | |||
| ADUS / Addus HomeCare Corporation | 0,00 | −1,52 | 0,14 | −9,21 | 1,3707 | −0,0190 | |||
| GDEN / Golden Entertainment, Inc. | 0,00 | −0,18 | 0,13 | −18,52 | 1,3157 | −0,1633 | |||
| BLMN / Bloomin' Brands, Inc. | 0,01 | −1,51 | 0,13 | −10,27 | 1,3059 | −0,0245 | |||
| OLLI / Ollie's Bargain Outlet Holdings, Inc. | 0,00 | −1,48 | 0,12 | 32,26 | 1,2227 | 0,3680 | |||
| FELE / Franklin Electric Co., Inc. | 0,00 | −1,48 | 0,11 | −14,39 | 1,1222 | −0,0830 | |||
| ATKR / Atkore Inc. | 0,00 | −1,57 | 0,11 | −5,08 | 1,1122 | 0,0285 | |||
| ATI / ATI Inc. | 0,00 | 8,06 | 0,11 | 0,91 | 1,1061 | 0,0966 | |||
| UFPI / UFP Industries, Inc. | 0,00 | −1,55 | 0,11 | 3,77 | 1,0957 | 0,1278 | |||
| FN / Fabrinet | 0,00 | −15,96 | 0,11 | 8,16 | 1,0535 | 0,1569 | |||
| SWN / Southwestern Energy Company | 0,02 | −1,51 | 0,10 | 5,15 | 1,0199 | 0,1345 | |||
| DOOR / Masonite International Corporation | 0,00 | −1,55 | 0,10 | −10,71 | 1,0012 | −0,0242 | |||
| CWST / Casella Waste Systems, Inc. | 0,00 | −1,50 | 0,10 | −17,50 | 0,9914 | −0,1034 | |||
| GSHD / Goosehead Insurance, Inc | 0,00 | −1,49 | 0,10 | 16,67 | 0,9802 | 0,2098 | |||
| FRPT / Freshpet, Inc. | 0,00 | −1,54 | 0,10 | −2,04 | 0,9606 | 0,0663 | |||
| ONTO / Onto Innovation Inc. | 0,00 | −1,57 | 0,10 | 7,87 | 0,9544 | 0,1418 | |||
| XPEL / XPEL, Inc. | 0,00 | −36,54 | 0,09 | −41,98 | 0,9346 | −0,5413 | |||
| AMPH / Amphastar Pharmaceuticals, Inc. | 0,00 | −15,59 | 0,09 | −33,09 | 0,9121 | −0,3269 | |||
| SAIA / Saia, Inc. | 0,00 | −12,64 | 0,09 | 1,12 | 0,9022 | 0,0883 | |||
| PJT / PJT Partners Inc. | 0,00 | −1,47 | 0,09 | 12,50 | 0,8974 | 0,1648 | |||
| FIVN / Five9, Inc. | 0,00 | 2,57 | 0,09 | −20,54 | 0,8929 | −0,1314 | |||
| NXGN / NextGen Healthcare Inc | 0,00 | −11,37 | 0,09 | 28,99 | 0,8925 | 0,2609 | |||
| FOXF / Fox Factory Holding Corp. | 0,00 | −1,53 | 0,09 | −10,10 | 0,8851 | −0,0182 | |||
| EVRI / Everi Holdings Inc. | 0,01 | −1,51 | 0,09 | −10,20 | 0,8803 | −0,0168 | |||
| HLI / Houlihan Lokey, Inc. | 0,00 | −1,56 | 0,09 | 7,32 | 0,8751 | 0,1265 | |||
| FFIN / First Financial Bankshares, Inc. | 0,00 | −1,52 | 0,09 | −13,86 | 0,8727 | −0,0495 | |||
| AMN / AMN Healthcare Services, Inc. | 0,00 | −1,54 | 0,09 | −23,01 | 0,8675 | −0,1681 | |||
| NOVT / Novanta Inc. | 0,00 | −3,65 | 0,09 | −24,35 | 0,8643 | −0,1921 | |||
| SIGI / Selective Insurance Group, Inc. | 0,00 | −12,66 | 0,09 | 73,47 | 0,8479 | 0,4162 | |||
| PDFS / PDF Solutions, Inc. | 0,00 | 26,94 | 0,08 | −9,68 | 0,8426 | −0,0052 | |||
| PRI / Primerica, Inc. | 0,00 | −14,40 | 0,08 | −16,00 | 0,8358 | −0,0774 | |||
| RPD / Rapid7, Inc. | 0,00 | −1,52 | 0,08 | 0,00 | 0,8266 | 0,0649 | |||
| CHK / Chesapeake Energy Corporation | 0,00 | −1,53 | 0,08 | 2,47 | 0,8251 | 0,0790 | |||
| LNTH / Lantheus Holdings, Inc. | 0,00 | −1,51 | 0,08 | −18,18 | 0,8076 | −0,1012 | |||
| BJ / BJ's Wholesale Club Holdings, Inc. | 0,00 | −1,55 | 0,08 | 11,59 | 0,7665 | 0,1358 | |||
| CPK / Chesapeake Utilities Corporation | 0,00 | −1,50 | 0,08 | −18,95 | 0,7656 | −0,1026 | |||
| IWC / iShares Trust - iShares Micro-Cap ETF | 0,00 | −1,54 | 0,08 | −9,52 | 0,7601 | −0,0134 | |||
| RMBS / Rambus Inc. | 0,00 | 0,08 | 0,7565 | 0,7565 | |||||
| VVV / Valvoline Inc. | 0,00 | −1,51 | 0,08 | −15,73 | 0,7521 | −0,0631 | |||
| ZUO / Zuora, Inc. | 0,01 | 8,96 | 0,08 | −18,48 | 0,7510 | −0,0910 | |||
| HQY / HealthEquity, Inc. | 0,00 | −1,53 | 0,08 | 13,64 | 0,7483 | 0,1456 | |||
| IOSP / Innospec Inc. | 0,00 | −31,37 | 0,07 | −30,48 | 0,7324 | −0,2299 | |||
| SAM / The Boston Beer Company, Inc. | 0,00 | −1,61 | 0,07 | 24,56 | 0,7076 | 0,1851 | |||
| CYBR / CyberArk Software Ltd. | 0,00 | −1,60 | 0,07 | 2,94 | 0,6990 | 0,0768 | |||
| THC / Tenet Healthcare Corporation | 0,00 | −1,49 | 0,07 | −20,69 | 0,6933 | −0,1043 | |||
| IWO / iShares Trust - iShares Russell 2000 Growth ETF | 0,00 | −65,29 | 0,07 | −68,20 | 0,6920 | −1,2883 | |||
| SUPN / Supernus Pharmaceuticals, Inc. | 0,00 | −1,52 | 0,07 | −9,46 | 0,6716 | −0,0107 | |||
| BE / Bloom Energy Corporation | 0,01 | −1,50 | 0,07 | −20,48 | 0,6638 | −0,0987 | |||
| SLP / Simulations Plus, Inc. | 0,00 | −1,50 | 0,07 | −5,80 | 0,6544 | 0,0210 | |||
| RHP / Ryman Hospitality Properties, Inc. | 0,00 | 91,22 | 0,07 | 71,05 | 0,6481 | 0,3011 | |||
| ITCI / Intra-Cellular Therapies, Inc. | 0,00 | 19,22 | 0,07 | −1,52 | 0,6479 | 0,0417 | |||
| SAH / Sonic Automotive, Inc. | 0,00 | −19,28 | 0,07 | −18,75 | 0,6452 | −0,0868 | |||
| CNMD / CONMED Corporation | 0,00 | −12,19 | 0,06 | −35,35 | 0,6417 | −0,2618 | |||
| OEC / Orion S.A. | 0,00 | 21,60 | 0,06 | 23,08 | 0,6398 | 0,1584 | |||
| VRNS / Varonis Systems, Inc. | 0,00 | −1,50 | 0,06 | 14,29 | 0,6384 | 0,1195 | |||
| WK / Workiva Inc. | 0,00 | −1,56 | 0,06 | −3,08 | 0,6337 | 0,0411 | |||
| MRCY / Mercury Systems, Inc. | 0,00 | −1,50 | 0,06 | 5,00 | 0,6292 | 0,0826 | |||
| TENB / Tenable Holdings, Inc. | 0,00 | −1,54 | 0,06 | 1,61 | 0,6257 | 0,0589 | |||
| AEIS / Advanced Energy Industries, Inc. | 0,00 | 0,06 | 0,6234 | 0,6234 | |||||
| SKY / Champion Homes, Inc. | 0,00 | −1,52 | 0,06 | −4,69 | 0,6154 | 0,0265 | |||
| EXLS / ExlService Holdings, Inc. | 0,00 | 392,13 | 0,06 | −8,96 | 0,6095 | −0,0027 | |||
| CORT / Corcept Therapeutics Incorporated | 0,00 | −1,53 | 0,06 | 22,00 | 0,6093 | 0,1456 | |||
| AXSM / Axsome Therapeutics, Inc. | 0,00 | −1,46 | 0,06 | −3,17 | 0,6070 | 0,0258 | |||
| COKE / Coca-Cola Consolidated, Inc. | 0,00 | 0,06 | 0,6064 | 0,6064 | |||||
| HALO / Halozyme Therapeutics, Inc. | 0,00 | −1,48 | 0,06 | 3,45 | 0,6040 | 0,0728 | |||
| FIVE / Five Below, Inc. | 0,00 | −1,59 | 0,06 | −20,27 | 0,5941 | −0,0825 | |||
| COLL / Collegium Pharmaceutical, Inc. | 0,00 | −1,51 | 0,06 | 1,72 | 0,5926 | 0,0617 | |||
| VICR / Vicor Corporation | 0,00 | 7,84 | 0,06 | 18,00 | 0,5869 | 0,1290 | |||
| ALTR / Altair Engineering Inc. | 0,00 | −1,49 | 0,06 | −19,72 | 0,5750 | −0,0743 | |||
| PRFT / Perficient, Inc. | 0,00 | −25,64 | 0,06 | −48,65 | 0,5715 | −0,4440 | |||
| INSM / Insmed Incorporated | 0,00 | −1,51 | 0,06 | 18,75 | 0,5712 | 0,1265 | |||
| IDA / IDACORP, Inc. | 0,00 | −1,45 | 0,06 | −9,52 | 0,5671 | −0,0114 | |||
| VCEL / Vericel Corporation | 0,00 | −1,51 | 0,06 | −12,50 | 0,5640 | −0,0249 | |||
| MXL / MaxLinear, Inc. | 0,00 | −1,51 | 0,06 | −30,86 | 0,5634 | −0,1811 | |||
| MMS / Maximus, Inc. | 0,00 | −1,56 | 0,06 | −12,50 | 0,5604 | −0,0307 | |||
| SYNA / Synaptics Incorporated | 0,00 | −31,43 | 0,06 | −28,57 | 0,5558 | −0,1542 | |||
| NEOG / Neogen Corporation | 0,00 | −1,53 | 0,06 | −15,38 | 0,5464 | −0,0509 | |||
| IRTC / iRhythm Technologies, Inc. | 0,00 | −1,52 | 0,05 | −11,48 | 0,5445 | −0,0170 | |||
| KFY / Korn Ferry | 0,00 | −1,55 | 0,05 | −5,26 | 0,5373 | 0,0143 | |||
| KRYS / Krystal Biotech, Inc. | 0,00 | −1,48 | 0,05 | −3,64 | 0,5354 | 0,0307 | |||
| CALX / Calix, Inc. | 0,00 | 15,92 | 0,05 | 6,00 | 0,5301 | 0,0732 | |||
| TMHC / Taylor Morrison Home Corporation | 0,00 | −1,51 | 0,05 | −14,75 | 0,5228 | −0,0347 | |||
| AI / C3.ai, Inc. | 0,00 | 16,85 | 0,05 | −18,75 | 0,5201 | −0,0629 | |||
| HLIT / Harmonic Inc. | 0,01 | 0,05 | 0,5179 | 0,5179 | |||||
| EGP / EastGroup Properties, Inc. | 0,00 | −1,58 | 0,05 | −5,56 | 0,5141 | 0,0144 | |||
| INDI / indie Semiconductor, Inc. | 0,01 | 55,18 | 0,05 | 4,08 | 0,5137 | 0,0605 | |||
| CRDO / Credo Technology Group Holding Ltd | 0,00 | −1,51 | 0,05 | −13,79 | 0,5051 | −0,0299 | |||
| IMAX / IMAX Corporation | 0,00 | −1,52 | 0,05 | 13,64 | 0,4977 | 0,0899 | |||
| QLYS / Qualys, Inc. | 0,00 | −1,53 | 0,05 | 16,67 | 0,4876 | 0,1029 | |||
| FOLD / Amicus Therapeutics, Inc. | 0,00 | −1,50 | 0,05 | −4,00 | 0,4825 | 0,0182 | |||
| ACLS / Axcelis Technologies, Inc. | 0,00 | 0,05 | 0,4823 | 0,4823 | |||||
| SHOO / Steven Madden, Ltd. | 0,00 | −1,51 | 0,05 | −4,08 | 0,4724 | 0,0195 | |||
| LMAT / LeMaitre Vascular, Inc. | 0,00 | −1,50 | 0,05 | −20,69 | 0,4607 | −0,0693 | |||
| AVNT / Avient Corporation | 0,00 | −1,51 | 0,05 | −14,81 | 0,4568 | −0,0360 | |||
| MDGL / Madrigal Pharmaceuticals, Inc. | 0,00 | −1,60 | 0,04 | −38,89 | 0,4450 | −0,2114 | |||
| PECO / Phillips Edison & Company, Inc. | 0,00 | 106,81 | 0,04 | 100,00 | 0,4448 | 0,2443 | |||
| SLAB / Silicon Laboratories Inc. | 0,00 | −1,59 | 0,04 | −27,12 | 0,4279 | −0,1151 | |||
| GDYN / Grid Dynamics Holdings, Inc. | 0,00 | −1,51 | 0,04 | 27,27 | 0,4261 | 0,1246 | |||
| ALKS / Alkermes plc | 0,00 | −1,50 | 0,04 | −10,64 | 0,4196 | −0,0172 | |||
| DCO / Ducommun Incorporated | 0,00 | −59,79 | 0,04 | −60,19 | 0,4107 | −0,5278 | |||
| JBI / Janus International Group, Inc. | 0,00 | 0,04 | 0,4013 | 0,4013 | |||||
| MTRN / Materion Corporation | 0,00 | −1,55 | 0,04 | −13,64 | 0,3864 | −0,0171 | |||
| BL / BlackLine, Inc. | 0,00 | −1,56 | 0,04 | 2,70 | 0,3821 | 0,0365 | |||
| LKFN / Lakeland Financial Corporation | 0,00 | −1,47 | 0,04 | −2,56 | 0,3792 | 0,0182 | |||
| APLS / Apellis Pharmaceuticals, Inc. | 0,00 | −1,48 | 0,04 | −59,78 | 0,3768 | −0,4637 | |||
| QTWO / Q2 Holdings, Inc. | 0,00 | 3,43 | 0,04 | 5,71 | 0,3764 | 0,0567 | |||
| OMCL / Omnicell, Inc. | 0,00 | −10,24 | 0,04 | −45,59 | 0,3724 | −0,2503 | |||
| FLYW / Flywire Corporation | 0,00 | −21,73 | 0,04 | −20,00 | 0,3637 | −0,0513 | |||
| MODN / Model N, Inc. | 0,00 | −1,52 | 0,04 | −32,08 | 0,3610 | −0,1262 | |||
| LTHM / Livent Corporation | 0,00 | −1,50 | 0,04 | −33,96 | 0,3489 | −0,1353 | |||
| VAC / Marriott Vacations Worldwide Corporation | 0,00 | −47,38 | 0,03 | −56,96 | 0,3416 | −0,3849 | |||
| BASE / Couchbase, Inc. | 0,00 | −1,53 | 0,03 | 6,25 | 0,3403 | 0,0480 | |||
| BPMC / Blueprint Medicines Corporation | 0,00 | −1,45 | 0,03 | −20,93 | 0,3380 | −0,0580 | |||
| TCMD / Tactile Systems Technology, Inc. | 0,00 | −23,04 | 0,03 | −57,69 | 0,3368 | −0,3757 | |||
| ROIV / Roivant Sciences Ltd. | 0,00 | 0,00 | 0,03 | 13,79 | 0,3356 | 0,0699 | |||
| KIDS / OrthoPediatrics Corp. | 0,00 | −1,52 | 0,03 | −28,26 | 0,3288 | −0,0910 | |||
| KRTX / Karuna Therapeutics, Inc. | 0,00 | −50,93 | 0,03 | −61,73 | 0,3088 | −0,4318 | |||
| ASAN / Asana, Inc. | 0,00 | −1,49 | 0,03 | −18,92 | 0,3012 | −0,0365 | |||
| MUSA / Murphy USA Inc. | 0,00 | −51,91 | 0,03 | −46,43 | 0,2985 | −0,2200 | |||
| VSAT / Viasat, Inc. | 0,00 | 9,45 | 0,03 | −33,33 | 0,2844 | −0,1283 | |||
| SWAV / Shockwave Medical, Inc. | 0,00 | −52,23 | 0,03 | −67,47 | 0,2747 | −0,4817 | |||
| MEG / Montrose Environmental Group, Inc. | 0,00 | 146,32 | 0,03 | 68,75 | 0,2719 | 0,1261 | |||
| CXM / Sprinklr, Inc. | 0,00 | 0,03 | 0,2624 | 0,2624 | |||||
| ARWR / Arrowhead Pharmaceuticals, Inc. | 0,00 | −1,54 | 0,03 | −26,47 | 0,2563 | −0,0607 | |||
| SILK / Silk Road Medical, Inc | 0,00 | −1,54 | 0,02 | −55,56 | 0,2479 | −0,2528 | |||
| STAA / STAAR Surgical Company | 0,00 | −15,27 | 0,02 | −35,14 | 0,2413 | −0,1006 | |||
| XNCR / Xencor, Inc. | 0,00 | −1,53 | 0,02 | −23,08 | 0,2066 | −0,0320 | |||
| MODV / ModivCare Inc. | 0,00 | −1,50 | 0,02 | −33,33 | 0,2052 | −0,0691 | |||
| ZIP / ZipRecruiter, Inc. | 0,00 | 11,57 | 0,02 | −21,74 | 0,1790 | −0,0390 | |||
| INSP / Inspire Medical Systems, Inc. | 0,00 | −66,79 | 0,02 | −80,46 | 0,1753 | −0,6171 | |||
| RLI / RLI Corp. | 0,00 | −100,00 | 0,00 | −100,00 | −1,1187 |