Grundläggande statistik
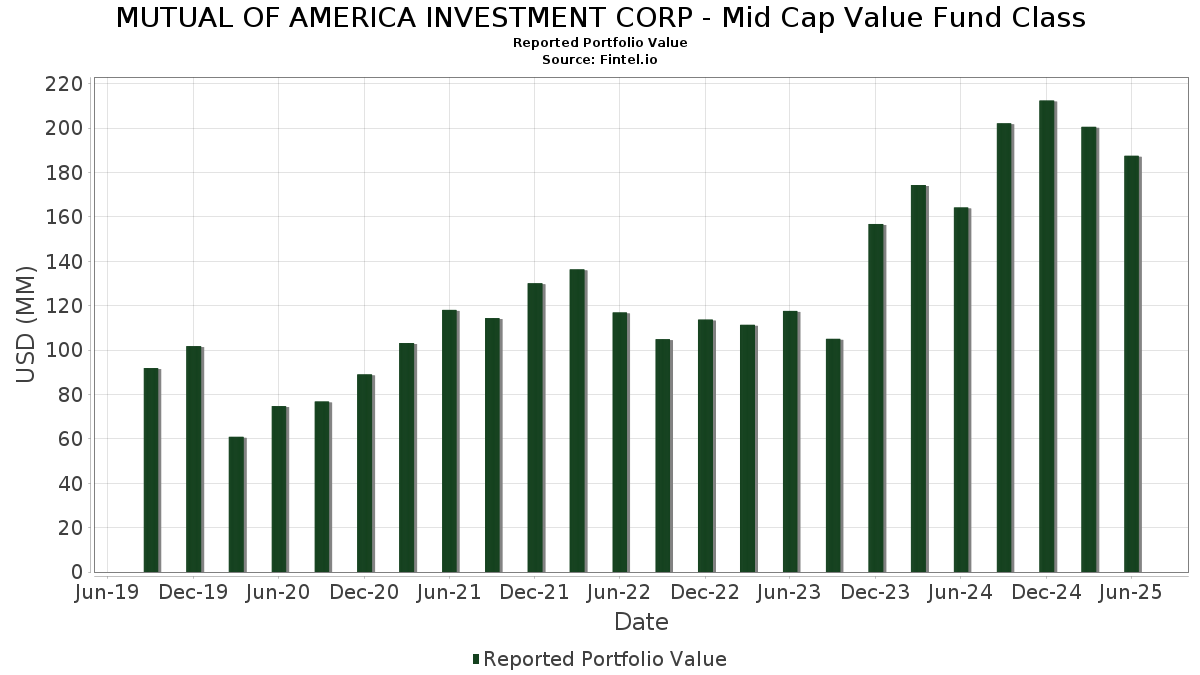
| Portföljvärde | $ 187 556 114 |
| Aktuella positioner | 69 |
Senaste innehav, resultat, förvaltat kapital (från 13F, 13D)
MUTUAL OF AMERICA INVESTMENT CORP - Mid Cap Value Fund Class har redovisat 69 totala innehav i sina senaste SEC-arkiveringar. Det senaste portföljvärdet beräknas vara $ 187 556 114 USD. Faktiskt förvaltade tillgångar (AUM) är detta värde plus likvida medel (som inte redovisas). MUTUAL OF AMERICA INVESTMENT CORP - Mid Cap Value Fund Classs största innehav är Crown Holdings, Inc. (US:CCK) , Ameriprise Financial, Inc. (US:AMP) , Crane Company (US:CR) , Evergy, Inc. (US:EVRG) , and The Williams Companies, Inc. (US:WMB) . MUTUAL OF AMERICA INVESTMENT CORP - Mid Cap Value Fund Classs nya positioner inkluderar NiSource Inc. (US:NI) , Expand Energy Corporation (US:EXE) , Brixmor Property Group Inc. (US:BRX) , STERIS plc (US:STE) , and The Cooper Companies, Inc. (US:COO) .
Största ökningarna detta kvartal
Vi använder förändringen i portföljallokeringen eftersom det är det mest meningsfulla måttet. Förändringar kan bero på transaktioner eller förändringar i aktiekurser.
| Värdepapper | Aktier (MM) |
Värde (MM$) |
Portfölj % av | ΔPortfölj % av |
|---|---|---|---|---|
| 3,90 | 2,0782 | 2,0782 | ||
| 0,08 | 3,21 | 1,7086 | 1,7086 | |
| 0,02 | 1,95 | 1,0377 | 1,0377 | |
| 0,07 | 1,89 | 1,0093 | 1,0093 | |
| 0,01 | 1,60 | 0,8501 | 0,8501 | |
| 0,02 | 3,26 | 1,7395 | 0,7050 | |
| 0,03 | 3,06 | 1,6281 | 0,5463 | |
| 0,01 | 0,93 | 0,4972 | 0,4972 | |
| 0,02 | 4,69 | 2,4991 | 0,4823 | |
| 0,01 | 2,42 | 1,2894 | 0,4326 |
Största minskningarna detta kvartal
Vi använder förändringen i portföljallokeringen eftersom det är det mest meningsfulla måttet. Förändringar kan bero på transaktioner eller förändringar i aktiepriser.
| Värdepapper | Aktier (MM) |
Värde (MM$) |
Portfölj % av | ΔPortfölj % av |
|---|---|---|---|---|
| 0,06 | 2,46 | 1,3090 | −0,7241 | |
| 0,03 | 3,95 | 2,1065 | −0,4865 | |
| 0,03 | 2,46 | 1,3136 | −0,4283 | |
| 0,03 | 1,82 | 0,9676 | −0,3646 | |
| 0,02 | 2,82 | 1,5042 | −0,3089 | |
| 0,09 | 2,91 | 1,5518 | −0,2734 | |
| 0,05 | 2,63 | 1,4038 | −0,2522 | |
| 0,05 | 1,42 | 0,7550 | −0,2219 | |
| 0,05 | 1,03 | 0,5497 | −0,2210 | |
| 0,04 | 1,47 | 0,7839 | −0,2080 |
13F- och fond arkiveringar
Denna blankett lämnades in den 2025-08-25 för rapporteringsperioden 2025-06-30. Klicka på länksymbolen för att se hela transaktionshistoriken.
Uppgradera för att låsa upp premiumdata och exportera till Excel![]() .
.
| Värdepapper | Typ | Genomsnittligt aktiepris | Aktier (MM) |
ΔAktier (%) |
ΔAktier (%) |
Värde ($MM) |
Portfölj (%) |
ΔPortfölj (%) |
|
|---|---|---|---|---|---|---|---|---|---|
| CCK / Crown Holdings, Inc. | 0,05 | −18,74 | 5,19 | −6,24 | 2,7636 | 0,0087 | |||
| AMP / Ameriprise Financial, Inc. | 0,01 | −6,59 | 4,99 | 2,99 | 2,6576 | 0,2460 | |||
| CR / Crane Company | 0,02 | −6,59 | 4,69 | 15,81 | 2,4991 | 0,4823 | |||
| EVRG / Evergy, Inc. | 0,06 | −6,58 | 4,29 | −6,60 | 2,2861 | −0,0016 | |||
| WMB / The Williams Companies, Inc. | 0,07 | −6,58 | 4,25 | −1,80 | 2,2649 | 0,1091 | |||
| TDY / Teledyne Technologies Incorporated | 0,01 | −6,58 | 4,05 | −3,84 | 2,1594 | 0,0608 | |||
| AFG / American Financial Group, Inc. | 0,03 | −20,99 | 3,95 | −24,07 | 2,1065 | −0,4865 | |||
| PFGC / Performance Food Group Company | 0,04 | −6,58 | 3,92 | 3,92 | 2,0891 | 0,2104 | |||
| EWBC / East West Bancorp, Inc. | 0,04 | −6,58 | 3,92 | 5,10 | 2,0884 | 0,2313 | |||
| ROP / Roper Technologies, Inc. | 0,01 | 15,18 | 3,91 | 10,76 | 2,0854 | 0,3255 | |||
| AUTOMATIC DATA PROCESSI 0.0 01JUL25 / DBT (000000000) | 3,90 | 2,0782 | 2,0782 | ||||||
| TTWO / Take-Two Interactive Software, Inc. | 0,02 | −6,58 | 3,83 | 9,47 | 2,0400 | 0,2983 | |||
| ETR / Entergy Corporation | 0,05 | −6,58 | 3,80 | −9,16 | 2,0240 | −0,0586 | |||
| AME / AMETEK, Inc. | 0,02 | 2,57 | 3,70 | 7,81 | 1,9716 | 0,2628 | |||
| MTN / Vail Resorts, Inc. | 0,02 | −6,59 | 3,60 | −8,27 | 1,9204 | −0,0362 | |||
| LW / Lamb Weston Holdings, Inc. | 0,07 | −6,58 | 3,40 | −9,12 | 1,8113 | −0,0514 | |||
| NRG / NRG Energy, Inc. | 0,02 | −6,59 | 3,26 | 57,15 | 1,7395 | 0,7050 | |||
| RGA / Reinsurance Group of America, Incorporated | 0,02 | −6,58 | 3,23 | −5,88 | 1,7224 | 0,0120 | |||
| CSL / Carlisle Companies Incorporated | 0,01 | −24,01 | 3,21 | −16,68 | 1,7094 | −0,2076 | |||
| NI / NiSource Inc. | 0,08 | 3,21 | 1,7086 | 1,7086 | |||||
| CLH / Clean Harbors, Inc. | 0,01 | −6,58 | 3,19 | 9,59 | 1,6997 | 0,2500 | |||
| FA / First Advantage Corporation | 0,19 | −11,77 | 3,17 | 4,01 | 1,6876 | 0,1713 | |||
| CPT / Camden Property Trust | 0,03 | 36,26 | 3,15 | 25,54 | 1,6794 | 0,4293 | |||
| ACGL / Arch Capital Group Ltd. | 0,03 | −6,58 | 3,14 | −11,59 | 1,6753 | −0,0951 | |||
| WH / Wyndham Hotels & Resorts, Inc. | 0,04 | −6,58 | 3,08 | −16,18 | 1,6402 | −0,1886 | |||
| APH / Amphenol Corporation | 0,03 | −6,58 | 3,06 | 40,65 | 1,6281 | 0,5463 | |||
| HIG / The Hartford Insurance Group, Inc. | 0,02 | −13,28 | 3,05 | −11,07 | 1,6266 | −0,0830 | |||
| GLPI / Gaming and Leisure Properties, Inc. | 0,06 | −6,58 | 3,01 | −14,33 | 1,6023 | −0,1456 | |||
| AIT / Applied Industrial Technologies, Inc. | 0,01 | −6,59 | 2,94 | −3,63 | 1,5687 | 0,0473 | |||
| DVN / Devon Energy Corporation | 0,09 | −6,58 | 2,91 | −20,55 | 1,5518 | −0,2734 | |||
| TMHC / Taylor Morrison Home Corporation | 0,05 | −18,60 | 2,90 | −16,76 | 1,5438 | −0,1889 | |||
| JHG / Janus Henderson Group plc | 0,07 | −6,58 | 2,85 | 0,39 | 1,5182 | 0,1046 | |||
| BLDR / Builders FirstSource, Inc. | 0,02 | −6,58 | 2,83 | −12,76 | 1,5085 | −0,1073 | |||
| MTB / M&T Bank Corporation | 0,01 | −6,58 | 2,83 | 1,36 | 1,5080 | 0,1179 | |||
| DOV / Dover Corporation | 0,02 | −25,66 | 2,82 | −22,47 | 1,5042 | −0,3089 | |||
| ATO / Atmos Energy Corporation | 0,02 | −6,58 | 2,79 | −6,89 | 1,4845 | −0,0051 | |||
| FOUR / Shift4 Payments, Inc. | 0,03 | 10,57 | 2,64 | 34,09 | 1,4088 | 0,4271 | |||
| ASH / Ashland Inc. | 0,05 | −6,58 | 2,63 | −20,78 | 1,4038 | −0,2522 | |||
| MUSA / Murphy USA Inc. | 0,01 | 9,88 | 2,58 | −4,86 | 1,3765 | 0,0244 | |||
| MLI / Mueller Industries, Inc. | 0,03 | −32,48 | 2,46 | −29,51 | 1,3136 | −0,4283 | |||
| BKR / Baker Hughes Company | 0,06 | −31,03 | 2,46 | −39,83 | 1,3090 | −0,7241 | |||
| ALNY / Alnylam Pharmaceuticals, Inc. | 0,01 | 16,47 | 2,42 | 40,64 | 1,2894 | 0,4326 | |||
| IDXX / IDEXX Laboratories, Inc. | 0,00 | 9,65 | 2,41 | 40,02 | 1,2830 | 0,4268 | |||
| VNT / Vontier Corporation | 0,07 | −6,58 | 2,40 | 4,94 | 1,2786 | 0,1399 | |||
| DOC / Healthpeak Properties, Inc. | 0,14 | −6,58 | 2,39 | −19,10 | 1,2732 | −0,1977 | |||
| WY / Weyerhaeuser Company | 0,09 | −6,58 | 2,33 | −18,05 | 1,2442 | −0,1745 | |||
| FITB / Fifth Third Bancorp | 0,06 | −6,58 | 2,29 | −1,97 | 1,2198 | 0,0567 | |||
| VLTO / Veralto Corporation | 0,02 | −6,58 | 2,28 | −3,23 | 1,2144 | 0,0416 | |||
| MPLX / MPLX LP - Limited Partnership | 0,04 | −6,58 | 2,26 | −10,08 | 1,2034 | −0,0475 | |||
| LKQ / LKQ Corporation | 0,06 | 14,83 | 2,06 | −0,10 | 1,0989 | 0,0710 | |||
| HUM / Humana Inc. | 0,01 | 26,46 | 2,05 | 16,87 | 1,0933 | 0,2189 | |||
| MIDD / The Middleby Corporation | 0,01 | 7,39 | 1,96 | 1,76 | 1,0467 | 0,0854 | |||
| EXE / Expand Energy Corporation | 0,02 | 1,95 | 1,0377 | 1,0377 | |||||
| BRX / Brixmor Property Group Inc. | 0,07 | 1,89 | 1,0093 | 1,0093 | |||||
| TFX / Teleflex Incorporated | 0,02 | −6,59 | 1,87 | −20,01 | 0,9975 | −0,1676 | |||
| TSCO / Tractor Supply Company | 0,03 | −6,58 | 1,83 | −10,56 | 0,9751 | −0,0435 | |||
| VTR / Ventas, Inc. | 0,03 | −26,09 | 1,82 | −32,15 | 0,9676 | −0,3646 | |||
| TECH / Bio-Techne Corporation | 0,03 | −6,58 | 1,62 | −18,02 | 0,8633 | −0,1209 | |||
| MKSI / MKS Inc. | 0,02 | −6,58 | 1,60 | 15,81 | 0,8512 | 0,1643 | |||
| STE / STERIS plc | 0,01 | 1,60 | 0,8501 | 0,8501 | |||||
| IQV / IQVIA Holdings Inc. | 0,01 | −6,58 | 1,59 | −16,47 | 0,8489 | −0,1011 | |||
| FMC / FMC Corporation | 0,04 | −25,36 | 1,47 | −26,12 | 0,7839 | −0,2080 | |||
| AXTA / Axalta Coating Systems Ltd. | 0,05 | −19,31 | 1,42 | −27,79 | 0,7550 | −0,2219 | |||
| TRNO / Terreno Realty Corporation | 0,02 | −6,58 | 1,30 | −17,19 | 0,6911 | −0,0884 | |||
| ON / ON Semiconductor Corporation | 0,02 | −6,58 | 1,18 | 20,37 | 0,6270 | 0,1400 | |||
| KVUE / Kenvue Inc. | 0,05 | −23,64 | 1,03 | −33,35 | 0,5497 | −0,2210 | |||
| COO / The Cooper Companies, Inc. | 0,01 | 0,93 | 0,4972 | 0,4972 | |||||
| A / Agilent Technologies, Inc. | 0,01 | −37,97 | 0,78 | −37,40 | 0,4130 | −0,2038 | |||
| DIRXX / Dreyfus Treasury Securities Cash Management - Dreyfus Treasury Securities Cash Management Institutional Shares | 0,04 | 0,04 | 0,0188 | 0,0188 |