Grundläggande statistik
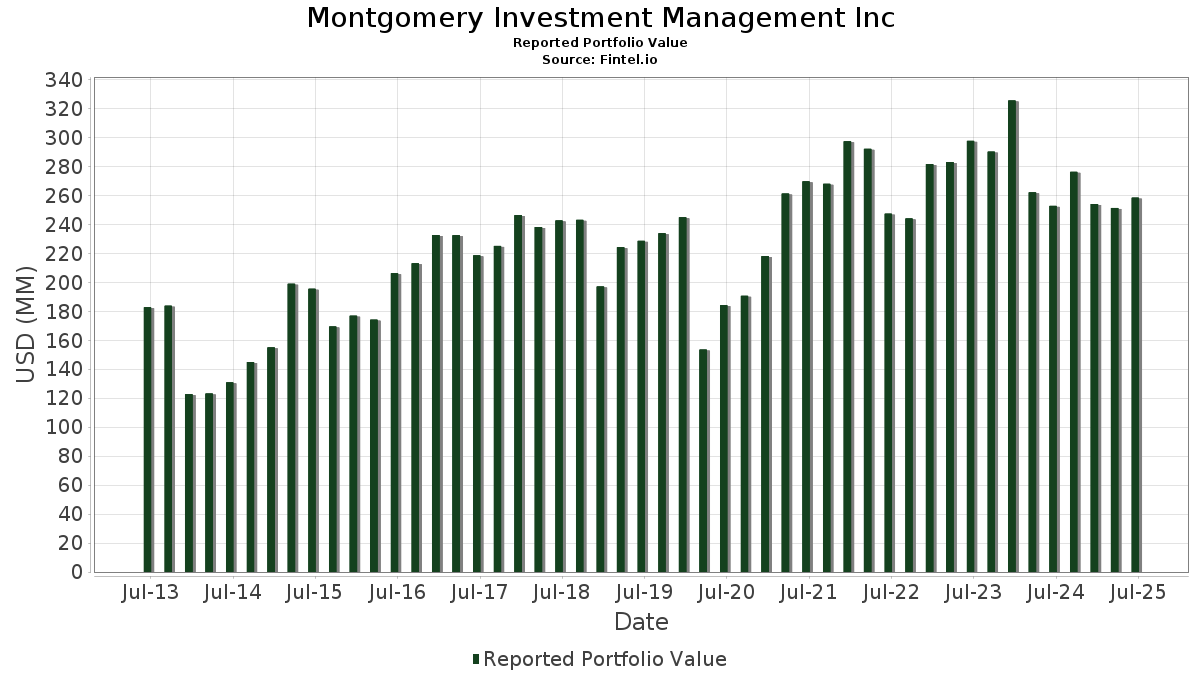
| Portföljvärde | $ 258 390 795 |
| Aktuella positioner | 95 |
Senaste innehav, resultat, förvaltat kapital (från 13F, 13D)
Montgomery Investment Management Inc har redovisat 95 totala innehav i sina senaste SEC-arkiveringar. Det senaste portföljvärdet beräknas vara $ 258 390 795 USD. Faktiskt förvaltade tillgångar (AUM) är detta värde plus likvida medel (som inte redovisas). Montgomery Investment Management Incs största innehav är United Rentals, Inc. (US:URI) , VSE Corporation (US:VSEC) , Truist Financial Corporation (US:TFC) , Deere & Company (US:DE) , and International Business Machines Corporation (US:IBM) . Montgomery Investment Management Incs nya positioner inkluderar PulteGroup, Inc. (US:PHM) , GE Vernova Inc. (US:GEV) , .
Största ökningarna detta kvartal
Vi använder förändringen i portföljallokeringen eftersom det är det mest meningsfulla måttet. Förändringar kan bero på transaktioner eller förändringar i aktiekurser.
| Värdepapper | Aktier (MM) |
Värde (MM$) |
Portfölj % av | ΔPortfölj % av |
|---|---|---|---|---|
| 0,09 | 8,81 | 3,4097 | 1,5662 | |
| 0,03 | 25,61 | 9,9112 | 1,1847 | |
| 0,04 | 11,05 | 4,2772 | 0,5279 | |
| 0,01 | 5,16 | 1,9977 | 0,3801 | |
| 0,15 | 19,42 | 7,5174 | 0,3474 | |
| 0,01 | 5,95 | 2,3014 | 0,3214 | |
| 0,01 | 5,58 | 2,1593 | 0,2732 | |
| 0,02 | 1,60 | 0,6184 | 0,2658 | |
| 0,01 | 0,63 | 0,2449 | 0,2449 | |
| 0,05 | 4,63 | 1,7924 | 0,2238 |
Största minskningarna detta kvartal
Vi använder förändringen i portföljallokeringen eftersom det är det mest meningsfulla måttet. Förändringar kan bero på transaktioner eller förändringar i aktiepriser.
| Värdepapper | Aktier (MM) |
Värde (MM$) |
Portfölj % av | ΔPortfölj % av |
|---|---|---|---|---|
| 0,09 | 8,38 | 3,2415 | −0,7424 | |
| 0,04 | 6,18 | 2,3932 | −0,6812 | |
| 0,05 | 10,25 | 3,9680 | −0,6228 | |
| 0,04 | 6,07 | 2,3500 | −0,6206 | |
| 0,03 | 1,76 | 0,6821 | −0,5230 | |
| 0,11 | 5,70 | 2,2065 | −0,4212 | |
| 0,06 | 6,01 | 2,3245 | −0,3519 | |
| 0,04 | 3,51 | 1,3579 | −0,2788 | |
| 0,00 | 10,78 | 4,1703 | −0,2662 | |
| 0,07 | 7,48 | 2,8943 | −0,2326 |
13F- och fond arkiveringar
Denna blankett lämnades in den 2025-07-18 för rapporteringsperioden 2025-06-30. Klicka på länksymbolen för att se hela transaktionshistoriken.
Uppgradera för att låsa upp premiumdata och exportera till Excel![]() .
.
| Värdepapper | Typ | Genomsnittligt aktiepris | Aktier (MM) |
ΔAktier (%) |
ΔAktier (%) |
Värde ($MM) |
Portfölj (%) |
ΔPortfölj (%) |
|
|---|---|---|---|---|---|---|---|---|---|
| URI / United Rentals, Inc. | 0,03 | −2,86 | 25,61 | 16,78 | 9,9112 | 1,1847 | |||
| VSEC / VSE Corporation | 0,15 | −1,24 | 19,42 | 7,80 | 7,5174 | 0,3474 | |||
| TFC / Truist Financial Corporation | 0,32 | −3,72 | 13,75 | 0,59 | 5,3197 | −0,1181 | |||
| DE / Deere & Company | 0,03 | −5,25 | 13,03 | 2,65 | 5,0438 | −0,0083 | |||
| IBM / International Business Machines Corporation | 0,04 | −1,06 | 11,05 | 17,29 | 4,2772 | 0,5279 | |||
| NVR / NVR, Inc. | 0,00 | −5,20 | 10,78 | −3,35 | 4,1703 | −0,2662 | |||
| AAPL / Apple Inc. | 0,05 | −3,78 | 10,25 | −11,13 | 3,9680 | −0,6228 | |||
| SGOV / iShares Trust - iShares 0-3 Month Treasury Bond ETF | 0,09 | 90,13 | 8,81 | 90,20 | 3,4097 | 1,5662 | |||
| COP / ConocoPhillips | 0,09 | −2,10 | 8,38 | −16,34 | 3,2415 | −0,7424 | |||
| LEN / Lennar Corporation | 0,07 | −1,24 | 7,48 | −4,84 | 2,8943 | −0,2326 | |||
| CVX / Chevron Corporation | 0,04 | −6,49 | 6,18 | −19,96 | 2,3932 | −0,6812 | |||
| FANG / Diamondback Energy, Inc. | 0,04 | −5,35 | 6,07 | −18,66 | 2,3500 | −0,6206 | |||
| LENB / Lennar Corp. - Class B | 0,06 | −7,46 | 6,01 | −10,70 | 2,3245 | −0,3519 | |||
| MSFT / Microsoft Corporation | 0,01 | −9,81 | 5,95 | 19,52 | 2,3014 | 0,3214 | |||
| BAC / Bank of America Corporation | 0,12 | −7,21 | 5,79 | 5,22 | 2,2392 | 0,0511 | |||
| GIS / General Mills, Inc. | 0,11 | −0,36 | 5,70 | −13,66 | 2,2065 | −0,4212 | |||
| CAT / Caterpillar Inc. | 0,01 | 0,00 | 5,58 | 17,70 | 2,1593 | 0,2732 | |||
| NOW / ServiceNow, Inc. | 0,01 | −1,66 | 5,16 | 26,96 | 1,9977 | 0,3801 | |||
| FCX / Freeport-McMoRan Inc. | 0,11 | −5,85 | 4,89 | 7,81 | 1,8913 | 0,0875 | |||
| PSX / Phillips 66 | 0,04 | −3,70 | 4,65 | −6,96 | 1,8005 | −0,1893 | |||
| CF / CF Industries Holdings, Inc. | 0,05 | −0,20 | 4,63 | 17,51 | 1,7924 | 0,2238 | |||
| VLO / Valero Energy Corporation | 0,03 | −1,00 | 3,98 | 0,76 | 1,5393 | −0,0315 | |||
| MRK / Merck & Co., Inc. | 0,04 | −3,27 | 3,51 | −14,71 | 1,3579 | −0,2788 | |||
| IVV / iShares Trust - iShares Core S&P 500 ETF | 0,01 | 11,08 | 3,18 | 22,73 | 1,2308 | 0,1997 | |||
| JNJ / Johnson & Johnson | 0,02 | −2,66 | 2,78 | −10,37 | 1,0777 | −0,1582 | |||
| PNC / The PNC Financial Services Group, Inc. | 0,01 | 0,00 | 2,68 | 6,10 | 1,0368 | 0,0317 | |||
| SNV / Synovus Financial Corp. | 0,05 | −9,62 | 2,43 | 0,04 | 0,9412 | −0,0258 | |||
| ABBV / AbbVie Inc. | 0,01 | 0,00 | 2,42 | −11,42 | 0,9371 | −0,1505 | |||
| BRK.A / Berkshire Hathaway Inc. | 0,00 | 0,00 | 2,19 | −8,73 | 0,8462 | −0,1070 | |||
| SU / Suncor Energy Inc. | 0,06 | −1,40 | 2,11 | −4,62 | 0,8160 | −0,0638 | |||
| ABT / Abbott Laboratories | 0,01 | −9,22 | 2,01 | −6,90 | 0,7777 | −0,0814 | |||
| NEE / NextEra Energy, Inc. | 0,03 | −5,74 | 1,82 | −7,70 | 0,7055 | −0,0804 | |||
| MCD / McDonald's Corporation | 0,01 | 0,00 | 1,80 | −6,45 | 0,6963 | −0,0691 | |||
| RTX / RTX Corporation | 0,01 | 0,00 | 1,80 | 10,25 | 0,6951 | 0,0468 | |||
| LGIH / LGI Homes, Inc. | 0,03 | −24,91 | 1,76 | −41,81 | 0,6821 | −0,5230 | |||
| CCJ / Cameco Corporation | 0,02 | 0,00 | 1,60 | 80,45 | 0,6184 | 0,2658 | |||
| HPQ / HP Inc. | 0,06 | 0,00 | 1,51 | −11,63 | 0,5852 | −0,0960 | |||
| MRP / Millrose Properties, Inc. | 0,05 | −20,22 | 1,35 | −14,20 | 0,5241 | −0,1040 | |||
| COST / Costco Wholesale Corporation | 0,00 | 0,00 | 1,28 | 4,67 | 0,4942 | 0,0087 | |||
| LH / Labcorp Holdings Inc. | 0,00 | −12,70 | 1,26 | −1,56 | 0,4887 | −0,0216 | |||
| WMT / Walmart Inc. | 0,01 | 0,00 | 1,12 | 11,39 | 0,4319 | 0,0332 | |||
| KNF / Knife River Corporation | 0,01 | −5,70 | 1,01 | −14,67 | 0,3919 | −0,0803 | |||
| LOW / Lowe's Companies, Inc. | 0,00 | 0,00 | 0,94 | −4,86 | 0,3641 | −0,0294 | |||
| NVDA / NVIDIA Corporation | 0,01 | 15,62 | 0,94 | 68,77 | 0,3620 | 0,1412 | |||
| BHP / BHP Group Limited - Depositary Receipt (Common Stock) | 0,02 | 0,00 | 0,86 | −0,92 | 0,3341 | −0,0126 | |||
| IWM / iShares Trust - iShares Russell 2000 ETF | 0,00 | 0,00 | 0,86 | 8,28 | 0,3341 | 0,0165 | |||
| ODFL / Old Dominion Freight Line, Inc. | 0,00 | 0,00 | 0,81 | −1,82 | 0,3128 | −0,0151 | |||
| CVE / Cenovus Energy Inc. | 0,06 | 0,00 | 0,77 | −2,29 | 0,2976 | −0,0154 | |||
| DGX / Quest Diagnostics Incorporated | 0,00 | 0,00 | 0,76 | 6,15 | 0,2941 | 0,0093 | |||
| GL / Globe Life Inc. | 0,01 | 0,00 | 0,75 | −5,65 | 0,2910 | −0,0261 | |||
| MDU / MDU Resources Group, Inc. | 0,04 | 0,00 | 0,73 | −1,36 | 0,2811 | −0,0121 | |||
| WY / Weyerhaeuser Company | 0,03 | −0,16 | 0,72 | −12,38 | 0,2769 | −0,0481 | |||
| DAL / Delta Air Lines, Inc. | 0,01 | −0,69 | 0,71 | 12,03 | 0,2744 | 0,0225 | |||
| EQT / EQT Corporation | 0,01 | 0,00 | 0,70 | 9,05 | 0,2708 | 0,0157 | |||
| HON / Honeywell International Inc. | 0,00 | 0,00 | 0,68 | 9,93 | 0,2614 | 0,0170 | |||
| ECG / Everus Construction Group, Inc. | 0,01 | 0,00 | 0,67 | 71,28 | 0,2586 | 0,1034 | |||
| DRI / Darden Restaurants, Inc. | 0,00 | 0,00 | 0,65 | 4,82 | 0,2531 | 0,0051 | |||
| PHM / PulteGroup, Inc. | 0,01 | 0,63 | 0,2449 | 0,2449 | |||||
| ANET / Arista Networks Inc | 0,01 | 0,00 | 0,57 | 32,10 | 0,2217 | 0,0491 | |||
| AMZN / Amazon.com, Inc. | 0,00 | 0,00 | 0,57 | 15,38 | 0,2208 | 0,0239 | |||
| GE / General Electric Company | 0,00 | 0,00 | 0,57 | 28,73 | 0,2203 | 0,0442 | |||
| BKR / Baker Hughes Company | 0,01 | 0,00 | 0,54 | −12,76 | 0,2092 | −0,0374 | |||
| MELI / MercadoLibre, Inc. | 0,00 | 0,00 | 0,52 | 33,85 | 0,2023 | 0,0470 | |||
| LLY / Eli Lilly and Company | 0,00 | 0,00 | 0,51 | −5,60 | 0,1961 | −0,0175 | |||
| HPE / Hewlett Packard Enterprise Company | 0,02 | 0,00 | 0,50 | 32,35 | 0,1919 | 0,0430 | |||
| A / Agilent Technologies, Inc. | 0,00 | 0,00 | 0,49 | 0,82 | 0,1895 | −0,0036 | |||
| SYY / Sysco Corporation | 0,01 | 0,00 | 0,47 | 0,85 | 0,1832 | −0,0034 | |||
| RYN / Rayonier Inc. | 0,02 | 0,08 | 0,46 | −20,45 | 0,1763 | −0,0514 | |||
| PFE / Pfizer Inc. | 0,02 | −4,32 | 0,43 | −8,33 | 0,1661 | −0,0205 | |||
| FDX / FedEx Corporation | 0,00 | 0,00 | 0,40 | −6,79 | 0,1544 | −0,0159 | |||
| ENB / Enbridge Inc. | 0,01 | 0,00 | 0,39 | 2,34 | 0,1527 | −0,0008 | |||
| WCC / WESCO International, Inc. | 0,00 | −4,53 | 0,39 | 14,04 | 0,1510 | 0,0146 | |||
| AVGO / Broadcom Inc. | 0,00 | 0,22 | 0,38 | 64,94 | 0,1475 | 0,0556 | |||
| AXP / American Express Company | 0,00 | 0,00 | 0,37 | 18,35 | 0,1451 | 0,0193 | |||
| PR / Permian Resources Corporation | 0,03 | 0,00 | 0,37 | −1,61 | 0,1423 | −0,0065 | |||
| CRWD / CrowdStrike Holdings, Inc. | 0,00 | −35,91 | 0,37 | −7,32 | 0,1421 | −0,0157 | |||
| SHOP / Shopify Inc. | 0,00 | 0,00 | 0,35 | 20,98 | 0,1339 | 0,0199 | |||
| SLB / Schlumberger Limited | 0,01 | 0,00 | 0,34 | −19,28 | 0,1300 | −0,0353 | |||
| EXE / Expand Energy Corporation | 0,00 | 0,00 | 0,32 | 4,92 | 0,1240 | 0,0026 | |||
| BRK.B / Berkshire Hathaway Inc. | 0,00 | 0,00 | 0,31 | −8,90 | 0,1192 | −0,0152 | |||
| VWO / Vanguard International Equity Index Funds - Vanguard FTSE Emerging Markets ETF | 0,01 | 0,00 | 0,31 | 9,29 | 0,1187 | 0,0070 | |||
| PM / Philip Morris International Inc. | 0,00 | 0,00 | 0,31 | 14,66 | 0,1184 | 0,0123 | |||
| KEYS / Keysight Technologies, Inc. | 0,00 | 0,00 | 0,30 | 9,39 | 0,1173 | 0,0071 | |||
| GEV / GE Vernova Inc. | 0,00 | 0,29 | 0,1124 | 0,1124 | |||||
| DELL / Dell Technologies Inc. | 0,00 | 0,00 | 0,29 | 34,88 | 0,1124 | 0,0265 | |||
| TTD / The Trade Desk, Inc. | 0,00 | 0,00 | 0,29 | 31,65 | 0,1114 | 0,0243 | |||
| OVV / Ovintiv Inc. | 0,01 | 0,00 | 0,27 | −10,93 | 0,1042 | −0,0163 | |||
| BTE / Baytex Energy Corp. | 0,15 | 0,00 | 0,27 | −19,82 | 0,1036 | −0,0291 | |||
| AR / Antero Resources Corporation | 0,01 | 0,00 | 0,24 | −0,42 | 0,0920 | −0,0030 | |||
| HAL / Halliburton Company | 0,01 | 0,00 | 0,23 | −19,72 | 0,0883 | −0,0247 | |||
| CRGY / Crescent Energy Company | 0,02 | 0,00 | 0,21 | −23,66 | 0,0827 | −0,0284 | |||
| GOOG / Alphabet Inc. | 0,00 | 0,21 | 0,0825 | 0,0825 | |||||
| CMCSA / Comcast Corporation | 0,01 | 0,00 | 0,21 | −3,23 | 0,0815 | −0,0051 | |||
| RF / Regions Financial Corporation | 0,01 | 0,21 | 0,0808 | 0,0808 | |||||
| UNP / Union Pacific Corporation | 0,00 | −35,71 | 0,21 | −37,27 | 0,0801 | −0,0515 | |||
| FRT / Federal Realty Investment Trust | 0,00 | −100,00 | 0,00 | 0,0000 | |||||
| MVF / BlackRock MuniVest Fund, Inc. | 0,00 | −100,00 | 0,00 | 0,0000 |