Grundläggande statistik
| Portföljvärde | $ 8 021 674 761 |
| Aktuella positioner | 105 |
Senaste innehav, resultat, förvaltat kapital (från 13F, 13D)
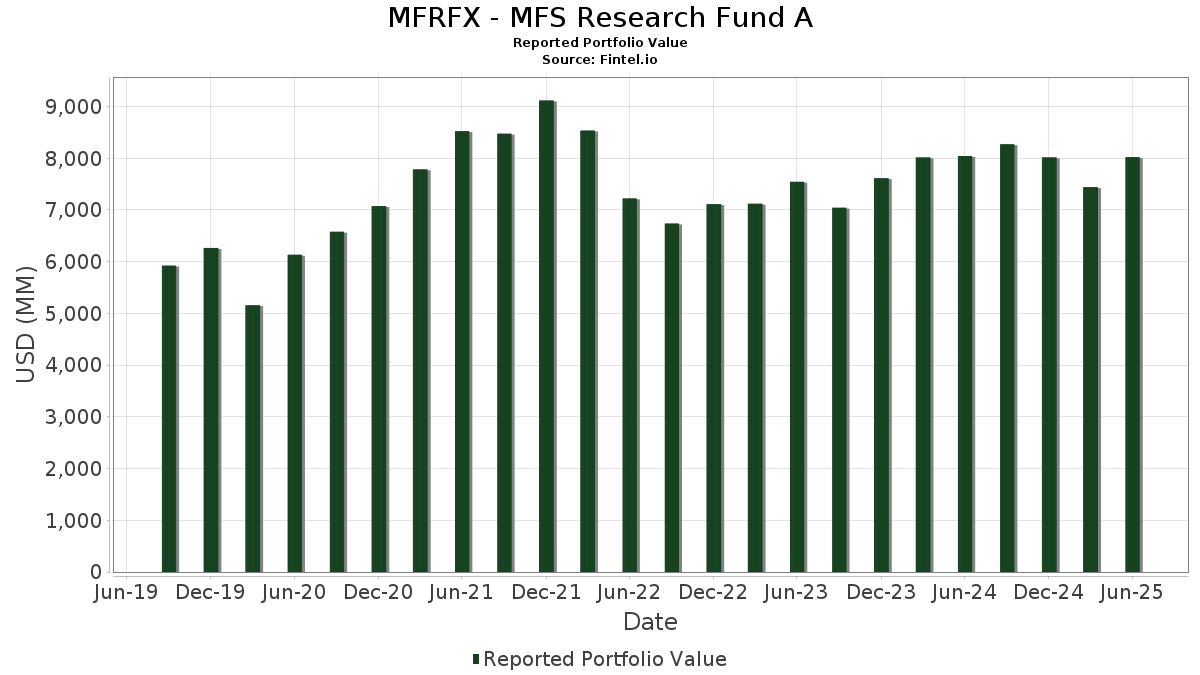
MFRFX - MFS Research Fund A har redovisat 105 totala innehav i sina senaste SEC-arkiveringar. Det senaste portföljvärdet beräknas vara $ 8 021 674 761 USD. Faktiskt förvaltade tillgångar (AUM) är detta värde plus likvida medel (som inte redovisas). MFRFX - MFS Research Fund As största innehav är Microsoft Corporation (US:MSFT) , NVIDIA Corporation (US:NVDA) , Amazon.com, Inc. (US:AMZN) , Meta Platforms, Inc. (US:META) , and Apple Inc. (US:AAPL) . MFRFX - MFS Research Fund As nya positioner inkluderar The TJX Companies, Inc. (US:TJX) , Union Pacific Corporation (US:UNP) , BJ's Wholesale Club Holdings, Inc. (US:BJ) , American International Group, Inc. (US:AIG) , and Vistra Corp. (US:VST) .
Största ökningarna detta kvartal
Vi använder förändringen i portföljallokeringen eftersom det är det mest meningsfulla måttet. Förändringar kan bero på transaktioner eller förändringar i aktiekurser.
| Värdepapper | Aktier (MM) |
Värde (MM$) |
Portfölj % av | ΔPortfölj % av |
|---|---|---|---|---|
| 0,43 | 238,83 | 2,9771 | 2,9771 | |
| 0,73 | 200,71 | 2,5019 | 2,0074 | |
| 0,72 | 105,56 | 1,3159 | 1,3159 | |
| 1,39 | 689,62 | 8,5964 | 1,1629 | |
| 0,36 | 80,24 | 1,0002 | 1,0002 | |
| 2,76 | 436,79 | 5,4448 | 0,9320 | |
| 0,40 | 48,80 | 0,6083 | 0,6083 | |
| 0,51 | 377,52 | 4,7059 | 0,5446 | |
| 73,02 | 73,02 | 0,9103 | 0,5284 | |
| 0,16 | 36,83 | 0,4592 | 0,4592 |
Största minskningarna detta kvartal
Vi använder förändringen i portföljallokeringen eftersom det är det mest meningsfulla måttet. Förändringar kan bero på transaktioner eller förändringar i aktiepriser.
| Värdepapper | Aktier (MM) |
Värde (MM$) |
Portfölj % av | ΔPortfölj % av |
|---|---|---|---|---|
| 0,10 | 24,05 | 0,2998 | −0,8578 | |
| 0,23 | 65,47 | 0,8161 | −0,6477 | |
| 0,18 | 24,81 | 0,3093 | −0,4777 | |
| 0,26 | 77,80 | 0,9698 | −0,3891 | |
| 0,03 | 10,21 | 0,1273 | −0,3397 | |
| 1,16 | 203,84 | 2,5409 | −0,3219 | |
| 0,49 | 91,70 | 1,1431 | −0,3180 | |
| 0,30 | 51,99 | 0,6481 | −0,2849 | |
| 0,64 | 98,20 | 1,2241 | −0,2809 | |
| 0,73 | 65,51 | 0,8167 | −0,2656 |
13F- och fond arkiveringar
Denna blankett lämnades in den 2025-08-26 för rapporteringsperioden 2025-06-30. Klicka på länksymbolen för att se hela transaktionshistoriken.
Uppgradera för att låsa upp premiumdata och exportera till Excel![]() .
.
| Värdepapper | Typ | Genomsnittligt aktiepris | Aktier (MM) |
ΔAktier (%) |
ΔAktier (%) |
Värde ($MM) |
Portfölj (%) |
ΔPortfölj (%) |
|
|---|---|---|---|---|---|---|---|---|---|
| MSFT / Microsoft Corporation | 1,39 | −5,93 | 689,62 | 24,65 | 8,5964 | 1,1629 | |||
| NVDA / NVIDIA Corporation | 2,76 | −10,79 | 436,79 | 30,04 | 5,4448 | 0,9320 | |||
| AMZN / Amazon.com, Inc. | 1,76 | −4,82 | 386,72 | 9,75 | 4,8206 | 0,0866 | |||
| META / Meta Platforms, Inc. | 0,51 | −4,82 | 377,52 | 21,89 | 4,7059 | 0,5446 | |||
| AAPL / Apple Inc. | 1,62 | 22,82 | 332,22 | 13,44 | 4,1413 | 0,2066 | |||
| MA / Mastercard Incorporated | 0,43 | 238,83 | 2,9771 | 2,9771 | |||||
| JPM / JPMorgan Chase & Co. | 0,71 | −4,82 | 206,52 | 12,49 | 2,5743 | 0,1077 | |||
| GOOGL / Alphabet Inc. | 1,16 | −16,05 | 203,84 | −4,33 | 2,5409 | −0,3219 | |||
| AVGO / Broadcom Inc. | 0,73 | 231,26 | 200,71 | 445,38 | 2,5019 | 2,0074 | |||
| CRM / Salesforce, Inc. | 0,40 | −4,82 | 110,25 | −3,28 | 1,3743 | −0,1572 | |||
| RTX / RTX Corporation | 0,72 | 105,56 | 1,3159 | 1,3159 | |||||
| JNJ / Johnson & Johnson | 0,64 | −4,82 | 98,20 | −12,33 | 1,2241 | −0,2809 | |||
| ABBV / AbbVie Inc. | 0,49 | −4,82 | 91,70 | −15,68 | 1,1431 | −0,3180 | |||
| HD / The Home Depot, Inc. | 0,24 | −4,82 | 87,36 | −4,78 | 1,0890 | −0,1437 | |||
| XOM / Exxon Mobil Corporation | 0,79 | 31,90 | 85,67 | 19,55 | 1,0679 | 0,1051 | |||
| SCHW / The Charles Schwab Corporation | 0,89 | −4,82 | 81,43 | 10,94 | 1,0150 | 0,0289 | |||
| ETN / Eaton Corporation plc | 0,23 | −4,82 | 81,20 | 25,00 | 1,0122 | 0,1394 | |||
| CME / CME Group Inc. | 0,29 | −4,82 | 80,67 | −1,11 | 1,0056 | −0,0905 | |||
| AMT / American Tower Corporation | 0,36 | 80,24 | 1,0002 | 1,0002 | |||||
| EMR / Emerson Electric Co. | 0,60 | 21,11 | 79,53 | 47,28 | 0,9914 | 0,2659 | |||
| PNC / The PNC Financial Services Group, Inc. | 0,42 | −4,82 | 78,79 | 0,95 | 0,9822 | −0,0665 | |||
| CI / The Cigna Group | 0,24 | −4,82 | 77,85 | −4,36 | 0,9704 | −0,1232 | |||
| ACN / Accenture plc | 0,26 | −19,69 | 77,80 | −23,08 | 0,9698 | −0,3891 | |||
| LRCX / Lam Research Corporation | 0,79 | −4,82 | 76,46 | 27,44 | 0,9532 | 0,1470 | |||
| MDT / Medtronic plc | 0,87 | −4,82 | 75,49 | −7,67 | 0,9410 | −0,1575 | |||
| HWM / Howmet Aerospace Inc. | 0,40 | −4,82 | 75,30 | 36,56 | 0,9387 | 0,1978 | |||
| CDNS / Cadence Design Systems, Inc. | 0,24 | −20,87 | 75,07 | −4,13 | 0,9357 | −0,1163 | |||
| US55291X1090 / MFS Institutional Money Market Portfolio | 73,02 | 156,94 | 73,02 | 156,94 | 0,9103 | 0,5284 | |||
| ARMK / Aramark | 1,68 | −4,82 | 70,25 | 15,45 | 0,8757 | 0,0581 | |||
| MS / Morgan Stanley | 0,50 | −4,82 | 70,16 | 14,92 | 0,8746 | 0,0543 | |||
| BSX / Boston Scientific Corporation | 0,65 | −4,82 | 69,45 | 1,34 | 0,8657 | −0,0550 | |||
| COP / ConocoPhillips | 0,73 | −4,82 | 65,51 | −18,67 | 0,8167 | −0,2656 | |||
| CB / Chubb Limited | 0,23 | −37,36 | 65,47 | −39,91 | 0,8161 | −0,6477 | |||
| AON / Aon plc | 0,18 | −4,82 | 64,04 | −14,91 | 0,7983 | −0,2130 | |||
| OMC / Omnicom Group Inc. | 0,88 | 12,80 | 63,38 | −2,13 | 0,7900 | −0,0800 | |||
| CNSWF / Constellation Software Inc. | 0,02 | −14,80 | 62,42 | −1,35 | 0,7781 | −0,0721 | |||
| PM / Philip Morris International Inc. | 0,33 | −4,82 | 60,32 | 9,21 | 0,7520 | 0,0098 | |||
| SPOT / Spotify Technology S.A. | 0,08 | 19,95 | 60,03 | 67,33 | 0,7483 | 0,2663 | |||
| USFD / US Foods Holding Corp. | 0,76 | 2,16 | 58,89 | 20,19 | 0,7341 | 0,0758 | |||
| TRU / TransUnion | 0,67 | −4,82 | 58,81 | 0,93 | 0,7331 | −0,0498 | |||
| CRH / CRH plc | 0,64 | 17,68 | 58,80 | 22,81 | 0,7329 | 0,0897 | |||
| PEP / PepsiCo, Inc. | 0,44 | −4,82 | 58,11 | −16,18 | 0,7244 | −0,2071 | |||
| HLT / Hilton Worldwide Holdings Inc. | 0,21 | 2,63 | 56,70 | 20,13 | 0,7067 | 0,0726 | |||
| TT / Trane Technologies plc | 0,13 | 41,15 | 55,61 | 83,25 | 0,6932 | 0,2855 | |||
| TEAM / Atlassian Corporation | 0,27 | 24,54 | 53,89 | 19,19 | 0,6717 | 0,0643 | |||
| MCK / McKesson Corporation | 0,07 | −16,50 | 53,24 | −9,09 | 0,6636 | −0,1231 | |||
| GD / General Dynamics Corporation | 0,18 | 3,01 | 52,11 | 10,22 | 0,6495 | 0,0143 | |||
| STE / STERIS plc | 0,22 | −4,82 | 52,04 | 0,88 | 0,6487 | −0,0444 | |||
| FI / Fiserv, Inc. | 0,30 | −4,10 | 51,99 | −25,13 | 0,6481 | −0,2849 | |||
| BDX / Becton, Dickinson and Company | 0,30 | 10,81 | 51,78 | −16,67 | 0,6454 | −0,1894 | |||
| OKTA / Okta, Inc. | 0,51 | −4,82 | 51,13 | −9,57 | 0,6374 | −0,1223 | |||
| NDSN / Nordson Corporation | 0,24 | 12,10 | 51,06 | 19,13 | 0,6365 | 0,0606 | |||
| MRVL / Marvell Technology, Inc. | 0,64 | −4,82 | 49,77 | 19,65 | 0,6204 | 0,0615 | |||
| APD / Air Products and Chemicals, Inc. | 0,17 | 2,38 | 48,99 | −2,08 | 0,6107 | −0,0616 | |||
| TJX / The TJX Companies, Inc. | 0,40 | 48,80 | 0,6083 | 0,6083 | |||||
| DUK / Duke Energy Corporation | 0,41 | −4,82 | 48,47 | −7,92 | 0,6043 | −0,1030 | |||
| VRTX / Vertex Pharmaceuticals Incorporated | 0,11 | −17,75 | 48,46 | −24,47 | 0,6041 | −0,2580 | |||
| CTVA / Corteva, Inc. | 0,64 | −4,82 | 48,04 | 12,73 | 0,5988 | 0,0263 | |||
| PFE / Pfizer Inc. | 1,97 | −4,82 | 47,85 | −8,95 | 0,5965 | −0,1096 | |||
| TYL / Tyler Technologies, Inc. | 0,08 | 14,57 | 47,84 | 16,82 | 0,5963 | 0,0461 | |||
| BKNG / Booking Holdings Inc. | 0,01 | −4,82 | 47,11 | 19,61 | 0,5873 | 0,0581 | |||
| WAB / Westinghouse Air Brake Technologies Corporation | 0,22 | −4,82 | 46,23 | 9,88 | 0,5763 | 0,0110 | |||
| WTW / Willis Towers Watson Public Limited Company | 0,15 | −4,82 | 45,65 | −13,68 | 0,5690 | −0,1415 | |||
| TE Connectivity plc / EC (IE000IVNQZ81) | 0,26 | −4,82 | 44,28 | 13,60 | 0,5520 | 0,0283 | |||
| MCO / Moody's Corporation | 0,09 | −4,82 | 44,06 | 2,52 | 0,5493 | −0,0282 | |||
| EPAM / EPAM Systems, Inc. | 0,25 | −4,82 | 43,89 | −0,32 | 0,5471 | −0,0445 | |||
| SHW / The Sherwin-Williams Company | 0,13 | 1,63 | 43,40 | −0,07 | 0,5410 | −0,0425 | |||
| NXPI / NXP Semiconductors N.V. | 0,20 | −4,82 | 43,09 | 9,42 | 0,5371 | 0,0080 | |||
| CL / Colgate-Palmolive Company | 0,47 | −4,82 | 42,95 | −7,66 | 0,5354 | −0,0896 | |||
| A / Agilent Technologies, Inc. | 0,36 | −4,82 | 42,72 | −3,98 | 0,5325 | −0,0652 | |||
| CTSH / Cognizant Technology Solutions Corporation | 0,55 | −9,37 | 42,67 | 23,12 | 0,5319 | 0,0215 | |||
| WAT / Waters Corporation | 0,12 | −4,82 | 42,58 | −9,86 | 0,5307 | −0,1039 | |||
| Aptiv plc / EC (JE00BTDN8H13) | 0,60 | 5,73 | 40,87 | 21,22 | 0,5095 | 0,0565 | |||
| RRX / Regal Rexnord Corporation | 0,28 | −4,82 | 40,27 | 21,19 | 0,5019 | 0,0555 | |||
| HUBS / HubSpot, Inc. | 0,07 | 15,13 | 39,62 | 12,18 | 0,4939 | 0,0193 | |||
| EXR / Extra Space Storage Inc. | 0,27 | −4,82 | 39,48 | −5,49 | 0,4921 | −0,0691 | |||
| NTRS / Northern Trust Corporation | 0,31 | −4,82 | 38,87 | 22,33 | 0,4845 | 0,0576 | |||
| MDLZ / Mondelez International, Inc. | 0,57 | −4,82 | 38,35 | −5,39 | 0,4780 | −0,0666 | |||
| FERG / Ferguson Enterprises Inc. | 0,18 | −4,82 | 38,17 | 29,35 | 0,4758 | 0,0793 | |||
| LNT / Alliant Energy Corporation | 0,63 | −4,82 | 37,84 | −10,56 | 0,4717 | −0,0967 | |||
| DG / Dollar General Corporation | 0,32 | 45,39 | 37,15 | 22,32 | 0,4631 | 0,0618 | |||
| UNP / Union Pacific Corporation | 0,16 | 36,83 | 0,4592 | 0,4592 | |||||
| EXPE / Expedia Group, Inc. | 0,22 | −4,82 | 36,63 | −4,49 | 0,4565 | −0,0587 | |||
| PCG / PG&E Corporation | 2,58 | −4,82 | 35,98 | −22,77 | 0,4485 | −0,1774 | |||
| BJ / BJ's Wholesale Club Holdings, Inc. | 0,33 | 35,85 | 0,4468 | 0,4468 | |||||
| AIG / American International Group, Inc. | 0,41 | 35,38 | 0,4410 | 0,4410 | |||||
| KKR / KKR & Co. Inc. | 0,26 | −4,82 | 35,24 | 9,52 | 0,4392 | 0,0070 | |||
| PPL / PPL Corporation | 1,04 | −4,82 | 35,12 | −10,67 | 0,4378 | −0,0904 | |||
| CDW / CDW Corporation | 0,19 | −4,82 | 34,43 | 6,07 | 0,4292 | −0,0069 | |||
| KVUE / Kenvue Inc. | 1,64 | −4,82 | 34,41 | −16,92 | 0,4289 | −0,1276 | |||
| SBUX / Starbucks Corporation | 0,37 | −35,08 | 34,31 | −23,58 | 0,4277 | −0,1340 | |||
| JBHT / J.B. Hunt Transport Services, Inc. | 0,22 | −4,82 | 31,79 | −7,62 | 0,3963 | −0,0661 | |||
| VST / Vistra Corp. | 0,16 | 31,00 | 0,3864 | 0,3864 | |||||
| HUM / Humana Inc. | 0,11 | −4,82 | 25,73 | −12,06 | 0,3208 | −0,0724 | |||
| VLO / Valero Energy Corporation | 0,19 | −4,82 | 25,12 | −3,12 | 0,3132 | −0,0353 | |||
| HES / Hess Corporation | 0,18 | −51,16 | 24,81 | −57,64 | 0,3093 | −0,4777 | |||
| GIS / General Mills, Inc. | 0,47 | −4,82 | 24,31 | −17,52 | 0,3030 | −0,0930 | |||
| SBAC / SBA Communications Corporation | 0,10 | −73,85 | 24,05 | −72,09 | 0,2998 | −0,8578 | |||
| LNG / Cheniere Energy, Inc. | 0,09 | −4,82 | 23,04 | 0,17 | 0,2873 | −0,0218 | |||
| ESTC / Elastic N.V. | 0,27 | −4,82 | 22,80 | −9,91 | 0,2843 | −0,0558 | |||
| EL / The Estée Lauder Companies Inc. | 0,27 | −4,82 | 21,50 | 16,53 | 0,2680 | 0,0201 | |||
| EVR / Evercore Inc. | 0,08 | 20,27 | 0,2527 | 0,2527 | |||||
| FTI / TechnipFMC plc | 0,54 | −4,82 | 18,59 | 3,44 | 0,2317 | −0,0097 | |||
| IJF / ICON Public Limited Company | 0,12 | −4,82 | 17,24 | −20,89 | 0,2149 | −0,0779 | |||
| IT / Gartner, Inc. | 0,03 | −69,49 | 10,21 | −70,62 | 0,1273 | −0,3397 | |||
| CA21037X1345 / CONSTELLATION SOFTWARE INC | 0,03 | 0,00 | 0,00 | 0,0000 | 0,0000 |