Grundläggande statistik
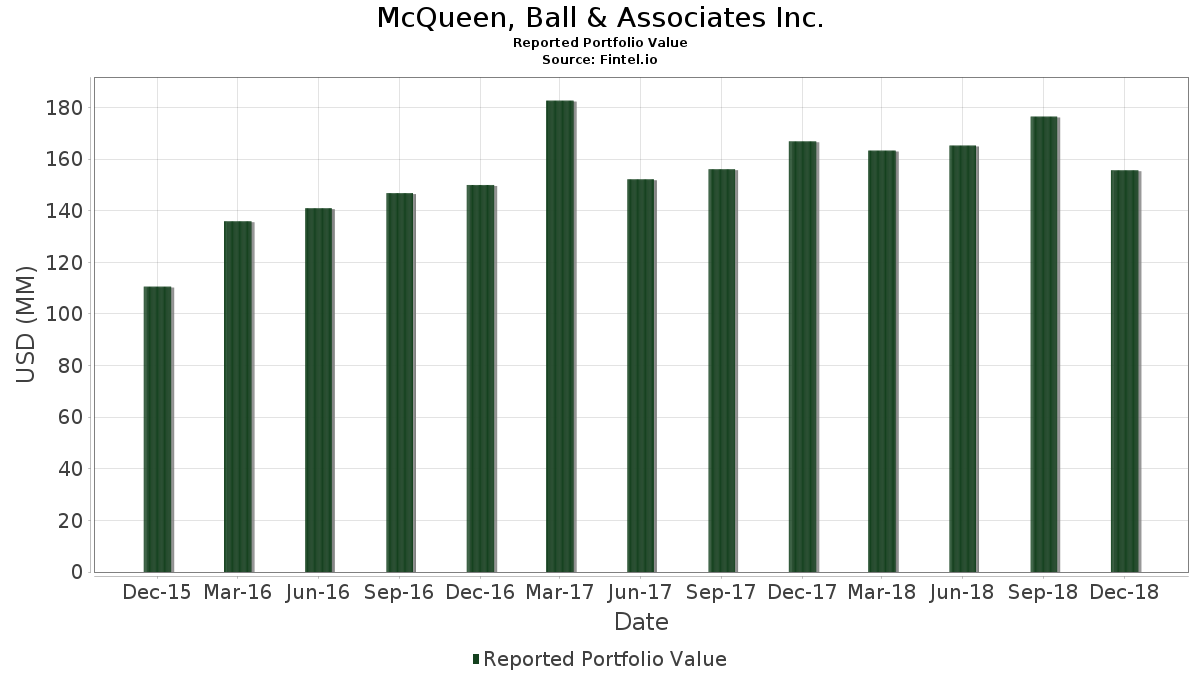
| Portföljvärde | $ 155 675 000 |
| Aktuella positioner | 113 |
Senaste innehav, resultat, förvaltat kapital (från 13F, 13D)
McQueen, Ball & Associates Inc. har redovisat 113 totala innehav i sina senaste SEC-arkiveringar. Det senaste portföljvärdet beräknas vara $ 155 675 000 USD. Faktiskt förvaltade tillgångar (AUM) är detta värde plus likvida medel (som inte redovisas). McQueen, Ball & Associates Inc.s största innehav är Vanguard Large-Cap Index Fund (US:VLCSX) , Targa Resources Corp. (US:TRGP) , Vanguard International Equity Index Funds - Vanguard FTSE All-World ex-US ETF (US:VEU) , Apple Inc. (US:AAPL) , and Vanguard Star Funds - Vanguard Total International Stock Index Fund Admiral (US:VTIAX) . McQueen, Ball & Associates Inc.s nya positioner inkluderar VANGUARD 500 INDEX FUND VANGUARD 500 INDEX ADM (US:US9229087104) , Baldwin & Lyons, Inc. (US:BWINA) , SolGold Plc (US:SLGGF) , Cannabis Science, Inc. (US:CBIS) , and Medical Marijuana, Inc. (US:MJNA) .
Största ökningarna detta kvartal
Vi använder förändringen i portföljallokeringen eftersom det är det mest meningsfulla måttet. Förändringar kan bero på transaktioner eller förändringar i aktiekurser.
| Värdepapper | Aktier (MM) |
Värde (MM$) |
Portfölj % av | ΔPortfölj % av |
|---|---|---|---|---|
| 0,09 | 10,03 | 6,4455 | 6,4455 | |
| 0,17 | 7,54 | 4,8402 | 4,8402 | |
| 0,10 | 4,60 | 2,9562 | 2,9562 | |
| 0,01 | 2,15 | 1,3824 | 1,3824 | |
| 0,01 | 2,07 | 1,3297 | 1,3297 | |
| 0,01 | 1,76 | 1,1331 | 1,1331 | |
| 0,05 | 1,64 | 1,0541 | 1,0541 | |
| 0,02 | 1,57 | 1,0079 | 1,0079 | |
| 0,02 | 1,46 | 0,9346 | 0,9346 | |
| 0,01 | 1,28 | 0,8248 | 0,8248 |
Största minskningarna detta kvartal
Vi använder förändringen i portföljallokeringen eftersom det är det mest meningsfulla måttet. Förändringar kan bero på transaktioner eller förändringar i aktiepriser.
| Värdepapper | Aktier (MM) |
Värde (MM$) |
Portfölj % av | ΔPortfölj % av |
|---|---|---|---|---|
| 0,24 | 8,76 | 5,6252 | −2,1321 | |
| 0,04 | 5,88 | 3,7739 | −0,9847 | |
| 0,20 | 2,03 | 1,3027 | −0,3547 | |
| 0,01 | 1,29 | 0,8286 | −0,2627 | |
| 0,02 | 0,69 | 0,4407 | −0,2353 | |
| 0,03 | 3,17 | 2,0344 | −0,2033 | |
| 0,00 | 0,00 | −0,1887 | ||
| 0,02 | 1,77 | 1,1357 | −0,1772 | |
| 0,01 | 1,79 | 1,1492 | −0,1342 | |
| 0,00 | 0,00 | −0,1286 |
13F- och fond arkiveringar
Denna blankett lämnades in den 2019-01-03 för rapporteringsperioden 2018-12-31. Klicka på länksymbolen för att se hela transaktionshistoriken.
Uppgradera för att låsa upp premiumdata och exportera till Excel![]() .
.
| Värdepapper | Typ | Genomsnittligt aktiepris | Aktier (MM) |
ΔAktier (%) |
ΔAktier (%) |
Värde ($MM) |
Portfölj (%) |
ΔPortfölj (%) |
|
|---|---|---|---|---|---|---|---|---|---|
| VLCSX / Vanguard Large-Cap Index Fund | 0,09 | 1,90 | 10,03 | −12,34 | 6,4455 | 6,4455 | |||
| TRGP / Targa Resources Corp. | 0,24 | 0,00 | 8,76 | −36,03 | 5,6252 | −2,1321 | |||
| VEU / Vanguard International Equity Index Funds - Vanguard FTSE All-World ex-US ETF | 0,17 | 0,08 | 7,54 | −12,35 | 4,8402 | 4,8402 | |||
| AAPL / Apple Inc. | 0,04 | 0,12 | 5,88 | −30,04 | 3,7739 | −0,9847 | |||
| VTIAX / Vanguard Star Funds - Vanguard Total International Stock Index Fund Admiral | 0,10 | 266,12 | 4,60 | 220,25 | 2,9562 | 2,9562 | |||
| JPM / JPMorgan Chase & Co. | 0,04 | 1,49 | 3,90 | −12,19 | 2,5071 | −0,0116 | |||
| INTC / Intel Corporation | 0,08 | 0,05 | 3,64 | −0,71 | 2,3363 | 0,2607 | |||
| JNJ / Johnson & Johnson | 0,03 | 0,01 | 3,55 | −6,58 | 2,2785 | 0,1269 | |||
| ABT / Abbott Laboratories | 0,05 | 0,00 | 3,38 | −1,40 | 2,1731 | 0,2290 | |||
| BDX / Becton, Dickinson and Company | 0,01 | 0,00 | 3,36 | −13,67 | 2,1583 | −0,0470 | |||
| LOW / Lowe's Companies, Inc. | 0,03 | −0,29 | 3,17 | −19,80 | 2,0344 | −0,2033 | |||
| ADP / Automatic Data Processing, Inc. | 0,02 | 0,00 | 3,07 | −12,96 | 1,9721 | −0,0265 | |||
| CSCO / Cisco Systems, Inc. | 0,07 | 0,00 | 3,03 | −10,94 | 1,9457 | 0,0186 | |||
| WTM / White Mountains Insurance Group, Ltd. | 0,00 | 0,00 | 2,88 | −8,33 | 1,8519 | 0,0699 | |||
| VTI / Vanguard Index Funds - Vanguard Total Stock Market ETF | 0,02 | 1,05 | 2,62 | −13,81 | 1,6843 | −0,0394 | |||
| MMM / 3M Company | 0,01 | 0,01 | 2,59 | −9,56 | 1,6650 | 0,0410 | |||
| PFE / Pfizer Inc. | 0,06 | 0,00 | 2,59 | −0,96 | 1,6612 | 0,1817 | |||
| NSC / Norfolk Southern Corporation | 0,02 | 0,00 | 2,55 | −17,14 | 1,6367 | −0,1057 | |||
| DIS / The Walt Disney Company | 0,02 | −1,30 | 2,49 | −7,46 | 1,6021 | 0,0750 | |||
| PG / The Procter & Gamble Company | 0,02 | −0,40 | 2,29 | 9,96 | 1,4678 | 0,2903 | |||
| ORLY / O'Reilly Automotive, Inc. | 0,01 | 0,00 | 2,27 | −0,83 | 1,4601 | 0,1614 | |||
| PEP / PepsiCo, Inc. | 0,02 | 0,00 | 2,25 | −1,18 | 1,4485 | 0,1555 | |||
| AXP / American Express Company | 0,02 | 0,00 | 2,16 | −10,51 | 1,3888 | 0,0198 | |||
| TRV / The Travelers Companies, Inc. | 0,02 | 0,00 | 2,16 | −7,70 | 1,3862 | 0,0614 | |||
| AMGN / Amgen Inc. | 0,01 | 0,01 | 2,15 | −6,11 | 1,3824 | 1,3824 | |||
| POOL / Pool Corporation | 0,01 | 0,28 | 2,15 | −10,69 | 1,3792 | 0,0170 | |||
| ILCG / iShares Trust - iShares Morningstar Growth ETF | 0,01 | 0,00 | 2,07 | −14,67 | 1,3297 | 1,3297 | |||
| FCX / Freeport-McMoRan Inc. | 0,20 | −6,40 | 2,03 | −30,67 | 1,3027 | −0,3547 | |||
| T / AT&T Inc. | 0,07 | −1,64 | 1,99 | −16,39 | 1,2809 | −0,0706 | |||
| VO / Vanguard Index Funds - Vanguard Mid-Cap ETF | 0,01 | 0,83 | 1,94 | −15,14 | 1,2455 | −0,0492 | |||
| KO / The Coca-Cola Company | 0,04 | 0,01 | 1,89 | 2,49 | 1,2141 | 0,1692 | |||
| VZ / Verizon Communications Inc. | 0,03 | 0,00 | 1,87 | 5,28 | 1,2038 | 0,1952 | |||
| GWW / W.W. Grainger, Inc. | 0,01 | 0,00 | 1,79 | −21,02 | 1,1492 | −0,1342 | |||
| RTX / RTX Corporation | 0,02 | 0,17 | 1,77 | −23,69 | 1,1357 | −0,1772 | |||
| US9229087104 / VANGUARD 500 INDEX FUND VANGUARD 500 INDEX ADM | 0,01 | 1,76 | 1,1331 | 1,1331 | |||||
| APD / Air Products and Chemicals, Inc. | 0,01 | 0,01 | 1,74 | −4,18 | 1,1184 | 0,0888 | |||
| WELL / Welltower Inc. | 0,02 | 0,00 | 1,66 | 7,96 | 1,0631 | 0,1945 | |||
| BIP / Brookfield Infrastructure Partners L.P. - Limited Partnership | 0,05 | 0,00 | 1,64 | −13,40 | 1,0541 | 1,0541 | |||
| VCSH / Vanguard Scottsdale Funds - Vanguard Short-Term Corporate Bond ETF | 0,02 | −3,89 | 1,57 | −4,15 | 1,0079 | 1,0079 | |||
| XOM / Exxon Mobil Corporation | 0,02 | −1,15 | 1,54 | −20,69 | 0,9873 | −0,1108 | |||
| ADI / Analog Devices, Inc. | 0,02 | −4,94 | 1,46 | −11,76 | 0,9346 | 0,9346 | |||
| BRK.B / Berkshire Hathaway Inc. | 0,01 | −2,14 | 1,40 | −6,65 | 0,9012 | 0,0496 | |||
| GM / General Motors Company | 0,04 | 0,00 | 1,40 | −0,64 | 0,8980 | 0,1008 | |||
| ENB / Enbridge Inc. | 0,04 | 0,00 | 1,37 | −3,74 | 0,8775 | 0,0734 | |||
| SCHW / The Charles Schwab Corporation | 0,03 | −2,78 | 1,31 | −17,81 | 0,8389 | −0,0615 | |||
| FDX / FedEx Corporation | 0,01 | 0,00 | 1,29 | −33,02 | 0,8286 | −0,2627 | |||
| MCK / McKesson Corporation | 0,01 | −4,57 | 1,28 | −20,54 | 0,8248 | 0,8248 | |||
| VUG / Vanguard Index Funds - Vanguard Growth ETF | 0,01 | −8,00 | 1,14 | −23,24 | 0,7297 | −0,1089 | |||
| GLD / SPDR Gold Trust | 0,01 | 0,00 | 1,04 | 7,58 | 0,6655 | 0,6655 | |||
| JKHY / Jack Henry & Associates, Inc. | 0,01 | 0,53 | 1,01 | −20,60 | 0,6488 | −0,0720 | |||
| MSFT / Microsoft Corporation | 0,01 | 3,47 | 1,00 | −8,09 | 0,6424 | 0,0259 | |||
| ALL / The Allstate Corporation | 0,01 | 111,48 | 0,96 | 76,94 | 0,6160 | 0,3089 | |||
| SPY / SPDR S&P 500 ETF | 0,00 | 1,27 | 0,84 | −12,95 | 0,5396 | −0,0072 | |||
| RE / Everest Re Group Ltd | 0,00 | 0,00 | 0,83 | −4,73 | 0,5306 | 0,0393 | |||
| VMGMX / Vanguard Index Funds - Vanguard Mid-Cap Growth Index Fund Admiral | 0,01 | 0,00 | 0,78 | −16,08 | 0,5030 | 0,5030 | |||
| AMZN / Amazon.com, Inc. | 0,00 | −1,47 | 0,71 | −26,07 | 0,4535 | −0,0876 | |||
| SLB / Schlumberger Limited | 0,02 | −2,87 | 0,69 | −42,50 | 0,4407 | −0,2353 | |||
| VSIIX / Vanguard Index Funds - Vanguard Small-Cap Value Index Fund Institutional | 0,01 | 0,90 | 0,68 | −17,35 | 0,4374 | 0,0000 | |||
| GOOGL / Alphabet Inc. | 0,00 | 0,00 | 0,63 | −13,44 | 0,4053 | −0,0077 | |||
| WRB / W. R. Berkley Corporation | 0,01 | 0,00 | 0,62 | −7,58 | 0,3996 | 0,3996 | |||
| ARGO / Argo Group International Holdings, Inc. | 0,01 | 0,00 | 0,61 | 6,59 | 0,3951 | 0,3951 | |||
| US55027E1029 / Luminex Corporation | 0,03 | 0,22 | 0,61 | −23,51 | 0,3951 | 0,3951 | |||
| CB / Chubb Limited | 0,00 | −1,56 | 0,60 | −4,72 | 0,3886 | 0,0288 | |||
| GOOG / Alphabet Inc. | 0,00 | 0,00 | 0,57 | −13,15 | 0,3649 | −0,0057 | |||
| KMPR / Kemper Corporation | 0,01 | 0,00 | 0,55 | −17,47 | 0,3520 | 0,3520 | |||
| KMI / Kinder Morgan, Inc. | 0,04 | −4,55 | 0,55 | −17,12 | 0,3514 | −0,0226 | |||
| SYBT / Stock Yards Bancorp, Inc. | 0,02 | 0,00 | 0,54 | −9,65 | 0,3488 | 0,0083 | |||
| IVV / iShares Trust - iShares Core S&P 500 ETF | 0,00 | 0,00 | 0,53 | −13,98 | 0,3398 | 0,3398 | |||
| BR / Broadridge Financial Solutions, Inc. | 0,01 | 0,00 | 0,52 | −27,13 | 0,3347 | −0,0705 | |||
| DOW / Dow Inc. | 0,01 | 0,00 | 0,48 | −16,90 | 0,3096 | −0,0190 | |||
| FXFLF / Fairfax Financial Holdings Limited - Preferred Stock | 0,00 | 0,00 | 0,46 | −19,01 | 0,2955 | −0,0264 | |||
| BAC / Bank of America Corporation | 0,02 | 5,83 | 0,45 | −11,49 | 0,2871 | 0,0010 | |||
| VWO / Vanguard International Equity Index Funds - Vanguard FTSE Emerging Markets ETF | 0,01 | 1,70 | 0,44 | −5,54 | 0,2846 | 0,0188 | |||
| CVX / Chevron Corporation | 0,00 | −0,22 | 0,43 | −11,22 | 0,2794 | 0,0018 | |||
| AHL / Aspen Insurance Holdings Limited | 0,01 | 0,00 | 0,41 | 0,49 | 0,2653 | 0,2653 | |||
| META / Meta Platforms, Inc. | 0,00 | 0,00 | 0,40 | −20,40 | 0,2582 | −0,0279 | |||
| BSV / Vanguard Bond Index Funds - Vanguard Short-Term Bond ETF | 0,01 | −7,34 | 0,40 | −6,59 | 0,2550 | 0,0142 | |||
| QQQ / Invesco QQQ Trust, Series 1 | 0,00 | 0,05 | 0,34 | −17,00 | 0,2165 | −0,0136 | |||
| GRA / W.R. Grace & Co. | 0,01 | 0,00 | 0,33 | −8,96 | 0,2088 | 0,2088 | |||
| AIG / American International Group, Inc. | 0,01 | 0,00 | 0,31 | −25,95 | 0,1998 | −0,0382 | |||
| UNH / UnitedHealth Group Incorporated | 0,00 | 0,00 | 0,29 | −6,45 | 0,1863 | 0,1863 | |||
| PFS / Provident Financial Services, Inc. | 0,01 | 0,00 | 0,28 | −1,75 | 0,1799 | 0,1799 | |||
| ZTS / Zoetis Inc. | 0,00 | 0,00 | 0,28 | −6,46 | 0,1767 | 0,1767 | |||
| HD / The Home Depot, Inc. | 0,00 | 0,06 | 0,27 | −17,02 | 0,1754 | −0,0111 | |||
| COST / Costco Wholesale Corporation | 0,00 | 0,00 | 0,27 | −13,23 | 0,1728 | −0,0029 | |||
| PPL / PPL Corporation | 0,01 | 27,93 | 0,27 | 24,19 | 0,1715 | 0,0497 | |||
| C / Citigroup Inc. - Corporate Bond/Note | 0,00 | 0,00 | 0,26 | −27,48 | 0,1644 | 0,1644 | |||
| LHX / L3Harris Technologies, Inc. | 0,00 | 0,49 | 0,25 | −20,00 | 0,1593 | −0,0164 | |||
| GCP / GCP Applied Technologies Inc | 0,01 | 0,00 | 0,25 | −7,52 | 0,1580 | 0,0073 | |||
| SKT / Tanger Inc. | 0,01 | 0,00 | 0,24 | −11,59 | 0,1567 | 0,1567 | |||
| NSRGY / Nestlé S.A. - Depositary Receipt (Common Stock) | 0,00 | 0,00 | 0,24 | −2,79 | 0,1567 | 0,1567 | |||
| NS / NuStar Energy L.P. - Limited Partnership | 0,01 | 2,50 | 0,24 | −22,76 | 0,1548 | 0,1548 | |||
| TRQ / Turquoise Hill Resources Ltd | 0,14 | 0,00 | 0,24 | −22,30 | 0,1522 | −0,0206 | |||
| NEM / Newmont Corporation | 0,01 | 0,23 | 0,1471 | 0,1471 | |||||
| WMT / Walmart Inc. | 0,00 | 0,00 | 0,22 | −0,45 | 0,1432 | 0,1432 | |||
| TEL / TE Connectivity plc | 0,00 | 0,00 | 0,21 | −14,06 | 0,1375 | −0,0036 | |||
| SIGI / Selective Insurance Group, Inc. | 0,00 | 0,00 | 0,21 | −4,11 | 0,1349 | 0,1349 | |||
| V / Visa Inc. | 0,00 | 6,81 | 0,21 | −6,28 | 0,1343 | 0,0079 | |||
| PM / Philip Morris International Inc. | 0,00 | 0,00 | 0,20 | −18,22 | 0,1298 | −0,0102 | |||
| SLV / iShares Silver Trust | 0,01 | 0,00 | 0,20 | 5,98 | 0,1253 | 0,1253 | |||
| BWINA / Baldwin & Lyons, Inc. | 0,01 | 0,17 | 0,1086 | 0,1086 | |||||
| DDD / 3D Systems Corporation | 0,01 | 0,00 | 0,11 | −46,31 | 0,0700 | 0,0700 | |||
| US43114K1088 / HighPoint Resources Corp | 0,03 | 0,00 | 0,07 | −48,97 | 0,0475 | 0,0475 | |||
| LAC / Lithium Americas Corp. | 0,02 | 0,00 | 0,06 | −34,37 | 0,0405 | −0,0139 | |||
| CPMMF / Western Exploration Inc | 0,45 | 0,00 | 0,05 | −44,09 | 0,0334 | 0,0334 | |||
| ATP / Atlantic Power Corp. | 0,02 | 0,00 | 0,03 | 0,00 | 0,0212 | 0,0025 | |||
| SLGGF / SolGold Plc | 0,04 | 0,02 | 0,0122 | 0,0122 | |||||
| ECAOF / Eco (Atlantic) Oil & Gas Ltd. | 0,03 | 0,00 | 0,02 | −20,00 | 0,0103 | −0,0011 | |||
| GMO / | 0,04 | −22,51 | 0,01 | −52,94 | 0,0051 | −0,0045 | |||
| HEMP / Hemp, Inc | 0,01 | 0,00 | 0,0006 | 0,0006 | |||||
| NUSMF / Nautilus Minerals Inc. | 0,02 | 0,00 | 0,00 | 0,00 | 0,0006 | 0,0006 | |||
| MJNA / Medical Marijuana, Inc. | 0,01 | 0,00 | 0,0006 | 0,0006 | |||||
| CBIS / Cannabis Science, Inc. | 0,02 | 0,00 | 0,0006 | 0,0006 | |||||
| STRS / Stratus Properties Inc. | 0,00 | −100,00 | 0,00 | −100,00 | 0,0000 | ||||
| AVNS / Avanos Medical, Inc. | 0,00 | −100,00 | 0,00 | −100,00 | 0,0000 | ||||
| AXON / Axon Enterprise, Inc. | 0,00 | −100,00 | 0,00 | −100,00 | 0,0000 | ||||
| VSM / Versum Materials, Inc. | 0,00 | −100,00 | 0,00 | −100,00 | 0,0000 | ||||
| / Weight Watchers International, Inc. | 0,00 | −100,00 | 0,00 | −100,00 | 0,0000 | ||||
| MDGL / Madrigal Pharmaceuticals, Inc. | 0,00 | −100,00 | 0,00 | −100,00 | −0,1887 | ||||
| MO / Altria Group, Inc. | 0,00 | −100,00 | 0,00 | −100,00 | −0,1286 |