Grundläggande statistik
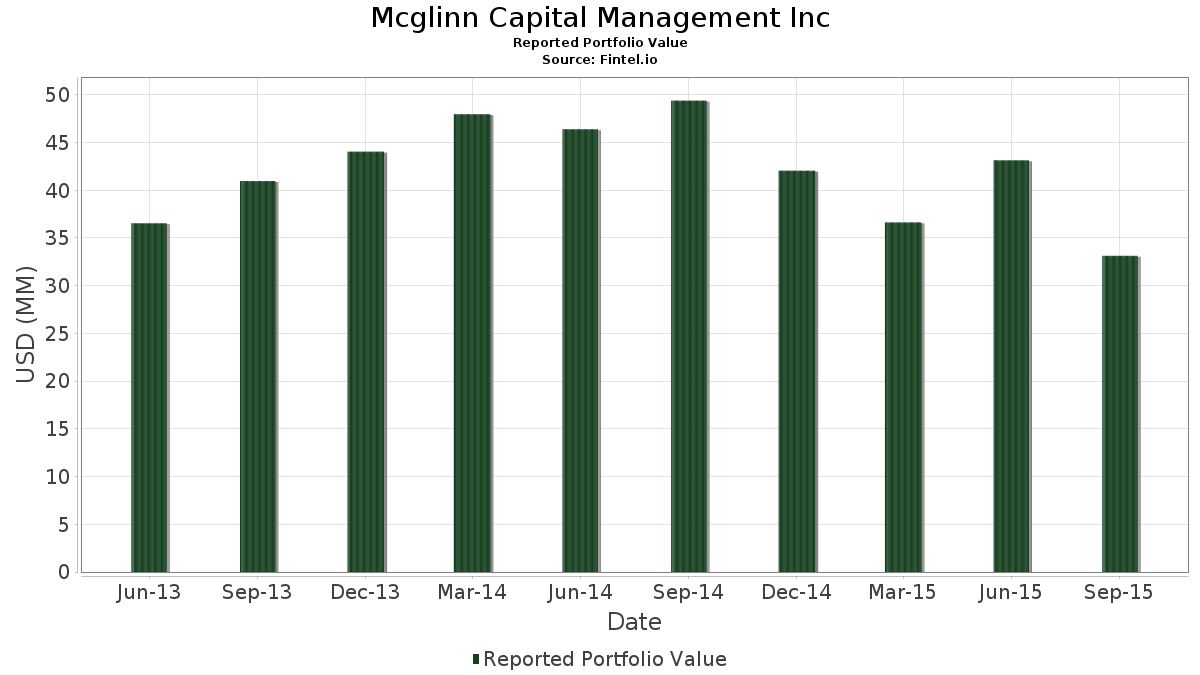
| Portföljvärde | $ 33 133 000 |
| Aktuella positioner | 53 |
Senaste innehav, resultat, förvaltat kapital (från 13F, 13D)
Mcglinn Capital Management Inc har redovisat 53 totala innehav i sina senaste SEC-arkiveringar. Det senaste portföljvärdet beräknas vara $ 33 133 000 USD. Faktiskt förvaltade tillgångar (AUM) är detta värde plus likvida medel (som inte redovisas). Mcglinn Capital Management Incs största innehav är Apple Inc. (US:AAPL) , General Electric Company (US:GE) , NRG Energy, Inc. (US:NRG) , Capitala Finance Corp. (US:US14054R1068) , and CIT Group Inc (US:CIT) . Mcglinn Capital Management Incs nya positioner inkluderar NRG Energy, Inc. (US:NRG) , Clearway Energy, Inc. (US:CWEN) , SUNation Energy Inc. (US:SUNE) , Ambarella, Inc. (US:AMBA) , and PayPal Holdings, Inc. (US:PYPL) .
Största ökningarna detta kvartal
Vi använder förändringen i portföljallokeringen eftersom det är det mest meningsfulla måttet. Förändringar kan bero på transaktioner eller förändringar i aktiekurser.
| Värdepapper | Aktier (MM) |
Värde (MM$) |
Portfölj % av | ΔPortfölj % av |
|---|---|---|---|---|
| 0,08 | 1,25 | 3,7636 | 3,7636 | |
| 0,08 | 0,98 | 2,9517 | 2,9517 | |
| 0,12 | 0,84 | 2,5443 | 2,5443 | |
| 0,01 | 0,78 | 2,3541 | 2,3541 | |
| 0,02 | 0,72 | 2,1731 | 2,1731 | |
| 0,08 | 0,54 | 1,6298 | 1,6298 | |
| 0,06 | 0,67 | 2,0131 | 0,9491 | |
| 0,01 | 0,30 | 0,9205 | 0,9205 | |
| 0,02 | 2,55 | 7,6902 | 0,6830 | |
| 0,05 | 1,37 | 4,1258 | 0,6280 |
Största minskningarna detta kvartal
Vi använder förändringen i portföljallokeringen eftersom det är det mest meningsfulla måttet. Förändringar kan bero på transaktioner eller förändringar i aktiepriser.
| Värdepapper | Aktier (MM) |
Värde (MM$) |
Portfölj % av | ΔPortfölj % av |
|---|---|---|---|---|
| 0,00 | 0,00 | −4,6591 | ||
| 0,00 | 0,00 | −1,3815 | ||
| 0,00 | 0,00 | −1,2471 | ||
| 0,01 | 0,40 | 1,1982 | −0,7999 | |
| 0,00 | 0,00 | −0,7232 | ||
| 0,13 | 0,42 | 1,2555 | −0,6174 | |
| 0,15 | 0,68 | 2,0493 | −0,5654 | |
| 0,19 | 0,33 | 1,0081 | −0,5311 | |
| 0,07 | 0,61 | 1,8441 | −0,4693 | |
| 0,06 | 0,23 | 0,6821 | −0,4630 |
13F- och fond arkiveringar
Denna blankett lämnades in den 2015-11-16 för rapporteringsperioden 2015-09-30. Klicka på länksymbolen för att se hela transaktionshistoriken.
Uppgradera för att låsa upp premiumdata och exportera till Excel![]() .
.
| Värdepapper | Typ | Genomsnittligt aktiepris | Aktier (MM) |
ΔAktier (%) |
ΔAktier (%) |
Värde ($MM) |
Portfölj (%) |
ΔPortfölj (%) |
|
|---|---|---|---|---|---|---|---|---|---|
| AAPL / Apple Inc. | 0,02 | −4,15 | 2,55 | −15,71 | 7,6902 | 0,6830 | |||
| GE / General Electric Company | 0,05 | −4,58 | 1,37 | −9,41 | 4,1258 | 0,6280 | |||
| NRG / NRG Energy, Inc. | 0,08 | 1,25 | 3,7636 | 3,7636 | |||||
| US14054R1068 / Capitala Finance Corp. | 0,10 | 1,06 | 1,24 | −15,98 | 3,7455 | 0,3219 | |||
| CIT / CIT Group Inc | 0,03 | −7,35 | 1,16 | −20,21 | 3,5041 | 0,1314 | |||
| AABA / Altaba Inc | 0,04 | −0,74 | 1,16 | −26,97 | 3,4980 | −0,1806 | |||
| ALLY / Ally Financial Inc. | 0,05 | −0,94 | 1,08 | −10,03 | 3,2475 | 0,4752 | |||
| NSM / Nationstar Mortgage Holdings Inc. | 0,08 | 0,91 | 1,07 | −16,71 | 3,2354 | 0,2522 | |||
| CWEN / Clearway Energy, Inc. | 0,08 | 0,98 | 2,9517 | 2,9517 | |||||
| NRF / NorthStar Realty Finance Corp. | 0,08 | 3,45 | 0,96 | −19,63 | 2,9034 | 0,1288 | |||
| JCP / J.C. Penney Co., Inc. | 0,10 | −31,82 | 0,92 | −25,16 | 2,7827 | −0,0730 | |||
| BAC / Bank of America Corporation | 0,06 | −4,20 | 0,89 | −12,34 | 2,6801 | 0,3320 | |||
| SUNE / SUNation Energy Inc. | 0,12 | 0,84 | 2,5443 | 2,5443 | |||||
| SAN / Banco Santander, S.A. - Depositary Receipt (Common Stock) | 0,16 | −0,63 | 0,84 | −25,18 | 2,5292 | −0,0669 | |||
| DOW / Dow Inc. | 0,02 | −0,59 | 0,81 | −25,07 | 2,4447 | −0,0610 | |||
| AMBA / Ambarella, Inc. | 0,01 | 0,78 | 2,3541 | 2,3541 | |||||
| EFC / Ellington Financial Inc. | 0,04 | 0,00 | 0,77 | −3,38 | 2,3270 | 0,4772 | |||
| TWTR / Twitter Inc | 0,03 | 9,41 | 0,75 | −18,61 | 2,2696 | 0,1278 | |||
| 19041P105 / CBS Corp. | 0,02 | 0,00 | 0,75 | −28,09 | 2,2636 | −0,1540 | |||
| PYPL / PayPal Holdings, Inc. | 0,02 | 0,72 | 2,1731 | 2,1731 | |||||
| TPH / Tri Pointe Homes, Inc. | 0,05 | −22,05 | 0,72 | −33,36 | 2,1640 | −0,3301 | |||
| WAC / Walter Investment Management Corp. | 0,04 | 14,91 | 0,69 | −18,36 | 2,0795 | 0,1231 | |||
| GNW / Genworth Financial, Inc. | 0,15 | −1,34 | 0,68 | −39,80 | 2,0493 | −0,5654 | |||
| MPW / Medical Properties Trust, Inc. | 0,06 | 72,29 | 0,67 | 45,32 | 2,0131 | 0,9491 | |||
| WMT / Walmart Inc. | 0,01 | −1,00 | 0,64 | −9,45 | 1,9376 | 0,2942 | |||
| OCN / Ocwen Financial Corporation | 0,09 | −6,05 | 0,62 | −38,18 | 1,8863 | −0,4571 | |||
| INVN / The Alger ETF Trust - Alger Russell Innovation ETF | 0,07 | −0,45 | 0,61 | −38,78 | 1,8441 | −0,4693 | |||
| ARNC / Arconic Corporation | 0,06 | −1,02 | 0,56 | −14,29 | 1,7022 | 0,1770 | |||
| CC / The Chemours Company | 0,08 | 0,54 | 1,6298 | 1,6298 | |||||
| F / Ford Motor Company | 0,04 | 0,00 | 0,52 | −9,47 | 1,5574 | 0,2361 | |||
| NOK / Nokia Oyj - Depositary Receipt (Common Stock) | 0,07 | −29,19 | 0,49 | −29,89 | 1,4940 | −0,1425 | |||
| FTR / Frontier Communications Corp. | 0,10 | −38,76 | 0,49 | −41,22 | 1,4849 | −0,4552 | |||
| AINV / Apollo Investment Corporation | 0,08 | 0,00 | 0,42 | −22,57 | 1,2737 | 0,0104 | |||
| AVP / Avon Products, Inc. | 0,13 | −0,77 | 0,42 | −48,51 | 1,2555 | −0,6174 | |||
| SSSS / SuRo Capital Corp. | 0,05 | 0,00 | 0,41 | −23,85 | 1,2525 | −0,0108 | |||
| C / Citigroup Inc. - Corporate Bond/Note | 0,01 | −48,72 | 0,40 | −53,94 | 1,1982 | −0,7999 | |||
| SCU / Sculptor Capital Management Inc - Class A | 0,04 | 0,00 | 0,38 | −28,54 | 1,1559 | −0,0865 | |||
| OCSL / Oaktree Specialty Lending Corporation | 0,06 | 0,00 | 0,36 | −5,70 | 1,0986 | 0,2039 | |||
| HOV / Hovnanian Enterprises, Inc. | 0,19 | −24,45 | 0,33 | −49,70 | 1,0081 | −0,5311 | |||
| BAC.WS.A / Bank of America Corp. A Warrants | 0,05 | −13,85 | 0,31 | −20,16 | 0,9326 | 0,0355 | |||
| JPM / JPMorgan Chase & Co. | 0,01 | 0,30 | 0,9205 | 0,9205 | |||||
| LL / LL Flooring Holdings, Inc. | 0,02 | −10,70 | 0,25 | −43,37 | 0,7606 | −0,2709 | |||
| ALU / Alcatel Lucent | 0,06 | −54,58 | 0,23 | −54,25 | 0,6821 | −0,4630 | |||
| FCX / Freeport-McMoRan Inc. | 0,02 | −0,90 | 0,21 | −48,54 | 0,6398 | −0,3152 | |||
| FUEL / Rocket Fuel Inc. | 0,04 | −2,73 | 0,20 | −44,60 | 0,6036 | −0,2332 | |||
| AMD / Advanced Micro Devices, Inc. | 0,09 | −1,08 | 0,16 | −28,83 | 0,4769 | −0,0377 | |||
| CHGG / Chegg, Inc. | 0,02 | −2,56 | 0,14 | −10,46 | 0,4135 | 0,0588 | |||
| RYAM / Rayonier Advanced Materials Inc. | 0,02 | 0,00 | 0,13 | −62,35 | 0,3863 | −0,4018 | |||
| BTU / Peabody Energy Corporation | 0,08 | −9,20 | 0,11 | −42,93 | 0,3290 | −0,1138 | |||
| ECA / EnCana Corp. | 0,01 | 0,09 | 0,2716 | 0,2716 | |||||
| BB / BlackBerry Limited | 0,01 | 0,00 | 0,06 | −25,61 | 0,1841 | −0,0060 | |||
| SGI / Somnigroup International Inc. | 0,01 | 0,00 | 0,05 | −39,08 | 0,1600 | 0,1600 | |||
| ROYTL / Pacific Coast Oil Trust | 0,02 | 0,00 | 0,04 | −48,72 | 0,1207 | −0,0601 | |||
| JAKK / JAKKS Pacific, Inc. | 0,00 | −100,00 | 0,00 | −100,00 | −0,7232 | ||||
| ARCH / Arch Resources, Inc. | 0,00 | −100,00 | 0,00 | −100,00 | −0,0371 | ||||
| SSYS / Stratasys Ltd. | 0,00 | −100,00 | 0,00 | −100,00 | −1,2471 | ||||
| VXX / iPath Series B S&P 500 VIX Short-Term Futures ETN | 0,00 | −100,00 | 0,00 | −100,00 | −4,6591 | ||||
| EBAY / eBay Inc. | 0,00 | −100,00 | 0,00 | −100,00 | −1,3815 | ||||
| DIREXION DAILY S&P500 BEAR 3X / ETF (25459Y371) | 0,00 | −100,00 | 0,00 | −100,00 | 0,0000 |