Grundläggande statistik
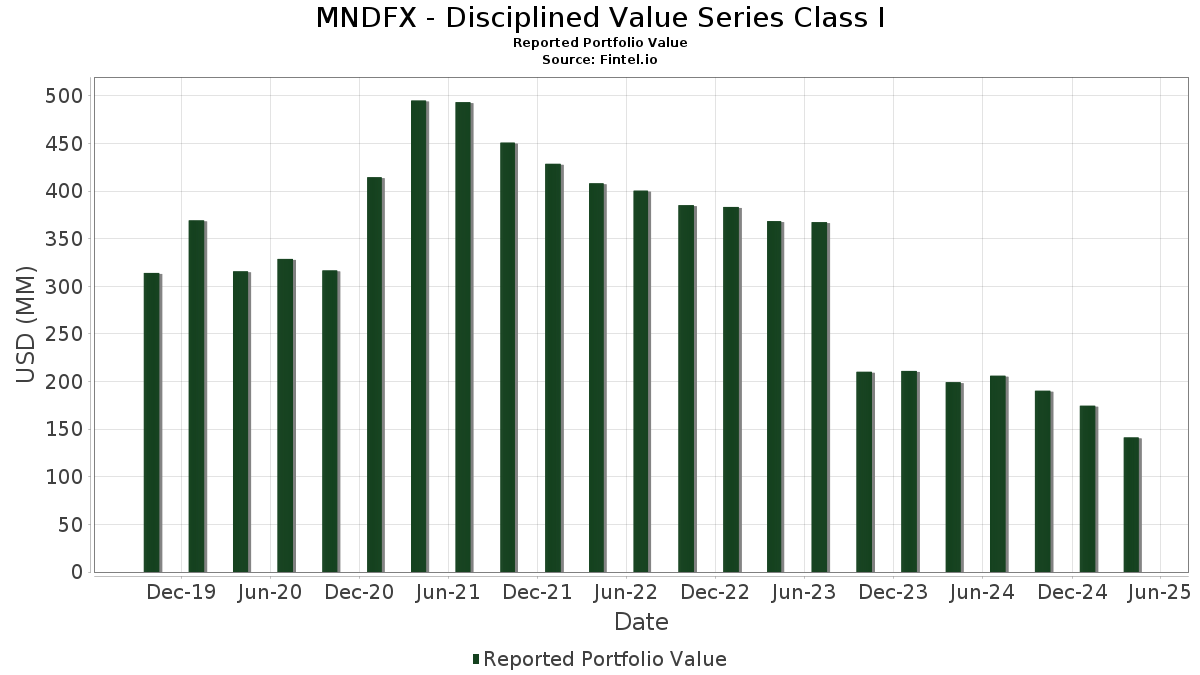
| Portföljvärde | $ 141 297 188 |
| Aktuella positioner | 111 |
Senaste innehav, resultat, förvaltat kapital (från 13F, 13D)
MNDFX - Disciplined Value Series Class I har redovisat 111 totala innehav i sina senaste SEC-arkiveringar. Det senaste portföljvärdet beräknas vara $ 141 297 188 USD. Faktiskt förvaltade tillgångar (AUM) är detta värde plus likvida medel (som inte redovisas). MNDFX - Disciplined Value Series Class Is största innehav är JPMorgan Chase & Co. (US:JPM) , Johnson & Johnson (US:JNJ) , Exxon Mobil Corporation (US:XOM) , Wells Fargo & Company (US:WFC) , and Gilead Sciences, Inc. (US:GILD) .
Största ökningarna detta kvartal
Vi använder förändringen i portföljallokeringen eftersom det är det mest meningsfulla måttet. Förändringar kan bero på transaktioner eller förändringar i aktiekurser.
| Värdepapper | Aktier (MM) |
Värde (MM$) |
Portfölj % av | ΔPortfölj % av |
|---|---|---|---|---|
| 0,01 | 2,05 | 1,4516 | 0,9013 | |
| 2,44 | 2,44 | 1,7311 | 0,8910 | |
| 0,03 | 2,24 | 1,5858 | 0,8243 | |
| 0,04 | 2,58 | 1,8276 | 0,7742 | |
| 0,00 | 2,01 | 1,4239 | 0,6528 | |
| 0,01 | 1,80 | 1,2801 | 0,4516 | |
| 0,02 | 1,01 | 0,7134 | 0,4319 | |
| 0,03 | 5,21 | 3,6983 | 0,4216 | |
| 0,03 | 3,43 | 2,4318 | 0,3604 | |
| 0,01 | 0,85 | 0,6007 | 0,3452 |
Största minskningarna detta kvartal
Vi använder förändringen i portföljallokeringen eftersom det är det mest meningsfulla måttet. Förändringar kan bero på transaktioner eller förändringar i aktiepriser.
| Värdepapper | Aktier (MM) |
Värde (MM$) |
Portfölj % av | ΔPortfölj % av |
|---|---|---|---|---|
| 0,01 | 0,92 | 0,6517 | −1,6115 | |
| 0,02 | 3,33 | 2,3655 | −0,8439 | |
| 0,00 | 1,42 | 1,0041 | −0,8333 | |
| 0,00 | 0,83 | 0,5923 | −0,5786 | |
| 0,00 | 0,40 | 0,2853 | −0,5460 | |
| 0,01 | 1,71 | 1,2147 | −0,4424 | |
| 0,01 | 3,33 | 2,3594 | −0,4093 | |
| 0,01 | 0,75 | 0,5334 | −0,3719 | |
| 0,02 | 3,09 | 2,1929 | −0,3652 | |
| 0,01 | 2,46 | 1,7467 | −0,3331 |
13F- och fond arkiveringar
Denna blankett lämnades in den 2025-06-25 för rapporteringsperioden 2025-04-30. Klicka på länksymbolen för att se hela transaktionshistoriken.
Uppgradera för att låsa upp premiumdata och exportera till Excel![]() .
.
| Värdepapper | Typ | Genomsnittligt aktiepris | Aktier (MM) |
ΔAktier (%) |
ΔAktier (%) |
Värde ($MM) |
Portfölj (%) |
ΔPortfölj (%) |
|
|---|---|---|---|---|---|---|---|---|---|
| JPM / JPMorgan Chase & Co. | 0,02 | −18,69 | 5,42 | −25,58 | 3,8448 | −0,2974 | |||
| JNJ / Johnson & Johnson | 0,03 | −11,92 | 5,21 | −9,51 | 3,6983 | 0,4216 | |||
| XOM / Exxon Mobil Corporation | 0,04 | −14,48 | 4,62 | −15,44 | 3,2751 | 0,1700 | |||
| WFC / Wells Fargo & Company | 0,06 | −18,90 | 4,60 | −26,93 | 3,2648 | −0,3168 | |||
| GILD / Gilead Sciences, Inc. | 0,03 | −14,13 | 3,43 | −5,88 | 2,4318 | 0,3604 | |||
| CVX / Chevron Corporation | 0,02 | −35,21 | 3,33 | −40,91 | 2,3655 | −0,8439 | |||
| CAT / Caterpillar Inc. | 0,01 | −17,95 | 3,33 | −31,68 | 2,3594 | −0,4093 | |||
| RTX / RTX Corporation | 0,02 | −29,74 | 3,09 | −31,29 | 2,1929 | −0,3652 | |||
| C / Citigroup Inc. | 0,04 | −17,18 | 3,02 | −30,45 | 2,1442 | −0,3275 | |||
| LMT / Lockheed Martin Corporation | 0,01 | −15,19 | 2,91 | −12,48 | 2,0652 | 0,1735 | |||
| MDT / Medtronic plc | 0,03 | −7,72 | 2,87 | −13,88 | 2,0346 | 0,1407 | |||
| BMY / Bristol-Myers Squibb Company | 0,06 | −3,44 | 2,86 | −17,76 | 2,0299 | 0,0507 | |||
| MDLZ / Mondelez International, Inc. | 0,04 | 18,39 | 2,58 | 39,09 | 1,8276 | 0,7742 | |||
| COP / ConocoPhillips | 0,03 | −17,30 | 2,58 | −25,43 | 1,8270 | −0,1370 | |||
| BAC / Bank of America Corporation | 0,06 | −17,76 | 2,50 | −29,18 | 1,7707 | −0,2333 | |||
| DE / Deere & Company | 0,01 | −30,78 | 2,46 | −32,69 | 1,7467 | −0,3331 | |||
| DGCXX / Dreyfus Government Cash Management Funds - Dreyfus Government Cash Management Fund Institutional Shares | 2,44 | 65,20 | 2,44 | 65,20 | 1,7311 | 0,8910 | |||
| MRK / Merck & Co., Inc. | 0,03 | 93,64 | 2,24 | 67,04 | 1,5858 | 0,8243 | |||
| PGR / The Progressive Corporation | 0,01 | 84,97 | 2,05 | 111,48 | 1,4516 | 0,9013 | |||
| ELV / Elevance Health, Inc. | 0,00 | 39,29 | 2,01 | 48,12 | 1,4239 | 0,6528 | |||
| TRV / The Travelers Companies, Inc. | 0,01 | −18,64 | 1,94 | −12,36 | 1,3740 | 0,1172 | |||
| BDX / Becton, Dickinson and Company | 0,01 | −5,09 | 1,86 | −20,62 | 1,3223 | −0,0132 | |||
| USB / U.S. Bancorp | 0,05 | −14,52 | 1,85 | −27,85 | 1,3131 | −0,1455 | |||
| ALL / The Allstate Corporation | 0,01 | 20,08 | 1,80 | 23,90 | 1,2801 | 0,4516 | |||
| EOG / EOG Resources, Inc. | 0,02 | 8,85 | 1,80 | −4,57 | 1,2756 | 0,2044 | |||
| CSX / CSX Corporation | 0,06 | 16,08 | 1,73 | −0,86 | 1,2274 | 0,2348 | |||
| MMM / 3M Company | 0,01 | −35,61 | 1,71 | −41,23 | 1,2147 | −0,4424 | |||
| TFC / Truist Financial Corporation | 0,04 | −11,91 | 1,63 | −29,08 | 1,1545 | −0,1505 | |||
| CB / Chubb Limited | 0,01 | −9,53 | 1,52 | −4,78 | 1,0751 | 0,1697 | |||
| SLB / Schlumberger Limited | 0,04 | −10,79 | 1,48 | −26,33 | 1,0480 | −0,0929 | |||
| CMI / Cummins Inc. | 0,00 | −17,69 | 1,42 | −32,11 | 1,0096 | −0,1826 | |||
| MPC / Marathon Petroleum Corporation | 0,01 | −18,33 | 1,42 | −22,99 | 1,0079 | −0,0412 | |||
| UNH / UnitedHealth Group Incorporated | 0,00 | −42,23 | 1,42 | −56,19 | 1,0041 | −0,8333 | |||
| EMR / Emerson Electric Co. | 0,01 | 27,14 | 1,39 | 2,89 | 0,9855 | 0,2172 | |||
| HIG / The Hartford Insurance Group, Inc. | 0,01 | −12,55 | 1,38 | −3,82 | 0,9814 | 0,1632 | |||
| CTSH / Cognizant Technology Solutions Corporation | 0,02 | −10,91 | 1,35 | −20,69 | 0,9606 | −0,0101 | |||
| HSY / The Hershey Company | 0,01 | −9,80 | 1,31 | 1,01 | 0,9270 | 0,1915 | |||
| HD / The Home Depot, Inc. | 0,00 | −15,03 | 1,31 | −25,67 | 0,9269 | −0,0725 | |||
| EBAY / eBay Inc. | 0,02 | −12,20 | 1,30 | −11,29 | 0,9202 | 0,0884 | |||
| SYY / Sysco Corporation | 0,02 | −16,50 | 1,29 | −18,25 | 0,9156 | 0,0178 | |||
| KHC / The Kraft Heinz Company | 0,04 | −9,89 | 1,29 | −12,11 | 0,9120 | 0,0800 | |||
| VLO / Valero Energy Corporation | 0,01 | −9,16 | 1,28 | −20,71 | 0,9079 | −0,0100 | |||
| GIS / General Mills, Inc. | 0,02 | −8,82 | 1,21 | −13,99 | 0,8594 | 0,0585 | |||
| FDX / FedEx Corporation | 0,01 | −6,29 | 1,20 | −25,61 | 0,8497 | −0,0657 | |||
| OXY / Occidental Petroleum Corporation | 0,03 | 11,35 | 1,18 | −5,97 | 0,8385 | 0,1239 | |||
| WRB / W. R. Berkley Corporation | 0,02 | −15,99 | 1,16 | 2,37 | 0,8262 | 0,1792 | |||
| CL / Colgate-Palmolive Company | 0,01 | −9,65 | 1,12 | −3,95 | 0,7949 | 0,1316 | |||
| NUE / Nucor Corporation | 0,01 | 21,06 | 1,08 | 12,45 | 0,7697 | 0,2213 | |||
| PPG / PPG Industries, Inc. | 0,01 | −12,80 | 1,03 | −17,77 | 0,7327 | 0,0188 | |||
| NEM / Newmont Corporation | 0,02 | 64,76 | 1,01 | 103,44 | 0,7134 | 0,4319 | |||
| ACN / Accenture plc | 0,00 | −9,21 | 1,00 | −29,42 | 0,7116 | −0,0970 | |||
| PSX / Phillips 66 | 0,01 | −35,06 | 1,00 | −42,70 | 0,7107 | −0,2831 | |||
| CRH / CRH plc | 0,01 | −17,42 | 1,00 | −20,38 | 0,7068 | −0,0053 | |||
| FITB / Fifth Third Bancorp | 0,03 | −12,80 | 0,99 | −29,29 | 0,7030 | −0,0939 | |||
| SCCO / Southern Copper Corporation | 0,01 | 58,98 | 0,99 | 55,36 | 0,6990 | 0,3382 | |||
| CINF / Cincinnati Financial Corporation | 0,01 | −12,02 | 0,98 | −10,64 | 0,6977 | 0,0718 | |||
| PNC / The PNC Financial Services Group, Inc. | 0,01 | −7,05 | 0,97 | −25,65 | 0,6912 | −0,0543 | |||
| FERG / Ferguson Enterprises Inc. | 0,01 | 30,68 | 0,97 | 22,45 | 0,6891 | 0,2378 | |||
| Smurfit WestRock PLC / EC (IE00028FXN24) | 0,02 | −4,81 | 0,94 | −24,66 | 0,6639 | −0,0425 | |||
| QCOM / QUALCOMM Incorporated | 0,01 | −80,77 | 0,92 | −80,79 | 0,6517 | −1,6115 | |||
| HBAN / Huntington Bancshares Incorporated | 0,06 | −18,55 | 0,87 | −31,15 | 0,6194 | −0,1023 | |||
| COG / Cabot Oil & Gas Corp. | 0,03 | −12,94 | 0,85 | −22,88 | 0,6008 | −0,0237 | |||
| KR / The Kroger Co. | 0,01 | 60,88 | 0,85 | 88,42 | 0,6007 | 0,3452 | |||
| LEN / Lennar Corporation | 0,01 | 34,93 | 0,84 | 11,76 | 0,5932 | 0,1673 | |||
| HON / Honeywell International Inc. | 0,00 | −56,90 | 0,83 | −59,48 | 0,5923 | −0,5786 | |||
| KMB / Kimberly-Clark Corporation | 0,01 | −34,17 | 0,83 | −33,23 | 0,5903 | −0,1188 | |||
| GPC / Genuine Parts Company | 0,01 | −13,19 | 0,79 | −12,29 | 0,5624 | 0,0487 | |||
| FCX / Freeport-McMoRan Inc. | 0,02 | 56,13 | 0,79 | 56,83 | 0,5623 | 0,2750 | |||
| HAL / Halliburton Company | 0,04 | −8,13 | 0,76 | −30,08 | 0,5398 | −0,0786 | |||
| PCAR / PACCAR Inc | 0,01 | −41,94 | 0,75 | −52,80 | 0,5334 | −0,3719 | |||
| DKS / DICK'S Sporting Goods, Inc. | 0,00 | −8,21 | 0,73 | −28,29 | 0,5185 | −0,0605 | |||
| OMC / Omnicom Group Inc. | 0,01 | −12,72 | 0,71 | −23,45 | 0,5005 | −0,0234 | |||
| DGX / Quest Diagnostics Incorporated | 0,00 | −15,57 | 0,68 | −7,74 | 0,4820 | 0,0631 | |||
| HES / Hess Corporation | 0,01 | −15,99 | 0,68 | −22,04 | 0,4820 | −0,0135 | |||
| HUM / Humana Inc. | 0,00 | 0,44 | 0,66 | −10,16 | 0,4705 | 0,0506 | |||
| WSM / Williams-Sonoma, Inc. | 0,00 | −11,90 | 0,66 | −35,65 | 0,4666 | −0,1144 | |||
| STLD / Steel Dynamics, Inc. | 0,01 | −13,81 | 0,65 | −12,75 | 0,4612 | 0,0372 | |||
| EG / Everest Group, Ltd. | 0,00 | −10,61 | 0,59 | −7,64 | 0,4203 | 0,0552 | |||
| BFB / Brown-Forman Corp. - Class B | 0,02 | 28,85 | 0,58 | 35,81 | 0,4149 | 0,1703 | |||
| RS / Reliance, Inc. | 0,00 | 24,75 | 0,58 | 24,30 | 0,4102 | 0,1454 | |||
| BAX / Baxter International Inc. | 0,02 | −16,26 | 0,54 | −19,79 | 0,3827 | −0,0000 | |||
| AVY / Avery Dennison Corporation | 0,00 | 26,16 | 0,51 | 16,25 | 0,3607 | 0,1119 | |||
| MAS / Masco Corporation | 0,01 | −4,87 | 0,51 | −27,22 | 0,3606 | −0,0369 | |||
| LH / Labcorp Holdings Inc. | 0,00 | −7,75 | 0,49 | −11,01 | 0,3502 | 0,0348 | |||
| BBY / Best Buy Co., Inc. | 0,01 | −10,77 | 0,49 | −30,74 | 0,3472 | −0,0544 | |||
| LVS / Las Vegas Sands Corp. | 0,01 | −15,56 | 0,46 | −32,50 | 0,3248 | −0,0606 | |||
| CDW / CDW Corporation | 0,00 | 72,56 | 0,46 | 39,45 | 0,3237 | 0,1372 | |||
| IFF / International Flavors & Fragrances Inc. | 0,01 | 71,07 | 0,44 | 54,20 | 0,3134 | 0,1504 | |||
| ADM / Archer-Daniels-Midland Company | 0,01 | −43,63 | 0,44 | −47,48 | 0,3110 | −0,1635 | |||
| SSNC / SS&C Technologies Holdings, Inc. | 0,01 | −42,88 | 0,44 | −46,64 | 0,3102 | −0,1560 | |||
| SNA / Snap-on Incorporated | 0,00 | −4,34 | 0,42 | −15,43 | 0,2997 | 0,0155 | |||
| WLK / Westlake Corporation | 0,00 | −17,62 | 0,41 | −33,33 | 0,2925 | −0,0594 | |||
| LHX / L3Harris Technologies, Inc. | 0,00 | −78,30 | 0,40 | −77,09 | 0,2853 | −0,5460 | |||
| DVN / Devon Energy Corporation | 0,01 | −23,09 | 0,38 | −31,52 | 0,2686 | −0,0454 | |||
| TPR / Tapestry, Inc. | 0,01 | −25,01 | 0,38 | −27,47 | 0,2666 | −0,0277 | |||
| BKR / Baker Hughes Company | 0,01 | 0,37 | 0,2635 | 0,2635 | |||||
| BAH / Booz Allen Hamilton Holding Corporation | 0,00 | 63,42 | 0,36 | 52,30 | 0,2583 | 0,1221 | |||
| CNH / CNH Industrial N.V. | 0,03 | 74,14 | 0,36 | 56,39 | 0,2520 | 0,1228 | |||
| STZ / Constellation Brands, Inc. | 0,00 | 0,34 | 0,2379 | 0,2379 | |||||
| CF / CF Industries Holdings, Inc. | 0,00 | −19,08 | 0,32 | −31,28 | 0,2295 | −0,0380 | |||
| BR / Broadridge Financial Solutions, Inc. | 0,00 | −13,23 | 0,30 | −11,83 | 0,2120 | 0,0195 | |||
| CBOE / Cboe Global Markets, Inc. | 0,00 | −4,56 | 0,30 | 3,85 | 0,2109 | 0,0477 | |||
| ROK / Rockwell Automation, Inc. | 0,00 | −19,93 | 0,27 | −28,80 | 0,1900 | −0,0238 | |||
| SWKS / Skyworks Solutions, Inc. | 0,00 | −46,46 | 0,23 | −61,30 | 0,1657 | −0,1770 | |||
| RBA / RB Global, Inc. | 0,00 | −12,46 | 0,23 | −1,75 | 0,1602 | 0,0298 | |||
| RF / Regions Financial Corporation | 0,01 | −16,81 | 0,20 | −31,12 | 0,1399 | −0,0229 | |||
| RL / Ralph Lauren Corporation | 0,00 | −14,92 | 0,17 | −23,66 | 0,1219 | −0,0056 | |||
| MCHP / Microchip Technology Incorporated | 0,00 | −64,69 | 0,17 | −70,20 | 0,1184 | −0,1984 | |||
| TAP / Molson Coors Beverage Company | 0,00 | −3,39 | 0,16 | 1,24 | 0,1162 | 0,0244 | |||
| CAG / Conagra Brands, Inc. | 0,01 | −4,85 | 0,16 | −8,94 | 0,1158 | 0,0136 | |||
| OC / Owens Corning | 0,00 | −15,50 | 0,16 | −33,47 | 0,1119 | −0,0228 |