Grundläggande statistik
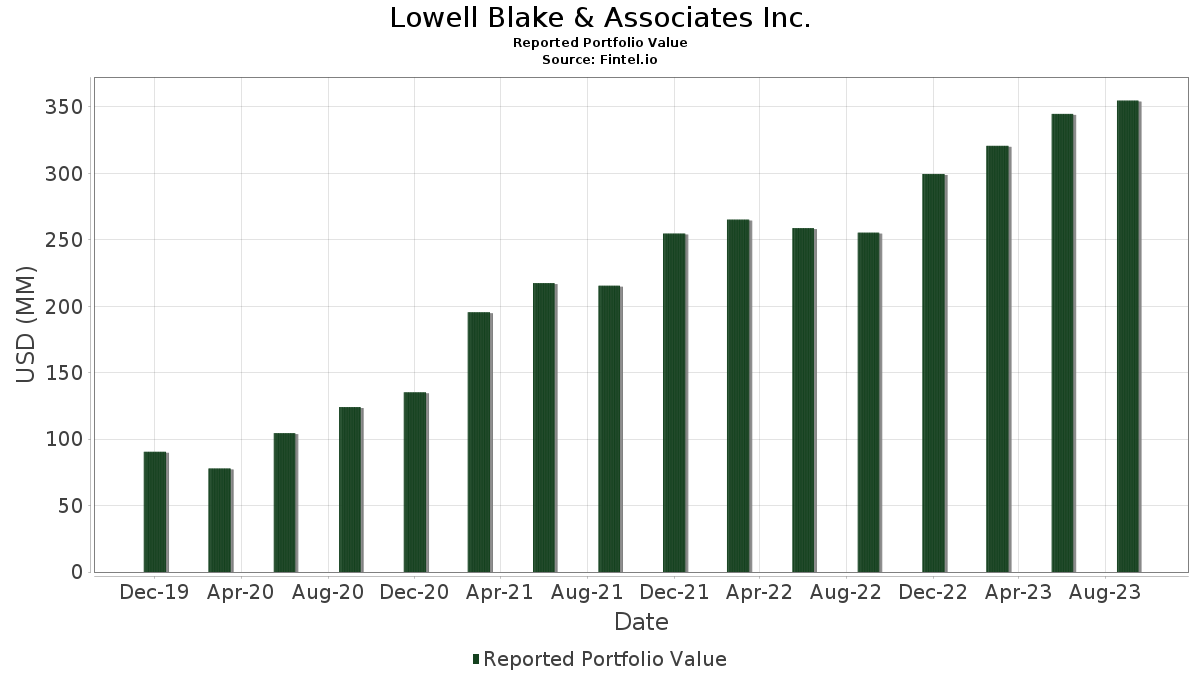
| Portföljvärde | $ 354 768 822 |
| Aktuella positioner | 62 |
Senaste innehav, resultat, förvaltat kapital (från 13F, 13D)
Lowell Blake & Associates Inc. har redovisat 62 totala innehav i sina senaste SEC-arkiveringar. Det senaste portföljvärdet beräknas vara $ 354 768 822 USD. Faktiskt förvaltade tillgångar (AUM) är detta värde plus likvida medel (som inte redovisas). Lowell Blake & Associates Inc.s största innehav är NVIDIA Corporation (US:NVDA) , Microsoft Corporation (US:MSFT) , Apple Inc. (US:AAPL) , Alphabet Inc. (US:GOOGL) , and Visa Inc. (US:V) . Lowell Blake & Associates Inc.s nya positioner inkluderar Becton, Dickinson and Company (US:BDX) , .
Största ökningarna detta kvartal
Vi använder förändringen i portföljallokeringen eftersom det är det mest meningsfulla måttet. Förändringar kan bero på transaktioner eller förändringar i aktiekurser.
| Värdepapper | Aktier (MM) |
Värde (MM$) |
Portfölj % av | ΔPortfölj % av |
|---|---|---|---|---|
| 0,16 | 20,43 | 5,7594 | 0,7015 | |
| 0,01 | 2,92 | 0,8232 | 0,4547 | |
| 0,11 | 13,74 | 3,8740 | 0,3869 | |
| 0,18 | 6,92 | 1,9503 | 0,3850 | |
| 0,06 | 6,75 | 1,9034 | 0,2585 | |
| 0,07 | 4,29 | 1,2086 | 0,2161 | |
| 0,08 | 7,64 | 2,1545 | 0,2140 | |
| 0,07 | 2,25 | 0,6343 | 0,2094 | |
| 0,03 | 3,15 | 0,8872 | 0,1933 | |
| 0,00 | 1,50 | 0,4236 | 0,1576 |
Största minskningarna detta kvartal
Vi använder förändringen i portföljallokeringen eftersom det är det mest meningsfulla måttet. Förändringar kan bero på transaktioner eller förändringar i aktiepriser.
| Värdepapper | Aktier (MM) |
Värde (MM$) |
Portfölj % av | ΔPortfölj % av |
|---|---|---|---|---|
| 0,13 | 22,03 | 6,2091 | −1,0118 | |
| 0,14 | 9,92 | 2,7973 | −0,7632 | |
| 0,26 | 27,92 | 7,8706 | −0,6232 | |
| 0,13 | 14,06 | 3,9637 | −0,3221 | |
| 0,09 | 15,41 | 4,3432 | −0,3118 | |
| 0,17 | 10,12 | 2,8522 | −0,2119 | |
| 0,10 | 14,93 | 4,2083 | −0,1882 | |
| 0,30 | 9,35 | 2,6348 | −0,1451 | |
| 0,12 | 4,09 | 1,1518 | −0,1150 | |
| 2,29 | 30,50 | 8,5965 | −0,0808 |
13F- och fond arkiveringar
Denna blankett lämnades in den 2023-11-13 för rapporteringsperioden 2023-09-30. Klicka på länksymbolen för att se hela transaktionshistoriken.
Uppgradera för att låsa upp premiumdata och exportera till Excel![]() .
.
| Värdepapper | Typ | Genomsnittligt aktiepris | Aktier (MM) |
ΔAktier (%) |
ΔAktier (%) |
Värde ($MM) |
Portfölj (%) |
ΔPortfölj (%) |
|
|---|---|---|---|---|---|---|---|---|---|
| NVDA / NVIDIA Corporation | 2,29 | 3 133,59 | 30,50 | 1,95 | 8,5965 | −0,0808 | |||
| MSFT / Microsoft Corporation | 0,26 | 202,19 | 27,92 | −4,64 | 7,8706 | −0,6232 | |||
| AAPL / Apple Inc. | 0,13 | 0,25 | 22,03 | −11,51 | 6,2091 | −1,0118 | |||
| GOOGL / Alphabet Inc. | 0,16 | 7,19 | 20,43 | 17,18 | 5,7594 | 0,7015 | |||
| V / Visa Inc. | 0,07 | 6,06 | 17,11 | 2,73 | 4,8226 | −0,0085 | |||
| GJR / Strats Trust For Procter & Gambel Security - Preferred Security | 0,12 | 5,91 | 17,07 | 1,80 | 4,8114 | −0,0523 | |||
| AMZN / Amazon.com, Inc. | 0,13 | 8,13 | 16,57 | 5,45 | 4,6701 | 0,1122 | |||
| PEP / PepsiCo, Inc. | 0,09 | 4,96 | 15,41 | −3,98 | 4,3432 | −0,3118 | |||
| JNJ / Johnson & Johnson | 0,10 | 4,68 | 14,93 | −1,50 | 4,2083 | −0,1882 | |||
| CNI / Canadian National Railway Company | 0,13 | 6,37 | 14,06 | −4,82 | 3,9637 | −0,3221 | |||
| ATR / AptarGroup, Inc. | 0,11 | 5,93 | 13,74 | 14,32 | 3,8740 | 0,3869 | |||
| HD / The Home Depot, Inc. | 0,04 | 10,21 | 13,59 | 7,20 | 3,8305 | 0,1533 | |||
| NKE / NIKE, Inc. | 0,17 | 78,23 | 10,12 | −4,21 | 2,8522 | −0,2119 | |||
| EW / Edwards Lifesciences Corporation | 0,14 | 10,08 | 9,92 | −19,15 | 2,7973 | −0,7632 | |||
| KDP / Keurig Dr Pepper Inc. | 0,30 | −3,39 | 9,35 | −2,46 | 2,6348 | −0,1451 | |||
| ALC / Alcon Inc. | 0,12 | 6,81 | 9,07 | 0,24 | 2,5572 | −0,0679 | |||
| EMR / Emerson Electric Co. | 0,08 | 6,94 | 7,64 | 14,26 | 2,1545 | 0,2140 | |||
| EPD / Enterprise Products Partners L.P. - Limited Partnership | 0,27 | 3,93 | 7,52 | 7,95 | 2,1210 | 0,0991 | |||
| PAR / PAR Technology Corporation | 0,18 | 9,56 | 6,92 | 28,22 | 1,9503 | 0,3850 | |||
| COP / ConocoPhillips | 0,06 | 2,99 | 6,75 | 19,08 | 1,9034 | 0,2585 | |||
| TYL / Tyler Technologies, Inc. | 0,02 | 14,60 | 5,98 | 6,26 | 1,6848 | 0,0530 | |||
| UNP / Union Pacific Corporation | 0,03 | 4,93 | 5,89 | 4,42 | 1,6589 | 0,0240 | |||
| ECL / Ecolab Inc. | 0,03 | 24,01 | 5,14 | 12,52 | 1,4487 | 0,1238 | |||
| JJSF / J&J Snack Foods Corp. | 0,03 | 7,96 | 4,87 | 11,58 | 1,3714 | 0,1065 | |||
| AMT / American Tower Corporation | 0,03 | 30,10 | 4,75 | 10,32 | 1,3385 | 0,0898 | |||
| GOOG / Alphabet Inc. | 0,07 | 131,15 | 4,29 | 25,31 | 1,2086 | 0,2161 | |||
| GGG / Graco Inc. | 0,12 | 137,06 | 4,09 | −6,43 | 1,1518 | −0,1150 | |||
| NVO / Novo Nordisk A/S - Depositary Receipt (Common Stock) | 0,03 | 134,15 | 3,15 | 31,56 | 0,8872 | 0,1933 | |||
| TMO / Thermo Fisher Scientific Inc. | 0,01 | 136,96 | 2,92 | 129,92 | 0,8232 | 0,4547 | |||
| MTD / Mettler-Toledo International Inc. | 0,00 | 50,93 | 2,89 | 27,53 | 0,8136 | 0,1569 | |||
| VNT / Vontier Corporation | 0,07 | 60,03 | 2,25 | 53,69 | 0,6343 | 0,2094 | |||
| NVS / Novartis AG - Depositary Receipt (Common Stock) | 0,02 | −2,90 | 2,12 | −1,95 | 0,5968 | −0,0298 | |||
| ORCL / Oracle Corporation | 0,01 | 0,00 | 1,59 | −11,09 | 0,4478 | −0,0703 | |||
| SPGI / S&P Global Inc. | 0,00 | 79,80 | 1,50 | 63,79 | 0,4236 | 0,1576 | |||
| GPC / Genuine Parts Company | 0,01 | 3,44 | 1,30 | −11,73 | 0,3671 | −0,0610 | |||
| UL / Unilever PLC - Depositary Receipt (Common Stock) | 0,02 | 10,72 | 0,98 | 4,91 | 0,2769 | 0,0053 | |||
| COST / Costco Wholesale Corporation | 0,00 | 13,20 | 0,97 | 18,77 | 0,2731 | 0,0365 | |||
| ROL / Rollins, Inc. | 0,02 | 0,00 | 0,80 | −12,83 | 0,2241 | −0,0405 | |||
| IVV / iShares Trust - iShares Core S&P 500 ETF | 0,00 | −7,71 | 0,77 | −11,07 | 0,2175 | −0,0342 | |||
| WCN / Waste Connections, Inc. | 0,01 | 100,11 | 0,71 | 88,27 | 0,1990 | 0,0901 | |||
| SON / Sonoco Products Company | 0,01 | −2,89 | 0,64 | −10,64 | 0,1800 | −0,0271 | |||
| NEE.PRN / NextEra Energy Capital Holdings, Inc. - Corporate Bond/Note | 0,01 | −2,03 | 0,55 | −24,35 | 0,1560 | −0,0562 | |||
| BRK.A / Berkshire Hathaway Inc. | 0,00 | 0,00 | 0,53 | 2,70 | 0,1505 | −0,0003 | |||
| AZO / AutoZone, Inc. | 0,00 | 0,00 | 0,53 | 1,93 | 0,1489 | −0,0015 | |||
| SWK / Stanley Black & Decker, Inc. | 0,01 | 0,00 | 0,44 | −10,71 | 0,1247 | −0,0192 | |||
| WIRE / Encore Wire Corporation | 0,00 | 0,00 | 0,40 | −1,97 | 0,1126 | −0,0055 | |||
| VO / Vanguard Index Funds - Vanguard Mid-Cap ETF | 0,00 | 0,00 | 0,40 | −5,46 | 0,1123 | −0,0099 | |||
| AMGN / Amgen Inc. | 0,00 | 0,00 | 0,35 | 21,05 | 0,0974 | 0,0146 | |||
| FUTY / Fidelity Covington Trust - Fidelity MSCI Utilities Index ETF | 0,01 | 0,00 | 0,32 | −10,23 | 0,0892 | −0,0131 | |||
| MTUM / iShares Trust - iShares MSCI USA Momentum Factor ETF | 0,00 | 0,00 | 0,31 | −3,14 | 0,0868 | −0,0054 | |||
| XOM / Exxon Mobil Corporation | 0,00 | 0,00 | 0,29 | 9,40 | 0,0823 | 0,0050 | |||
| SCHM / Schwab Strategic Trust - Schwab U.S. Mid-Cap ETF | 0,00 | 0,00 | 0,27 | −4,93 | 0,0763 | −0,0061 | |||
| ADP / Automatic Data Processing, Inc. | 0,00 | 0,26 | 0,0726 | 0,0726 | |||||
| HSIC / Henry Schein, Inc. | 0,00 | 37,08 | 0,26 | 25,49 | 0,0724 | 0,0130 | |||
| AFL / Aflac Incorporated | 0,00 | 0,00 | 0,25 | 10,09 | 0,0708 | 0,0045 | |||
| INTC / Intel Corporation | 0,01 | 7,96 | 0,24 | 14,83 | 0,0679 | 0,0070 | |||
| BAC / Bank of America Corporation | 0,01 | 0,00 | 0,22 | −4,41 | 0,0612 | −0,0048 | |||
| CSX / CSX Corporation | 0,01 | 0,00 | 0,21 | −10,08 | 0,0605 | −0,0085 | |||
| PH / Parker-Hannifin Corporation | 0,00 | 0,00 | 0,21 | 0,00 | 0,0604 | −0,0018 | |||
| TER / Teradyne, Inc. | 0,00 | 0,00 | 0,20 | −9,82 | 0,0572 | −0,0080 | |||
| IEFA / iShares Trust - iShares Core MSCI EAFE ETF | 0,00 | 0,00 | 0,20 | −4,74 | 0,0567 | −0,0045 | |||
| BDX / Becton, Dickinson and Company | 0,06 | 0,09 | 0,0260 | 0,0260 | |||||
| IPGP / IPG Photonics Corporation | 0,00 | −100,00 | 0,00 | −100,00 | −0,0607 |