Grundläggande statistik
| Portföljvärde | $ 5 165 155 |
| Aktuella positioner | 85 |
Senaste innehav, resultat, förvaltat kapital (från 13F, 13D)
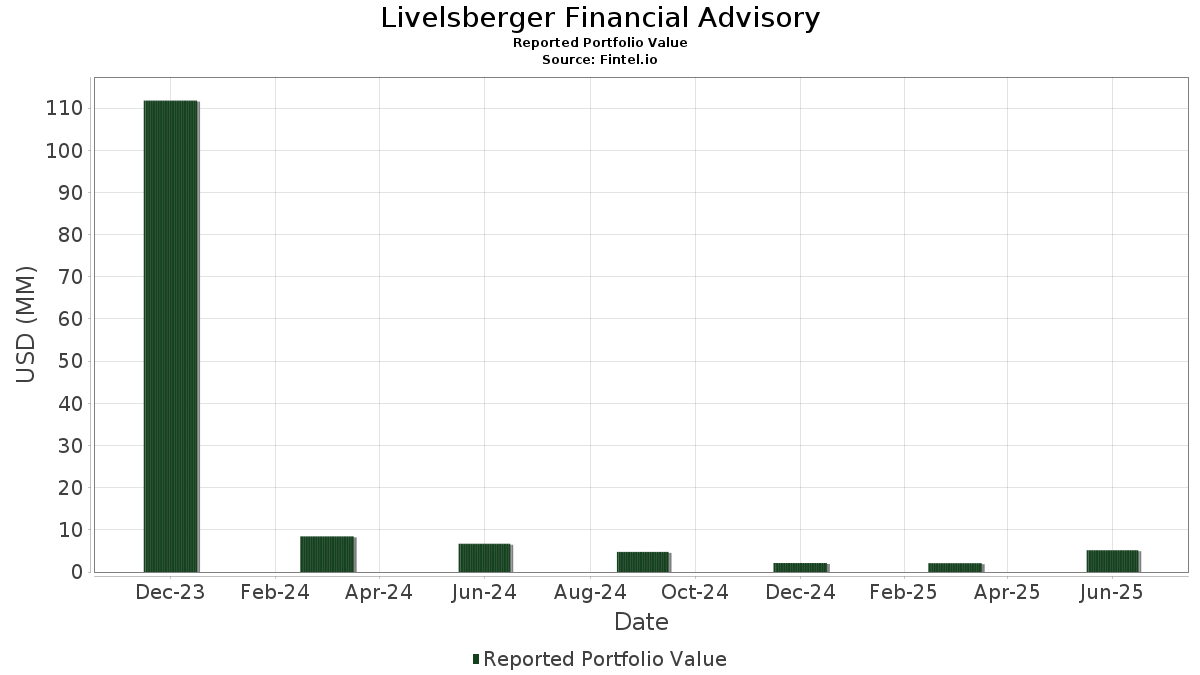
Livelsberger Financial Advisory har redovisat 85 totala innehav i sina senaste SEC-arkiveringar. Det senaste portföljvärdet beräknas vara $ 5 165 155 USD. Faktiskt förvaltade tillgångar (AUM) är detta värde plus likvida medel (som inte redovisas). Livelsberger Financial Advisorys största innehav är AbbVie Inc. (US:ABBV) , Abbott Laboratories (US:ABT) , Apple Inc. (US:AAPL) , Exxon Mobil Corporation (US:XOM) , and Microsoft Corporation (US:MSFT) . Livelsberger Financial Advisorys nya positioner inkluderar RPM International Inc. (US:RPM) , Blackstone Inc. (US:BX) , Park National Corporation (US:PRK) , Ferguson Enterprises Inc. (US:FERG) , and GE Vernova Inc. (US:GEV) .
Största ökningarna detta kvartal
Vi använder förändringen i portföljallokeringen eftersom det är det mest meningsfulla måttet. Förändringar kan bero på transaktioner eller förändringar i aktiekurser.
| Värdepapper | Aktier (MM) |
Värde (MM$) |
Portfölj % av | ΔPortfölj % av |
|---|---|---|---|---|
| 0,00 | 0,24 | 4,6239 | 4,6239 | |
| 0,00 | 0,17 | 3,2558 | 3,2558 | |
| 0,00 | 0,15 | 2,8567 | 2,8567 | |
| 0,00 | 0,15 | 2,8153 | 2,8153 | |
| 0,00 | 0,14 | 2,6972 | 2,6972 | |
| 0,00 | 0,14 | 2,6950 | 2,6950 | |
| 0,00 | 0,13 | 2,5191 | 2,5191 | |
| 0,00 | 0,12 | 2,3218 | 2,3218 | |
| 0,00 | 0,12 | 2,3062 | 2,3062 | |
| 0,00 | 0,12 | 2,2669 | 2,2669 |
Största minskningarna detta kvartal
Vi använder förändringen i portföljallokeringen eftersom det är det mest meningsfulla måttet. Förändringar kan bero på transaktioner eller förändringar i aktiepriser.
| Värdepapper | Aktier (MM) |
Värde (MM$) |
Portfölj % av | ΔPortfölj % av |
|---|---|---|---|---|
| 0,00 | 0,85 | 16,3995 | −24,9127 | |
| 0,00 | 0,36 | 6,8894 | −11,4907 | |
| 0,00 | 0,44 | 8,6077 | −9,4400 | |
| 0,00 | 0,24 | 4,6889 | −7,9623 | |
| 0,00 | 0,23 | 4,4877 | −5,1211 |
13F- och fond arkiveringar
Denna blankett lämnades in den 2025-07-08 för rapporteringsperioden 2025-06-30. Klicka på länksymbolen för att se hela transaktionshistoriken.
Uppgradera för att låsa upp premiumdata och exportera till Excel![]() .
.
| Värdepapper | Typ | Genomsnittligt aktiepris | Aktier (MM) |
ΔAktier (%) |
ΔAktier (%) |
Värde ($MM) |
Portfölj (%) |
ΔPortfölj (%) |
|
|---|---|---|---|---|---|---|---|---|---|
| ABBV / AbbVie Inc. | 0,00 | 10,54 | 0,85 | −1,97 | 16,3995 | −24,9127 | |||
| ABT / Abbott Laboratories | 0,00 | 14,74 | 0,44 | 17,77 | 8,6077 | −9,4400 | |||
| AAPL / Apple Inc. | 0,00 | 0,12 | 0,36 | −7,55 | 6,8894 | −11,4907 | |||
| XOM / Exxon Mobil Corporation | 0,00 | 0,81 | 0,24 | −8,33 | 4,6889 | −7,9623 | |||
| MSFT / Microsoft Corporation | 0,00 | 0,24 | 4,6239 | 4,6239 | |||||
| PH / Parker-Hannifin Corporation | 0,00 | 0,30 | 0,23 | 14,93 | 4,4877 | −5,1211 | |||
| RPM / RPM International Inc. | 0,00 | 0,17 | 3,2558 | 3,2558 | |||||
| NSC / Norfolk Southern Corporation | 0,00 | 0,15 | 2,8567 | 2,8567 | |||||
| ECL / Ecolab Inc. | 0,00 | 0,15 | 2,8153 | 2,8153 | |||||
| FDX / FedEx Corporation | 0,00 | 0,14 | 2,6972 | 2,6972 | |||||
| ALL / The Allstate Corporation | 0,00 | 0,14 | 2,6950 | 2,6950 | |||||
| T / AT&T Inc. | 0,00 | 0,13 | 2,5191 | 2,5191 | |||||
| COP / ConocoPhillips | 0,00 | 0,12 | 2,3218 | 2,3218 | |||||
| EMR / Emerson Electric Co. | 0,00 | 0,12 | 2,3062 | 2,3062 | |||||
| ELV / Elevance Health, Inc. | 0,00 | 0,12 | 2,2669 | 2,2669 | |||||
| PFE / Pfizer Inc. | 0,00 | 0,11 | 2,0996 | 2,0996 | |||||
| JNJ / Johnson & Johnson | 0,00 | 0,11 | 2,0626 | 2,0626 | |||||
| PM / Philip Morris International Inc. | 0,00 | 0,11 | 2,0575 | 2,0575 | |||||
| MPC / Marathon Petroleum Corporation | 0,00 | 0,09 | 1,6869 | 1,6869 | |||||
| MS / Morgan Stanley | 0,00 | 0,09 | 1,6730 | 1,6730 | |||||
| DIS / The Walt Disney Company | 0,00 | 0,07 | 1,4162 | 1,4162 | |||||
| INTC / Intel Corporation | 0,00 | 0,07 | 1,2952 | 1,2952 | |||||
| PSX / Phillips 66 | 0,00 | 0,05 | 1,0370 | 1,0370 | |||||
| QCOM / QUALCOMM Incorporated | 0,00 | 0,05 | 0,9985 | 0,9985 | |||||
| MMM / 3M Company | 0,00 | 0,05 | 0,9520 | 0,9520 | |||||
| AMGN / Amgen Inc. | 0,00 | 0,05 | 0,9438 | 0,9438 | |||||
| CVX / Chevron Corporation | 0,00 | 0,05 | 0,9065 | 0,9065 | |||||
| LOW / Lowe's Companies, Inc. | 0,00 | 0,05 | 0,9024 | 0,9024 | |||||
| SYY / Sysco Corporation | 0,00 | 0,05 | 0,8827 | 0,8827 | |||||
| WMT / Walmart Inc. | 0,00 | 0,04 | 0,8519 | 0,8519 | |||||
| UNP / Union Pacific Corporation | 0,00 | 0,04 | 0,8244 | 0,8244 | |||||
| HD / The Home Depot, Inc. | 0,00 | 0,04 | 0,8021 | 0,8021 | |||||
| DE / Deere & Company | 0,00 | 0,04 | 0,7536 | 0,7536 | |||||
| CVS / CVS Health Corporation | 0,00 | 0,04 | 0,6833 | 0,6833 | |||||
| ADSK / Autodesk, Inc. | 0,00 | 0,03 | 0,5933 | 0,5933 | |||||
| BX / Blackstone Inc. | 0,00 | 0,03 | 0,5792 | 0,5792 | |||||
| TKR / The Timken Company | 0,00 | 0,03 | 0,5451 | 0,5451 | |||||
| VRSN / VeriSign, Inc. | 0,00 | 0,03 | 0,5257 | 0,5257 | |||||
| PRK / Park National Corporation | 0,00 | 0,03 | 0,5214 | 0,5214 | |||||
| A / Agilent Technologies, Inc. | 0,00 | 0,02 | 0,4260 | 0,4260 | |||||
| BDX / Becton, Dickinson and Company | 0,00 | 0,02 | 0,3635 | 0,3635 | |||||
| HSY / The Hershey Company | 0,00 | 0,02 | 0,3306 | 0,3306 | |||||
| GE / General Electric Company | 0,00 | 0,02 | 0,3105 | 0,3105 | |||||
| R / Ryder System, Inc. | 0,00 | 0,02 | 0,3078 | 0,3078 | |||||
| MRVL / Marvell Technology, Inc. | 0,00 | 0,02 | 0,2997 | 0,2997 | |||||
| BIIB / Biogen Inc. | 0,00 | 0,01 | 0,2431 | 0,2431 | |||||
| CTVA / Corteva, Inc. | 0,00 | 0,01 | 0,1948 | 0,1948 | |||||
| FERG / Ferguson Enterprises Inc. | 0,00 | 0,01 | 0,1926 | 0,1926 | |||||
| DD / DuPont de Nemours, Inc. | 0,00 | 0,01 | 0,1793 | 0,1793 | |||||
| SBUX / Starbucks Corporation | 0,00 | 0,01 | 0,1774 | 0,1774 | |||||
| PEP / PepsiCo, Inc. | 0,00 | 0,01 | 0,1662 | 0,1662 | |||||
| GEV / GE Vernova Inc. | 0,00 | 0,01 | 0,1537 | 0,1537 | |||||
| DVN / Devon Energy Corporation | 0,00 | 0,01 | 0,1470 | 0,1470 | |||||
| LMT / Lockheed Martin Corporation | 0,00 | 0,01 | 0,1419 | 0,1419 | |||||
| CSCO / Cisco Systems, Inc. | 0,00 | 0,01 | 0,1223 | 0,1223 | |||||
| LECO / Lincoln Electric Holdings, Inc. | 0,00 | 0,01 | 0,1204 | 0,1204 | |||||
| SOLV / Solventum Corporation | 0,00 | 0,01 | 0,1175 | 0,1175 | |||||
| ANIX / Anixa Biosciences, Inc. | 0,00 | 0,01 | 0,1044 | 0,1044 | |||||
| VKQ / Invesco Municipal Trust | 0,00 | 0,01 | 0,0980 | 0,0980 | |||||
| C / Citigroup Inc. | 0,00 | 0,01 | 0,0972 | 0,0972 | |||||
| CSX / CSX Corporation | 0,00 | 0,00 | 0,0957 | 0,0957 | |||||
| VTRS / Viatris Inc. | 0,00 | 0,00 | 0,0917 | 0,0917 | |||||
| DOW / Dow Inc. | 0,00 | 0,00 | 0,0697 | 0,0697 | |||||
| CMI / Cummins Inc. | 0,00 | 0,00 | 0,0578 | 0,0578 | |||||
| CI / The Cigna Group | 0,00 | 0,00 | 0,0576 | 0,0576 | |||||
| MTUS / Metallus Inc. | 0,00 | 0,00 | 0,0543 | 0,0543 | |||||
| KHC / The Kraft Heinz Company | 0,00 | 0,00 | 0,0408 | 0,0408 | |||||
| KD / Kyndryl Holdings, Inc. | 0,00 | 0,00 | 0,0406 | 0,0406 | |||||
| NGVT / Ingevity Corporation | 0,00 | 0,00 | 0,0359 | 0,0359 | |||||
| BALL / Ball Corporation | 0,00 | 0,00 | 0,0304 | 0,0304 | |||||
| OGN / Organon & Co. | 0,00 | 0,00 | 0,0298 | 0,0298 | |||||
| TMUS / T-Mobile US, Inc. | 0,00 | 0,00 | 0,0138 | 0,0138 | |||||
| CC / The Chemours Company | 0,00 | 0,00 | 0,0135 | 0,0135 | |||||
| ACCO / ACCO Brands Corporation | 0,00 | 0,00 | 0,0092 | 0,0092 | |||||
| WAB / Westinghouse Air Brake Technologies Corporation | 0,00 | 0,00 | 0,0081 | 0,0081 | |||||
| OTIS / Otis Worldwide Corporation | 0,00 | 0,00 | 0,0080 | 0,0080 | |||||
| NOV / NOV Inc. | 0,00 | 0,00 | 0,0070 | 0,0070 | |||||
| VFC / V.F. Corporation | 0,00 | 0,00 | 0,0043 | 0,0043 | |||||
| EMBC / Embecta Corp. | 0,00 | 0,00 | 0,0041 | 0,0041 | |||||
| KTB / Kontoor Brands, Inc. | 0,00 | 0,00 | 0,0030 | 0,0030 | |||||
| REZI / Resideo Technologies, Inc. | 0,00 | 0,00 | 0,0021 | 0,0021 | |||||
| BHF / Brighthouse Financial, Inc. | 0,00 | 0,00 | 0,0021 | 0,0021 | |||||
| LUMN / Lumen Technologies, Inc. | 0,00 | 0,00 | 0,0008 | 0,0008 | |||||
| GTX / Garrett Motion Inc. | 0,00 | 0,00 | 0,0006 | 0,0006 | |||||
| US004397AK17 / Accuray, Inc. | 0,00 | 0,00 | 0,0002 | 0,0002 |