Grundläggande statistik
| Portföljvärde | $ 14 039 653 |
| Aktuella positioner | 111 |
Senaste innehav, resultat, förvaltat kapital (från 13F, 13D)
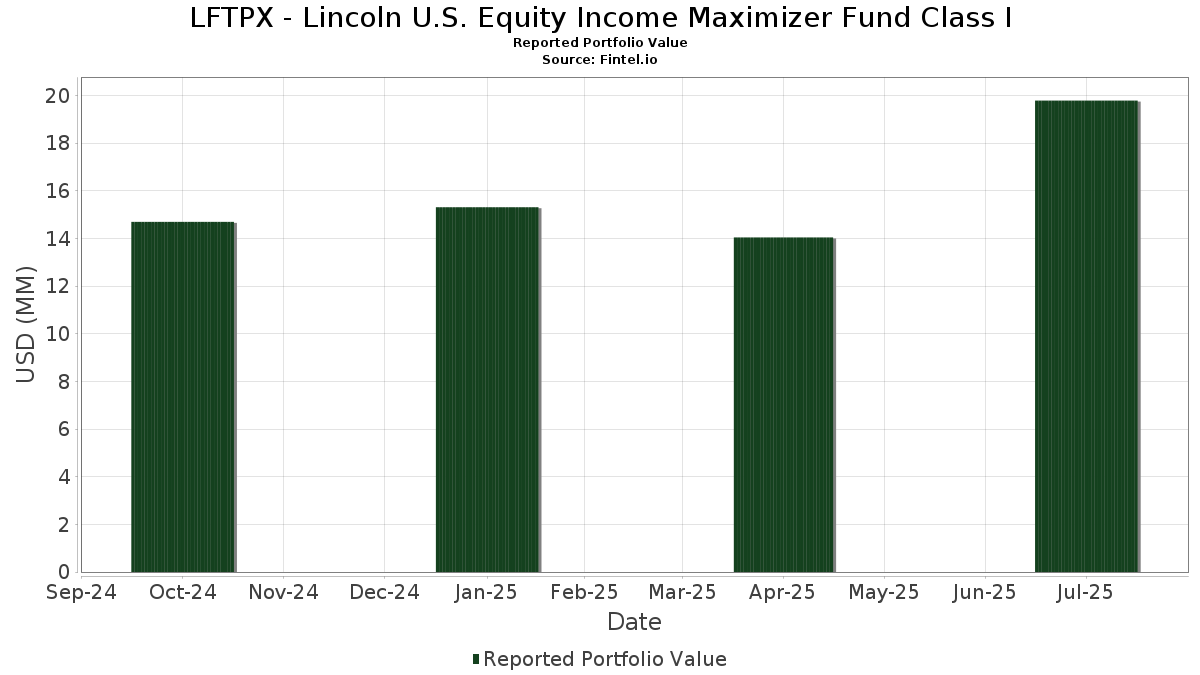
LFTPX - Lincoln U.S. Equity Income Maximizer Fund Class I har redovisat 111 totala innehav i sina senaste SEC-arkiveringar. Det senaste portföljvärdet beräknas vara $ 14 039 653 USD. Faktiskt förvaltade tillgångar (AUM) är detta värde plus likvida medel (som inte redovisas). LFTPX - Lincoln U.S. Equity Income Maximizer Fund Class Is största innehav är Apple Inc. (US:AAPL) , Microsoft Corporation (US:MSFT) , NVIDIA Corporation (US:NVDA) , Amazon.com, Inc. (US:AMZN) , and Alphabet Inc. (US:GOOG) .
Största ökningarna detta kvartal
Vi använder förändringen i portföljallokeringen eftersom det är det mest meningsfulla måttet. Förändringar kan bero på transaktioner eller förändringar i aktiekurser.
| Värdepapper | Aktier (MM) |
Värde (MM$) |
Portfölj % av | ΔPortfölj % av |
|---|---|---|---|---|
| 0,00 | 0,34 | 2,3027 | 0,4381 | |
| 0,00 | 0,17 | 1,1399 | 0,3419 | |
| 0,00 | 0,23 | 1,5872 | 0,2678 | |
| 0,00 | 0,10 | 0,7060 | 0,2530 | |
| 0,00 | 0,18 | 1,2160 | 0,2491 | |
| 0,00 | 0,18 | 1,2141 | 0,2353 | |
| 0,00 | 0,89 | 6,0808 | 0,1977 | |
| 0,00 | 0,12 | 0,8331 | 0,1756 | |
| 0,00 | 0,22 | 1,5029 | 0,1551 | |
| 0,00 | 0,11 | 0,7520 | 0,1460 |
Största minskningarna detta kvartal
Vi använder förändringen i portföljallokeringen eftersom det är det mest meningsfulla måttet. Förändringar kan bero på transaktioner eller förändringar i aktiepriser.
| Värdepapper | Aktier (MM) |
Värde (MM$) |
Portfölj % av | ΔPortfölj % av |
|---|---|---|---|---|
| 0,00 | 0,54 | 3,7055 | −0,6945 | |
| 0,00 | 0,52 | 3,5520 | −0,6300 | |
| 0,00 | 0,25 | 1,6896 | −0,5426 | |
| 0,00 | 0,36 | 2,4947 | −0,3906 | |
| 0,00 | 0,13 | 0,9151 | −0,1966 | |
| 0,00 | 0,10 | 0,6664 | −0,1891 | |
| 0,00 | 0,99 | 6,8030 | −0,1580 | |
| 0,00 | 0,30 | 2,0746 | −0,1228 | |
| 0,00 | 0,10 | 0,6988 | −0,1199 | |
| 0,00 | 0,12 | 0,7933 | −0,1192 |
13F- och fond arkiveringar
Denna blankett lämnades in den 2025-06-10 för rapporteringsperioden 2025-04-30. Klicka på länksymbolen för att se hela transaktionshistoriken.
Uppgradera för att låsa upp premiumdata och exportera till Excel![]() .
.
| Värdepapper | Typ | Genomsnittligt aktiepris | Aktier (MM) |
ΔAktier (%) |
ΔAktier (%) |
Värde ($MM) |
Portfölj (%) |
ΔPortfölj (%) |
|
|---|---|---|---|---|---|---|---|---|---|
| AAPL / Apple Inc. | 0,00 | 0,00 | 0,99 | −9,96 | 6,8030 | −0,1580 | |||
| MSFT / Microsoft Corporation | 0,00 | 0,00 | 0,89 | −4,82 | 6,0808 | 0,1977 | |||
| NVDA / NVIDIA Corporation | 0,01 | 0,00 | 0,82 | −9,28 | 5,6196 | −0,0879 | |||
| AMZN / Amazon.com, Inc. | 0,00 | 0,00 | 0,54 | −22,38 | 3,7055 | −0,6945 | |||
| GOOG / Alphabet Inc. | 0,00 | 0,00 | 0,52 | −21,72 | 3,5520 | −0,6300 | |||
| META / Meta Platforms, Inc. | 0,00 | 0,00 | 0,36 | −20,35 | 2,4947 | −0,3906 | |||
| BRK.A / Berkshire Hathaway Inc. | 0,00 | 0,00 | 0,34 | 13,90 | 2,3027 | 0,4381 | |||
| AVGO / Broadcom Inc. | 0,00 | 0,00 | 0,30 | −12,93 | 2,0746 | −0,1228 | |||
| JPM / JPMorgan Chase & Co. | 0,00 | 0,00 | 0,30 | −8,67 | 2,0256 | −0,0137 | |||
| TSLA / Tesla, Inc. | 0,00 | 0,00 | 0,25 | −30,51 | 1,6896 | −0,5426 | |||
| LLY / Eli Lilly and Company | 0,00 | 0,00 | 0,23 | 10,53 | 1,5872 | 0,2678 | |||
| JNJ / Johnson & Johnson | 0,00 | 0,00 | 0,22 | 2,82 | 1,5029 | 0,1551 | |||
| V / Visa Inc. | 0,00 | 0,00 | 0,22 | 0,93 | 1,4849 | 0,1315 | |||
| MA / Mastercard Incorporated | 0,00 | 0,00 | 0,19 | −1,57 | 1,2902 | 0,0855 | |||
| COST / Costco Wholesale Corporation | 0,00 | 0,00 | 0,19 | 1,09 | 1,2795 | 0,1180 | |||
| SRE / Sempra | 0,00 | 0,00 | 0,19 | −10,63 | 1,2722 | −0,0366 | |||
| ITW / Illinois Tool Works Inc. | 0,00 | 0,00 | 0,18 | −7,54 | 1,2642 | 0,0060 | |||
| XOM / Exxon Mobil Corporation | 0,00 | 0,00 | 0,18 | −1,09 | 1,2397 | 0,0845 | |||
| NFLX / Netflix, Inc. | 0,00 | 0,00 | 0,18 | 15,69 | 1,2160 | 0,2491 | |||
| DTE / DTE Energy Company | 0,00 | 0,00 | 0,18 | 14,19 | 1,2141 | 0,2353 | |||
| HLT / Hilton Worldwide Holdings Inc. | 0,00 | 0,00 | 0,17 | −11,92 | 1,1635 | −0,0539 | |||
| HD / The Home Depot, Inc. | 0,00 | 0,00 | 0,17 | −12,44 | 1,1595 | −0,0614 | |||
| PG / The Procter & Gamble Company | 0,00 | 0,00 | 0,17 | −2,33 | 1,1559 | 0,0685 | |||
| ABT / Abbott Laboratories | 0,00 | 0,00 | 0,17 | 1,82 | 1,1552 | 0,1138 | |||
| PM / Philip Morris International Inc. | 0,00 | 0,00 | 0,17 | 31,75 | 1,1399 | 0,3419 | |||
| BAC / Bank of America Corporation | 0,00 | 0,00 | 0,16 | −14,29 | 1,1149 | −0,0777 | |||
| LIN / Linde plc | 0,00 | 0,00 | 0,15 | 2,01 | 1,0422 | 0,0970 | |||
| ABBV / AbbVie Inc. | 0,00 | 0,00 | 0,15 | 5,59 | 1,0388 | 0,1367 | |||
| CSCO / Cisco Systems, Inc. | 0,00 | 0,00 | 0,15 | −5,03 | 1,0383 | 0,0341 | |||
| WMT / Walmart Inc. | 0,00 | 0,00 | 0,15 | −0,66 | 1,0336 | 0,0724 | |||
| WFC / Wells Fargo & Company | 0,00 | 0,00 | 0,15 | −9,82 | 1,0069 | −0,0226 | |||
| DOV / Dover Corporation | 0,00 | 0,00 | 0,14 | −16,57 | 0,9693 | −0,0966 | |||
| AXP / American Express Company | 0,00 | 0,00 | 0,13 | −16,25 | 0,9207 | −0,0901 | |||
| UNH / UnitedHealth Group Incorporated | 0,00 | 0,00 | 0,13 | −24,43 | 0,9151 | −0,1966 | |||
| MS / Morgan Stanley | 0,00 | 0,00 | 0,13 | −16,67 | 0,8918 | −0,0936 | |||
| GS / The Goldman Sachs Group, Inc. | 0,00 | 0,00 | 0,13 | −14,57 | 0,8881 | −0,0689 | |||
| BLK / BlackRock, Inc. | 0,00 | 0,00 | 0,13 | −15,23 | 0,8822 | −0,0739 | |||
| OXY / Occidental Petroleum Corporation | 0,00 | 0,00 | 0,13 | −15,79 | 0,8800 | −0,0797 | |||
| CVX / Chevron Corporation | 0,00 | 0,00 | 0,13 | −9,35 | 0,8687 | −0,0089 | |||
| T / AT&T Inc. | 0,00 | 0,00 | 0,12 | 16,35 | 0,8331 | 0,1756 | |||
| NVR / NVR, Inc. | 0,00 | 0,00 | 0,12 | −11,03 | 0,8290 | −0,0302 | |||
| PEP / PepsiCo, Inc. | 0,00 | 0,00 | 0,12 | −9,85 | 0,8174 | −0,0196 | |||
| GE / General Electric Company | 0,00 | 0,00 | 0,12 | −1,69 | 0,8000 | 0,0555 | |||
| PTC / PTC Inc. | 0,00 | 0,00 | 0,12 | −20,14 | 0,7933 | −0,1192 | |||
| VICI / VICI Properties Inc. | 0,00 | 0,00 | 0,11 | 7,62 | 0,7768 | 0,1114 | |||
| ISRG / Intuitive Surgical, Inc. | 0,00 | 0,00 | 0,11 | −9,60 | 0,7766 | −0,0167 | |||
| O / Realty Income Corporation | 0,00 | 0,00 | 0,11 | 5,71 | 0,7622 | 0,0990 | |||
| RTX / RTX Corporation | 0,00 | 0,00 | 0,11 | −2,65 | 0,7596 | 0,0441 | |||
| PGR / The Progressive Corporation | 0,00 | 0,00 | 0,11 | 13,54 | 0,7520 | 0,1460 | |||
| MCD / McDonald's Corporation | 0,00 | 0,00 | 0,11 | 11,34 | 0,7416 | 0,1245 | |||
| PLTR / Palantir Technologies Inc. | 0,00 | 0,00 | 0,10 | 45,07 | 0,7060 | 0,2530 | |||
| CRM / Salesforce, Inc. | 0,00 | 0,00 | 0,10 | −20,93 | 0,6988 | −0,1199 | |||
| PNC / The PNC Financial Services Group, Inc. | 0,00 | 0,00 | 0,10 | −20,49 | 0,6686 | −0,1017 | |||
| TMO / Thermo Fisher Scientific Inc. | 0,00 | 0,00 | 0,10 | −28,15 | 0,6664 | −0,1891 | |||
| BKNG / Booking Holdings Inc. | 0,00 | 0,00 | 0,10 | 6,67 | 0,6630 | 0,0955 | |||
| IBM / International Business Machines Corporation | 0,00 | 0,00 | 0,10 | −5,88 | 0,6603 | 0,0170 | |||
| NOW / ServiceNow, Inc. | 0,00 | 0,00 | 0,10 | −5,94 | 0,6536 | 0,0115 | |||
| CMCSA / Comcast Corporation | 0,00 | 0,00 | 0,10 | 2,15 | 0,6528 | 0,0608 | |||
| INTU / Intuit Inc. | 0,00 | 0,00 | 0,09 | 4,44 | 0,6484 | 0,0757 | |||
| IR / Ingersoll Rand Inc. | 0,00 | 0,00 | 0,09 | −19,66 | 0,6478 | −0,0944 | |||
| EQR / Equity Residential | 0,00 | 0,00 | 0,09 | −1,06 | 0,6400 | 0,0472 | |||
| QCOM / QUALCOMM Incorporated | 0,00 | 0,00 | 0,09 | −14,42 | 0,6157 | −0,0451 | |||
| AMAT / Applied Materials, Inc. | 0,00 | 0,00 | 0,09 | −16,04 | 0,6116 | −0,0627 | |||
| ELV / Elevance Health, Inc. | 0,00 | 0,00 | 0,09 | 7,23 | 0,6102 | 0,0813 | |||
| LOW / Lowe's Companies, Inc. | 0,00 | 0,00 | 0,09 | −14,00 | 0,5921 | −0,0424 | |||
| ETN / Eaton Corporation plc | 0,00 | 0,00 | 0,09 | −9,47 | 0,5903 | −0,0128 | |||
| CAT / Caterpillar Inc. | 0,00 | 0,00 | 0,08 | −17,17 | 0,5672 | −0,0604 | |||
| MRK / Merck & Co., Inc. | 0,00 | 0,00 | 0,08 | −13,83 | 0,5597 | −0,0384 | |||
| DIS / The Walt Disney Company | 0,00 | 0,00 | 0,08 | −19,80 | 0,5589 | −0,0812 | |||
| UBER / Uber Technologies, Inc. | 0,00 | 0,00 | 0,08 | 21,88 | 0,5389 | 0,1292 | |||
| ACN / Accenture plc | 0,00 | 0,00 | 0,08 | −22,77 | 0,5384 | −0,0999 | |||
| DHR / Danaher Corporation | 0,00 | 0,00 | 0,08 | −10,59 | 0,5266 | −0,0156 | |||
| AMGN / Amgen Inc. | 0,00 | 0,00 | 0,08 | 1,33 | 0,5256 | 0,0505 | |||
| PFE / Pfizer Inc. | 0,00 | 0,00 | 0,08 | −7,32 | 0,5220 | −0,0005 | |||
| ORCL / Oracle Corporation | 0,00 | 0,00 | 0,07 | −17,05 | 0,5008 | −0,0568 | |||
| UPS / United Parcel Service, Inc. | 0,00 | 0,00 | 0,07 | −16,28 | 0,4963 | −0,0518 | |||
| PLD / Prologis, Inc. | 0,00 | 0,00 | 0,07 | −14,29 | 0,4567 | −0,0343 | |||
| NEE / NextEra Energy, Inc. | 0,00 | 0,00 | 0,06 | −7,58 | 0,4238 | 0,0060 | |||
| AMD / Advanced Micro Devices, Inc. | 0,00 | 0,00 | 0,06 | −15,28 | 0,4184 | −0,0407 | |||
| ADBE / Adobe Inc. | 0,00 | 0,00 | 0,06 | −14,08 | 0,4183 | −0,0313 | |||
| CRWD / CrowdStrike Holdings, Inc. | 0,00 | 0,00 | 0,05 | 8,89 | 0,3375 | 0,0489 | |||
| MU / Micron Technology, Inc. | 0,00 | 0,00 | 0,04 | −14,89 | 0,2754 | −0,0255 | |||
| SBUX / Starbucks Corporation | 0,00 | 0,00 | 0,04 | −25,49 | 0,2619 | −0,0627 | |||
| INTC / Intel Corporation | 0,00 | 0,00 | 0,04 | 2,86 | 0,2510 | 0,0275 | |||
| GVMXX / State Street Institutional Investment Trust - State Street Institutional US Govt Money Market Fnd Premier Cls | 0,00 | 0,00 | 0,00 | 0,0005 | 0,0000 | ||||
| HLT US C 257.41 / DE (000000000) | 0,00 | 0,0000 | 0,0000 | ||||||
| CSCO US C 64.73 / DE (000000000) | 0,00 | 0,0000 | 0,0000 | ||||||
| JPM US C 272.79 / DE (000000000) | 0,00 | 0,0000 | 0,0000 | ||||||
| TSLA US C 380.5 / DE (000000000) | 0,00 | 0,0000 | 0,0000 | ||||||
| AMZN US C 225.37 / DE (000000000) | 0,00 | 0,0000 | 0,0000 | ||||||
| AVGO US C 210.39 / DE (000000000) | 0,00 | −0,0000 | −0,0000 | ||||||
| NVDA US C 133.87 / DE (000000000) | 0,00 | −0,0000 | −0,0000 | ||||||
| JPM US C 285.66 / DE (000000000) | 0,00 | −0,0000 | −0,0000 | ||||||
| GOOG US C 186.91 / DE (000000000) | 0,00 | −0,0000 | −0,0000 | ||||||
| ITW US C 270.63 / DE (000000000) | 0,00 | 0,0000 | 0,0000 | ||||||
| CVX US C 173.54 / DE (000000000) | −0,00 | −0,0000 | −0,0000 | ||||||
| HD US C 414.99 / DE (000000000) | −0,00 | −0,0000 | −0,0000 | ||||||
| AAPL US C 240.67 / DE (000000000) | −0,00 | −0,0000 | −0,0000 | ||||||
| ITW US C 271.02 / DE (000000000) | −0,00 | −0,0000 | −0,0000 | ||||||
| HLT US C 261.86 / DE (000000000) | −0,00 | −0,0001 | −0,0001 | ||||||
| ABT US C 145.56 / DE (000000000) | −0,00 | −0,0001 | −0,0001 | ||||||
| PG US C 177.03 / DE (000000000) | −0,00 | −0,0001 | −0,0001 | ||||||
| LIN US C 516.88 / DE (000000000) | −0,00 | −0,0001 | −0,0001 | ||||||
| V US C 379.3 / DE (000000000) | −0,00 | −0,0001 | −0,0001 | ||||||
| ABBV US C 217.68 / DE (000000000) | −0,00 | −0,0002 | −0,0002 | ||||||
| BRKB US C 584.5 / DE (000000000) | −0,00 | −0,0002 | −0,0002 | ||||||
| MA US C 601.3 / DE (000000000) | −0,00 | −0,0003 | −0,0003 | ||||||
| WFC US C 81.13 / DE (000000000) | −0,00 | −0,0003 | −0,0003 | ||||||
| TSLA US C 413.25 / DE (000000000) | −0,00 | −0,0003 | −0,0003 | ||||||
| AVGO US C 237.01 / DE (000000000) | −0,00 | −0,0003 | −0,0003 | ||||||
| GOOG US C 198.2 / DE (000000000) | −0,00 | −0,0004 | −0,0004 | ||||||
| META US C 742.76 / DE (000000000) | −0,00 | −0,0004 | −0,0004 | ||||||
| MSFT US C 454.22 / DE (000000000) | −0,00 | −0,0004 | −0,0004 | ||||||
| AMZN US C 237.29 / DE (000000000) | −0,00 | −0,0005 | −0,0005 | ||||||
| MSFT US C 422.81 / DE (000000000) | −0,00 | −0,0006 | −0,0006 | ||||||
| SRE US C 75.7 / DE (000000000) | −0,00 | −0,0006 | −0,0006 | ||||||
| AAPL US C 244.37 / DE (000000000) | −0,00 | −0,0013 | −0,0013 | ||||||
| SRE US C 80.03 / DE (000000000) | −0,00 | −0,0018 | −0,0018 | ||||||
| DTE US C 145.27 / DE (000000000) | −0,00 | −0,0024 | −0,0024 | ||||||
| PM US C 172.78 / DE (000000000) | −0,00 | −0,0064 | −0,0064 | ||||||
| WMT US C 91.89 / DE (000000000) | −0,00 | −0,0110 | −0,0110 |