Grundläggande statistik
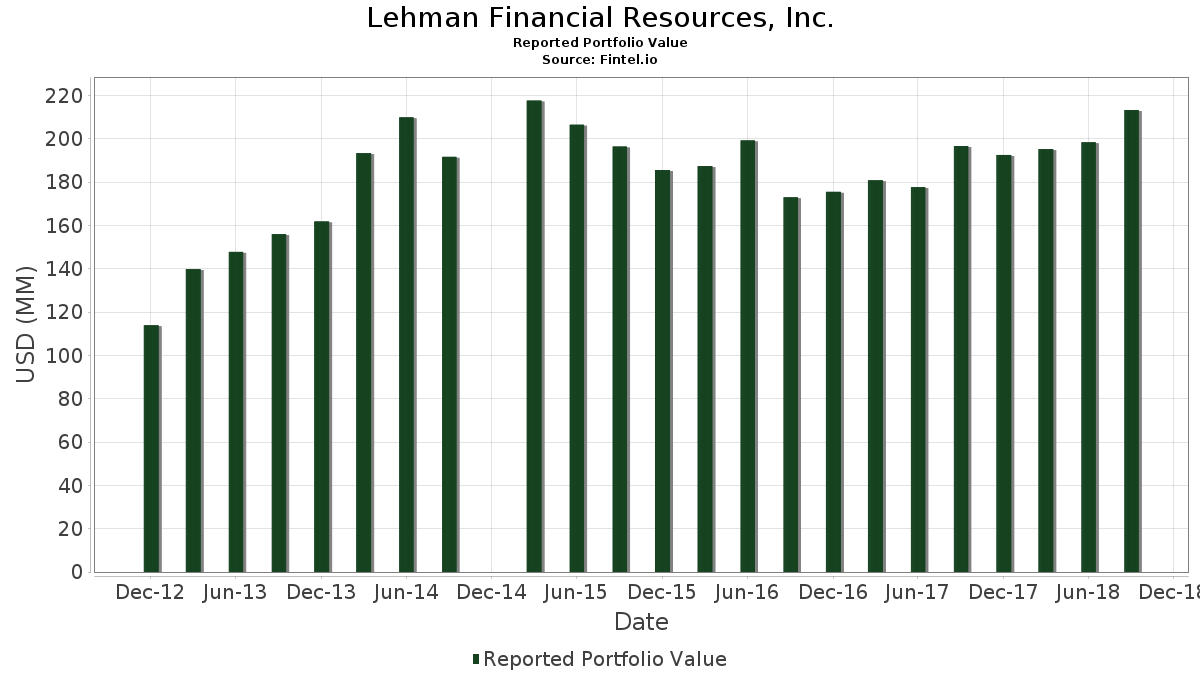
| Portföljvärde | $ 213 268 000 |
| Aktuella positioner | 103 |
Senaste innehav, resultat, förvaltat kapital (från 13F, 13D)
Lehman Financial Resources, Inc. har redovisat 103 totala innehav i sina senaste SEC-arkiveringar. Det senaste portföljvärdet beräknas vara $ 213 268 000 USD. Faktiskt förvaltade tillgångar (AUM) är detta värde plus likvida medel (som inte redovisas). Lehman Financial Resources, Inc.s största innehav är NextEra Energy, Inc. (US:NEE) , XPLR Infrastructure, LP - Limited Partnership (US:NEP) , Berkshire Hathaway Inc. (US:BRK.B) , iShares Trust - iShares Core S&P 500 ETF (US:IVV) , and Pfizer Inc. (US:PFE) . Lehman Financial Resources, Inc.s nya positioner inkluderar Fidelity Covington Trust - Fidelity Dividend ETF for Rising Rates (US:FDRR) , Advanced Micro Devices, Inc. (US:AMD) , iShares Trust - iShares U.S. Equity Factor ETF (US:LRGF) , Caesars Entertainment, Inc. (US:CZR) , and .
Största ökningarna detta kvartal
Vi använder förändringen i portföljallokeringen eftersom det är det mest meningsfulla måttet. Förändringar kan bero på transaktioner eller förändringar i aktiekurser.
| Värdepapper | Aktier (MM) |
Värde (MM$) |
Portfölj % av | ΔPortfölj % av |
|---|---|---|---|---|
| 0,45 | 21,83 | 10,2355 | 10,2355 | |
| 0,03 | 9,53 | 4,4704 | 4,4704 | |
| 0,07 | 5,56 | 2,6061 | 2,6061 | |
| 0,05 | 4,18 | 1,9581 | 1,9581 | |
| 0,06 | 2,84 | 1,3312 | 1,3312 | |
| 0,10 | 2,42 | 1,1333 | 1,1333 | |
| 0,02 | 1,66 | 0,7765 | 0,7765 | |
| 0,01 | 1,44 | 0,6761 | 0,6761 | |
| 0,02 | 1,31 | 0,6138 | 0,6138 | |
| 0,01 | 1,28 | 0,6011 | 0,6011 |
Största minskningarna detta kvartal
Vi använder förändringen i portföljallokeringen eftersom det är det mest meningsfulla måttet. Förändringar kan bero på transaktioner eller förändringar i aktiepriser.
| Värdepapper | Aktier (MM) |
Värde (MM$) |
Portfölj % av | ΔPortfölj % av |
|---|---|---|---|---|
| 0,29 | 48,32 | 22,6551 | −1,0453 | |
| 0,05 | 0,19 | 0,0886 | −0,4800 | |
| 0,06 | 2,18 | 1,0208 | −0,2636 | |
| 0,17 | 1,91 | 0,8937 | −0,2500 | |
| 0,13 | 5,86 | 2,7496 | −0,2486 | |
| 0,06 | 4,30 | 2,0167 | −0,2188 | |
| 0,29 | 8,48 | 3,9767 | −0,1995 | |
| 0,13 | 5,80 | 2,7205 | −0,1829 | |
| 0,03 | 4,21 | 1,9759 | −0,1775 | |
| 0,14 | 2,98 | 1,3982 | −0,1664 |
13F- och fond arkiveringar
Denna blankett lämnades in den 2018-11-14 för rapporteringsperioden 2018-09-30. Klicka på länksymbolen för att se hela transaktionshistoriken.
Uppgradera för att låsa upp premiumdata och exportera till Excel![]() .
.
| Värdepapper | Typ | Genomsnittligt aktiepris | Aktier (MM) |
ΔAktier (%) |
ΔAktier (%) |
Värde ($MM) |
Portfölj (%) |
ΔPortfölj (%) |
|
|---|---|---|---|---|---|---|---|---|---|
| NEE / NextEra Energy, Inc. | 0,29 | 2,41 | 48,32 | 2,76 | 22,6551 | −1,0453 | |||
| NEP / XPLR Infrastructure, LP - Limited Partnership | 0,45 | 2,27 | 21,83 | 6,29 | 10,2355 | 10,2355 | |||
| BRK.B / Berkshire Hathaway Inc. | 0,05 | 0,22 | 9,94 | 14,96 | 4,6594 | 0,3022 | |||
| IVV / iShares Trust - iShares Core S&P 500 ETF | 0,03 | 0,00 | 9,53 | 7,21 | 4,4704 | 4,4704 | |||
| PFE / Pfizer Inc. | 0,20 | −1,64 | 8,70 | 19,48 | 4,0775 | 0,4089 | |||
| BAC / Bank of America Corporation | 0,29 | −2,04 | 8,48 | 2,37 | 3,9767 | −0,1995 | |||
| KBE / SPDR Series Trust - SPDR S&P Bank ETF | 0,13 | −0,16 | 5,86 | −1,41 | 2,7496 | −0,2486 | |||
| CSCO / Cisco Systems, Inc. | 0,12 | 1,76 | 5,85 | 15,06 | 2,7449 | 0,1802 | |||
| BP / BP p.l.c. - Depositary Receipt (Common Stock) | 0,13 | −0,23 | 5,80 | 0,73 | 2,7205 | −0,1829 | |||
| VT / Vanguard International Equity Index Funds - Vanguard Total World Stock ETF | 0,07 | 0,00 | 5,56 | 3,35 | 2,6061 | 2,6061 | |||
| MMP / Magellan Midstream Partners L.P. | 0,06 | −1,09 | 4,30 | −3,02 | 2,0167 | −0,2188 | |||
| CVX / Chevron Corporation | 0,03 | 2,00 | 4,21 | −1,36 | 1,9759 | −0,1775 | |||
| IJR / iShares Trust - iShares Core S&P Small-Cap ETF | 0,05 | 577,68 | 4,18 | 609,00 | 1,9581 | 1,9581 | |||
| BTZ / BlackRock Credit Allocation Income Trust | 0,31 | 0,01 | 3,78 | 1,34 | 1,7719 | −0,1077 | |||
| UPS / United Parcel Service, Inc. | 0,03 | 1,29 | 3,66 | 11,33 | 1,7180 | 0,0591 | |||
| MRK / Merck & Co., Inc. | 0,05 | 2,49 | 3,42 | 19,76 | 1,6060 | 0,1643 | |||
| O / Realty Income Corporation | 0,06 | −3,77 | 3,20 | 1,78 | 1,4991 | −0,0842 | |||
| BTT / Blackrock Municipal 2030 Target Term Trust | 0,14 | 0,00 | 2,98 | −3,93 | 1,3982 | −0,1664 | |||
| TOTL / SSGA Active Trust - SPDR DoubleLine Total Return Tactical ETF | 0,06 | 0,00 | 2,84 | −0,63 | 1,3312 | 1,3312 | |||
| EPD / Enterprise Products Partners L.P. - Limited Partnership | 0,09 | −1,95 | 2,60 | 1,80 | 1,2196 | −0,0683 | |||
| PCI / PGIM ETF Trust - PGIM Corporate Bond 5-10 Year ETF | 0,10 | −0,98 | 2,42 | 1,34 | 1,1333 | 1,1333 | |||
| GM / General Motors Company | 0,06 | 0,00 | 2,18 | −14,56 | 1,0208 | −0,2636 | |||
| GE / General Electric Company | 0,17 | 1,24 | 1,91 | −16,00 | 0,8937 | −0,2500 | |||
| / BlackRock Municipal 2020 Term Trust | 0,13 | 0,00 | 1,89 | −1,72 | 0,8857 | −0,0831 | |||
| GILD / Gilead Sciences, Inc. | 0,02 | 0,70 | 1,68 | 9,76 | 0,7854 | 0,0162 | |||
| HDV / iShares Trust - iShares Core High Dividend ETF | 0,02 | −2,28 | 1,66 | 4,09 | 0,7765 | 0,7765 | |||
| JNJ / Johnson & Johnson | 0,01 | 2,92 | 1,60 | 17,22 | 0,7502 | 0,0622 | |||
| AAPL / Apple Inc. | 0,01 | 34,09 | 1,55 | 63,58 | 0,7287 | 0,2498 | |||
| IBB / iShares Trust - iShares Biotechnology ETF | 0,01 | 1,52 | 1,44 | 12,74 | 0,6761 | 0,6761 | |||
| SCHD / Schwab Strategic Trust - Schwab U.S. Dividend Equity ETF | 0,02 | −2,74 | 1,31 | 4,64 | 0,6138 | 0,6138 | |||
| VDE / Vanguard World Fund - Vanguard Energy ETF | 0,01 | 0,00 | 1,28 | 0,08 | 0,6011 | 0,6011 | |||
| SRPT / Sarepta Therapeutics, Inc. | 0,01 | 0,00 | 1,04 | 22,21 | 0,4876 | 0,0587 | |||
| XOM / Exxon Mobil Corporation | 0,01 | 28,63 | 0,96 | 32,19 | 0,4506 | 0,0841 | |||
| DUK / Duke Energy Corporation | 0,01 | 1,71 | 0,95 | 2,91 | 0,4473 | −0,0199 | |||
| GDX / VanEck ETF Trust - VanEck Gold Miners ETF | 0,05 | −1,36 | 0,94 | −18,19 | 0,4408 | 0,4408 | |||
| SLV / iShares Silver Trust | 0,07 | 0,00 | 0,90 | −9,37 | 0,4215 | −0,0785 | |||
| AMZN / Amazon.com, Inc. | 0,00 | 43,62 | 0,86 | 69,37 | 0,4018 | 0,1468 | |||
| T / AT&T Inc. | 0,02 | 20,96 | 0,77 | 26,48 | 0,3606 | 0,0541 | |||
| EXC / Exelon Corporation | 0,02 | −1,43 | 0,75 | 1,07 | 0,3535 | −0,0225 | |||
| LHX / L3Harris Technologies, Inc. | 0,00 | 0,00 | 0,75 | 17,03 | 0,3512 | 0,0286 | |||
| PG / The Procter & Gamble Company | 0,01 | 13,28 | 0,75 | 20,65 | 0,3507 | 0,0382 | |||
| V / Visa Inc. | 0,00 | 1,19 | 0,71 | 14,63 | 0,3343 | 0,0208 | |||
| GG / Goldcorp, Inc. | 0,06 | −1,23 | 0,65 | −26,60 | 0,3067 | −0,1425 | |||
| F / Ford Motor Company | 0,07 | −3,03 | 0,65 | −18,95 | 0,3048 | −0,0995 | |||
| AABA / Altaba Inc | 0,01 | 216,67 | 0,65 | 195,43 | 0,3034 | 0,1930 | |||
| VEU / Vanguard International Equity Index Funds - Vanguard FTSE All-World ex-US ETF | 0,01 | −75,16 | 0,64 | −73,78 | 0,2987 | 0,2987 | |||
| GLD / SPDR Gold Trust | 0,01 | 0,00 | 0,61 | −4,95 | 0,2884 | −0,0378 | |||
| SPY / SPDR S&P 500 ETF | 0,00 | 1,05 | 0,61 | 8,29 | 0,2879 | 0,0021 | |||
| VZ / Verizon Communications Inc. | 0,01 | 34,09 | 0,61 | 42,29 | 0,2856 | 0,0698 | |||
| BA / The Boeing Company | 0,00 | 43,98 | 0,58 | 59,67 | 0,2710 | 0,0885 | |||
| META / Meta Platforms, Inc. | 0,00 | 0,87 | 0,57 | −14,54 | 0,2673 | −0,0689 | |||
| MSFT / Microsoft Corporation | 0,00 | 36,62 | 0,55 | 58,29 | 0,2598 | 0,0833 | |||
| VOD / Vodafone Group Public Limited Company - Depositary Receipt (Common Stock) | 0,03 | 0,00 | 0,55 | −10,73 | 0,2574 | −0,0526 | |||
| DIS / The Walt Disney Company | 0,00 | 30,41 | 0,54 | 45,68 | 0,2527 | 0,0662 | |||
| EEM / iShares, Inc. - iShares MSCI Emerging Markets ETF | 0,01 | 1,63 | 0,45 | 0,45 | 0,2091 | −0,0147 | |||
| C / Citigroup Inc. | 0,01 | 13,57 | 0,42 | 21,74 | 0,1969 | 0,0230 | |||
| CCT / Comcast Corporation - Preferred Security | 0,03 | 0,00 | 0,40 | −2,19 | 0,1885 | −0,0187 | |||
| COP / ConocoPhillips | 0,01 | 42,92 | 0,40 | 58,96 | 0,1871 | 0,0606 | |||
| WFC / Wells Fargo & Company | 0,01 | 0,00 | 0,40 | −5,26 | 0,1857 | −0,0250 | |||
| PKW / Invesco Exchange-Traded Fund Trust - Invesco BuyBack Achievers ETF | 0,01 | 0,00 | 0,39 | 7,50 | 0,1815 | −0,0000 | |||
| AEP / American Electric Power Company, Inc. | 0,01 | 0,04 | 0,37 | 2,48 | 0,1744 | −0,0085 | |||
| HD / The Home Depot, Inc. | 0,00 | 6,35 | 0,35 | 13,03 | 0,1627 | 0,0080 | |||
| UNP / Union Pacific Corporation | 0,00 | 7,35 | 0,34 | 23,47 | 0,1604 | 0,0207 | |||
| IBM / International Business Machines Corporation | 0,00 | 2 149,00 | 0,34 | 1 689,47 | 0,1594 | 0,1594 | |||
| DIA / SPDR Dow Jones Industrial Average ETF Trust | 0,00 | 0,00 | 0,34 | 9,03 | 0,1585 | 0,0022 | |||
| EMR / Emerson Electric Co. | 0,00 | 44,67 | 0,33 | 60,00 | 0,1538 | 0,0505 | |||
| FDRR / Fidelity Covington Trust - Fidelity Dividend ETF for Rising Rates | 0,01 | 0,32 | 0,1505 | 0,1505 | |||||
| DOW / Dow Inc. | 0,00 | 40,03 | 0,31 | 36,44 | 0,1440 | 0,0305 | |||
| ORCL / Oracle Corporation | 0,01 | 72,24 | 0,30 | 132,03 | 0,1393 | 0,1393 | |||
| ED / Consolidated Edison, Inc. | 0,00 | 0,00 | 0,28 | −2,40 | 0,1336 | −0,0136 | |||
| INTC / Intel Corporation | 0,01 | 26,12 | 0,28 | 20,25 | 0,1336 | 0,0142 | |||
| WTRG / Essential Utilities, Inc. | 0,01 | 8,55 | 0,28 | 14,23 | 0,1318 | 0,0078 | |||
| MO / Altria Group, Inc. | 0,00 | 9,53 | 0,28 | 16,25 | 0,1308 | 0,0098 | |||
| VTIAX / Vanguard Star Funds - Vanguard Total International Stock Index Fund Admiral | 0,01 | 0,00 | 0,28 | 0,00 | 0,1289 | 0,1289 | |||
| VYM / Vanguard Whitehall Funds - Vanguard High Dividend Yield ETF | 0,00 | 0,00 | 0,27 | 4,71 | 0,1252 | 0,1252 | |||
| RDS.A / Shell Plc - ADR (Representing Ordinary Shares - Class A) | 0,00 | 0,00 | 0,26 | −2,24 | 0,1229 | −0,0122 | |||
| CAT / Caterpillar Inc. | 0,00 | 0,26 | 0,1214 | 0,1214 | |||||
| NSC / Norfolk Southern Corporation | 0,00 | 0,00 | 0,26 | 19,44 | 0,1210 | 0,0121 | |||
| AMGN / Amgen Inc. | 0,00 | 301,67 | 0,25 | 492,86 | 0,1168 | 0,1168 | |||
| GLW / Corning Incorporated | 0,01 | 3 031,70 | 0,25 | 6 075,00 | 0,1158 | 0,1158 | |||
| ONVO / Organovo Holdings, Inc. | 0,21 | 16,54 | 0,24 | −4,30 | 0,1149 | −0,0142 | |||
| BMY / Bristol-Myers Squibb Company | 0,00 | 5,11 | 0,24 | 18,36 | 0,1149 | 0,0105 | |||
| WMT / Walmart Inc. | 0,00 | 8,32 | 0,24 | 19,02 | 0,1144 | 0,0111 | |||
| AMD / Advanced Micro Devices, Inc. | 0,01 | 0,24 | 0,1111 | 0,1111 | |||||
| COST / Costco Wholesale Corporation | 0,00 | 405,00 | 0,24 | 848,00 | 0,1111 | 0,1111 | |||
| GOOGL / Alphabet Inc. | 0,00 | 0,24 | 0,1111 | 0,1111 | |||||
| LVS / Las Vegas Sands Corp. | 0,00 | 0,23 | 0,1055 | 0,1055 | |||||
| MCD / McDonald's Corporation | 0,00 | 645,00 | 0,22 | 1 217,65 | 0,1050 | 0,1050 | |||
| INTF / iShares Trust - iShares International Equity Factor ETF | 0,01 | 0,00 | 0,22 | 1,36 | 0,1050 | −0,0064 | |||
| WASH / Washington Trust Bancorp, Inc. | 0,00 | −9,09 | 0,22 | 52,41 | 0,1036 | 0,1036 | |||
| KMB / Kimberly-Clark Corporation | 0,00 | 0,16 | 0,22 | 8,37 | 0,1032 | 0,0008 | |||
| USB / U.S. Bancorp | 0,00 | 0,22 | 0,1027 | 0,1027 | |||||
| PEP / PepsiCo, Inc. | 0,00 | 147,15 | 0,22 | 198,63 | 0,1022 | 0,1022 | |||
| JPM / JPMorgan Chase & Co. | 0,00 | −68,03 | 0,21 | −40,06 | 0,0989 | 0,0989 | |||
| LRGF / iShares Trust - iShares U.S. Equity Factor ETF | 0,01 | 0,20 | 0,0942 | 0,0942 | |||||
| OPK / OPKO Health, Inc. | 0,05 | −77,17 | 0,19 | −83,24 | 0,0886 | −0,4800 | |||
| SGYPQ / SYNERGY PHARMACEUTICALS INC DEL | 0,10 | 17,95 | 0,16 | 15,71 | 0,0760 | 0,0054 | |||
| IAU / iShares Gold Trust | 0,01 | 0,00 | 0,12 | −5,34 | 0,0581 | −0,0079 | |||
| CZR / Caesars Entertainment, Inc. | 0,01 | 0,12 | 0,0577 | 0,0577 | |||||
| FSK / FS KKR Capital Corp. | 0,02 | −2,87 | 0,11 | −7,56 | 0,0516 | 0,0516 | |||
| SIRI / Sirius XM Holdings Inc. | 0,02 | 0,00 | 0,10 | −6,54 | 0,0469 | −0,0070 | |||
| US6706871026 / Nuveen Municipal 2021 Trgt Trm | 0,01 | 0,00 | 0,10 | 0,00 | 0,0460 | 0,0460 | |||
| VISL / Vislink Technologies, Inc. | 0,02 | 36,54 | 0,01 | −10,00 | 0,0042 | −0,0008 | |||
| TSM / Taiwan Semiconductor Manufacturing Company Limited - Depositary Receipt (Common Stock) | 0,00 | −100,00 | 0,00 | −100,00 | −0,1270 | ||||
| HBI / Hanesbrands Inc. | 0,00 | −100,00 | 0,00 | −100,00 | 0,0000 | 0,0000 |