Grundläggande statistik
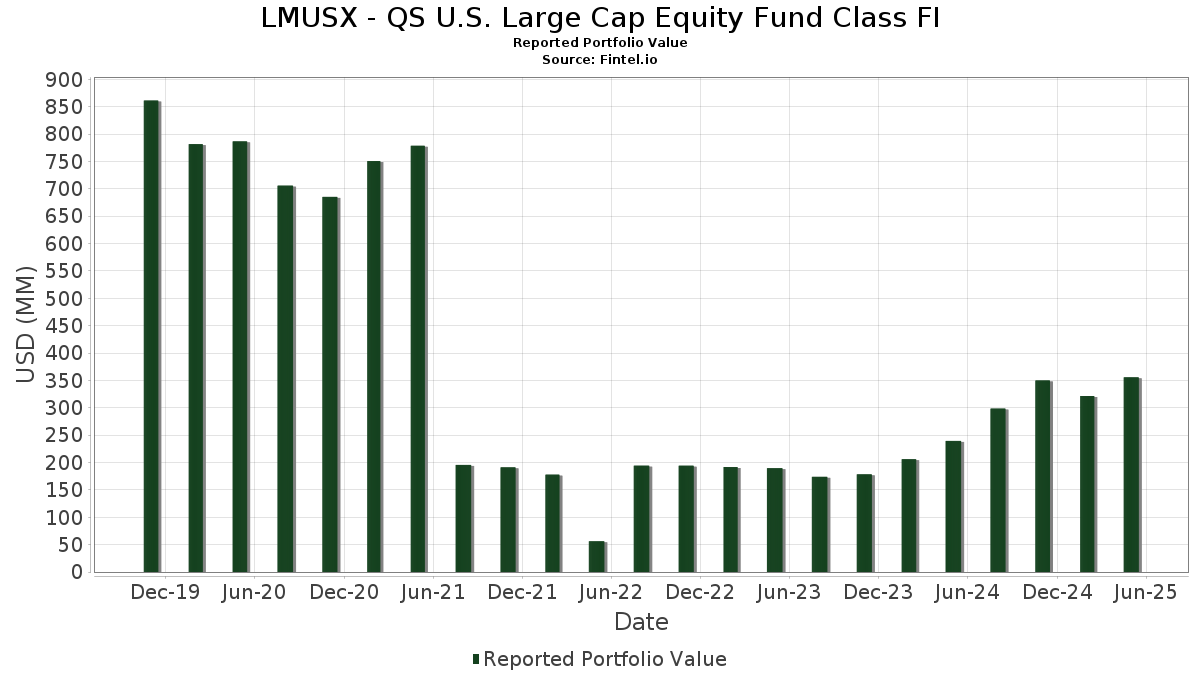
| Portföljvärde | $ 355 606 511 |
| Aktuella positioner | 119 |
Senaste innehav, resultat, förvaltat kapital (från 13F, 13D)
LMUSX - QS U.S. Large Cap Equity Fund Class FI har redovisat 119 totala innehav i sina senaste SEC-arkiveringar. Det senaste portföljvärdet beräknas vara $ 355 606 511 USD. Faktiskt förvaltade tillgångar (AUM) är detta värde plus likvida medel (som inte redovisas). LMUSX - QS U.S. Large Cap Equity Fund Class FIs största innehav är NVIDIA Corporation (US:NVDA) , Microsoft Corporation (US:MSFT) , Apple Inc. (US:AAPL) , Amazon.com, Inc. (US:AMZN) , and Meta Platforms, Inc. (US:META) . LMUSX - QS U.S. Large Cap Equity Fund Class FIs nya positioner inkluderar Abbott Laboratories (US:ABT) , GS Connect S&P GSCI Enhanced Commodity Total Return ETN (US:GSCE) , Uber Technologies, Inc. (US:UBER) , Medtronic plc (US:MDT) , and VeriSign, Inc. (US:VRSN) .
Största ökningarna detta kvartal
Vi använder förändringen i portföljallokeringen eftersom det är det mest meningsfulla måttet. Förändringar kan bero på transaktioner eller förändringar i aktiekurser.
| Värdepapper | Aktier (MM) |
Värde (MM$) |
Portfölj % av | ΔPortfölj % av |
|---|---|---|---|---|
| 0,05 | 23,32 | 6,5567 | 0,9515 | |
| 0,02 | 7,83 | 2,2017 | 0,9385 | |
| 0,02 | 3,22 | 0,9058 | 0,9058 | |
| 0,00 | 3,00 | 0,8436 | 0,8436 | |
| 0,03 | 2,57 | 0,7232 | 0,7232 | |
| 0,03 | 2,25 | 0,6326 | 0,6326 | |
| 0,17 | 23,42 | 6,5844 | 0,5503 | |
| 0,05 | 3,38 | 0,9515 | 0,5103 | |
| 0,01 | 1,78 | 0,5005 | 0,5005 | |
| 0,01 | 1,65 | 0,4648 | 0,4648 |
Största minskningarna detta kvartal
Vi använder förändringen i portföljallokeringen eftersom det är det mest meningsfulla måttet. Förändringar kan bero på transaktioner eller förändringar i aktiepriser.
| Värdepapper | Aktier (MM) |
Värde (MM$) |
Portfölj % av | ΔPortfölj % av |
|---|---|---|---|---|
| 0,10 | 20,63 | 5,7994 | −1,1229 | |
| 0,00 | 0,00 | −0,7274 | ||
| 0,00 | 0,00 | −0,5301 | ||
| 0,00 | 2,20 | 0,6179 | −0,5096 | |
| 0,02 | 0,81 | 0,2281 | −0,4755 | |
| 0,01 | 1,11 | 0,3107 | −0,4490 | |
| 0,00 | 0,70 | 0,1981 | −0,3388 | |
| 0,03 | 1,50 | 0,4228 | −0,2440 | |
| 0,01 | 1,58 | 0,4437 | −0,2139 | |
| 0,00 | 3,10 | 0,8721 | −0,2136 |
13F- och fond arkiveringar
Denna blankett lämnades in den 2025-07-23 för rapporteringsperioden 2025-05-30. Klicka på länksymbolen för att se hela transaktionshistoriken.
Uppgradera för att låsa upp premiumdata och exportera till Excel![]() .
.
| Värdepapper | Typ | Genomsnittligt aktiepris | Aktier (MM) |
ΔAktier (%) |
ΔAktier (%) |
Värde ($MM) |
Portfölj (%) |
ΔPortfölj (%) |
|
|---|---|---|---|---|---|---|---|---|---|
| NVDA / NVIDIA Corporation | 0,17 | 11,57 | 23,42 | 20,69 | 6,5844 | 0,5503 | |||
| MSFT / Microsoft Corporation | 0,05 | 11,57 | 23,32 | 29,38 | 6,5567 | 0,9515 | |||
| AAPL / Apple Inc. | 0,10 | 11,57 | 20,63 | −7,34 | 5,7994 | −1,1229 | |||
| AMZN / Amazon.com, Inc. | 0,06 | 11,57 | 11,88 | 7,75 | 3,3393 | −0,0884 | |||
| META / Meta Platforms, Inc. | 0,02 | 11,56 | 11,60 | 8,11 | 3,2626 | −0,0755 | |||
| GOOGL / Alphabet Inc. | 0,05 | 11,57 | 8,34 | 12,53 | 2,3436 | 0,0401 | |||
| BRK.B / Berkshire Hathaway Inc. | 0,02 | 96,56 | 7,83 | 92,81 | 2,2017 | 0,9385 | |||
| GOOG / Alphabet Inc. | 0,04 | 11,57 | 7,30 | 11,99 | 2,0534 | 0,0253 | |||
| NFLX / Netflix, Inc. | 0,00 | 3,32 | 6,01 | 27,20 | 1,6887 | 0,2204 | |||
| AVGO / Broadcom Inc. | 0,02 | 11,58 | 5,66 | 35,42 | 1,5910 | 0,2917 | |||
| MA / Mastercard Incorporated | 0,01 | 11,57 | 5,13 | 13,36 | 1,4432 | 0,0352 | |||
| WMT / Walmart Inc. | 0,05 | 4,57 | 5,07 | 4,68 | 1,4265 | −0,0806 | |||
| JPM / JPMorgan Chase & Co. | 0,02 | 11,57 | 5,06 | 11,30 | 1,4239 | 0,0089 | |||
| ABBV / AbbVie Inc. | 0,02 | 11,57 | 4,34 | −0,64 | 1,2205 | −0,1384 | |||
| GE / General Electric Company | 0,02 | 11,58 | 4,18 | 32,54 | 1,1764 | 0,1949 | |||
| TSLA / Tesla, Inc. | 0,01 | −16,56 | 4,14 | −1,34 | 1,1635 | −0,1408 | |||
| PG / The Procter & Gamble Company | 0,02 | 11,57 | 3,84 | 9,02 | 1,0805 | −0,0155 | |||
| WFC / Wells Fargo & Company | 0,05 | 11,57 | 3,39 | 6,50 | 0,9537 | −0,0365 | |||
| CSCO / Cisco Systems, Inc. | 0,05 | 136,22 | 3,38 | 220,36 | 0,9515 | 0,5103 | |||
| ABT / Abbott Laboratories | 0,02 | 3,22 | 0,9058 | 0,9058 | |||||
| BKNG / Booking Holdings Inc. | 0,00 | −19,25 | 3,10 | −11,17 | 0,8721 | −0,2136 | |||
| GSCE / GS Connect S&P GSCI Enhanced Commodity Total Return ETN | 0,00 | 3,00 | 0,8436 | 0,8436 | |||||
| T / AT&T Inc. | 0,10 | 11,57 | 2,89 | 13,14 | 0,8113 | 0,0183 | |||
| MO / Altria Group, Inc. | 0,05 | 11,57 | 2,83 | 21,07 | 0,7950 | 0,0688 | |||
| GILD / Gilead Sciences, Inc. | 0,03 | 11,57 | 2,79 | 7,42 | 0,7856 | −0,0231 | |||
| COST / Costco Wholesale Corporation | 0,00 | −1,57 | 2,75 | −2,35 | 0,7724 | −0,1025 | |||
| BK / The Bank of New York Mellon Corporation | 0,03 | −1,20 | 2,74 | −1,58 | 0,7692 | −0,0952 | |||
| US8252524066 / Invesco Treasury Portfolio, Institutional Class | 2,70 | 116,00 | 2,70 | 116,09 | 0,7590 | 0,3704 | |||
| C / Citigroup Inc. - Corporate Bond/Note | 0,04 | 11,58 | 2,67 | 5,08 | 0,7501 | −0,0392 | |||
| ADBE / Adobe Inc. | 0,01 | 11,55 | 2,64 | 5,60 | 0,7418 | −0,0353 | |||
| QCOM / QUALCOMM Incorporated | 0,02 | 11,58 | 2,62 | 3,07 | 0,7365 | −0,0538 | |||
| TJX / The TJX Companies, Inc. | 0,02 | 11,58 | 2,60 | 13,47 | 0,7298 | 0,0186 | |||
| UGI / UGI Corporation | 0,07 | 11,58 | 2,59 | 17,76 | 0,7290 | 0,0444 | |||
| UBER / Uber Technologies, Inc. | 0,03 | 2,57 | 0,7232 | 0,7232 | |||||
| KR / The Kroger Co. | 0,04 | 11,57 | 2,56 | 17,41 | 0,7209 | 0,0420 | |||
| EME / EMCOR Group, Inc. | 0,01 | 11,54 | 2,56 | 28,74 | 0,7204 | 0,1014 | |||
| EXEL / Exelixis, Inc. | 0,06 | −2,89 | 2,56 | 8,03 | 0,7186 | −0,0171 | |||
| LOW / Lowe's Companies, Inc. | 0,01 | 11,57 | 2,53 | 1,28 | 0,7116 | −0,0654 | |||
| ALSN / Allison Transmission Holdings, Inc. | 0,02 | 11,58 | 2,49 | 13,52 | 0,7010 | 0,0180 | |||
| MMM / 3M Company | 0,02 | 11,57 | 2,49 | 6,72 | 0,7008 | −0,0256 | |||
| NOW / ServiceNow, Inc. | 0,00 | 11,56 | 2,45 | 21,31 | 0,6885 | 0,0608 | |||
| BMY / Bristol-Myers Squibb Company | 0,05 | 11,57 | 2,42 | −9,63 | 0,6804 | −0,1525 | |||
| V / Visa Inc. | 0,01 | 11,56 | 2,42 | 12,37 | 0,6796 | 0,0104 | |||
| MCK / McKesson Corporation | 0,00 | −21,90 | 2,38 | 0,13 | 0,6688 | −0,1266 | |||
| AMAT / Applied Materials, Inc. | 0,02 | 11,57 | 2,38 | 10,67 | 0,6681 | 0,0002 | |||
| GM / General Motors Company | 0,05 | 11,57 | 2,36 | 12,64 | 0,6643 | 0,0121 | |||
| JNJ / Johnson & Johnson | 0,02 | 11,57 | 2,35 | 4,95 | 0,6615 | −0,0357 | |||
| R / Ryder System, Inc. | 0,02 | 11,58 | 2,33 | −0,17 | 0,6546 | −0,0708 | |||
| APP / AppLovin Corporation | 0,01 | −16,82 | 2,31 | 0,35 | 0,6507 | −0,0665 | |||
| DBX / Dropbox, Inc. | 0,08 | 11,57 | 2,28 | 24,01 | 0,6405 | 0,0689 | |||
| MDT / Medtronic plc | 0,03 | 2,25 | 0,6326 | 0,6326 | |||||
| ORI / Old Republic International Corporation | 0,06 | −2,46 | 2,25 | −4,26 | 0,6322 | −0,0982 | |||
| PLTR / Palantir Technologies Inc. | 0,02 | 11,58 | 2,21 | 73,12 | 0,6212 | 0,2244 | |||
| DOCU / DocuSign, Inc. | 0,02 | 11,58 | 2,20 | 18,85 | 0,6187 | 0,0431 | |||
| LLY / Eli Lilly and Company | 0,00 | −24,35 | 2,20 | −39,39 | 0,6179 | −0,5096 | |||
| CF / CF Industries Holdings, Inc. | 0,02 | 58,25 | 2,19 | 77,20 | 0,6165 | 0,2317 | |||
| PYPL / PayPal Holdings, Inc. | 0,03 | 11,57 | 2,19 | 10,38 | 0,6159 | −0,0014 | |||
| UTHR / United Therapeutics Corporation | 0,01 | 11,58 | 2,16 | 11,21 | 0,6079 | 0,0031 | |||
| LMT / Lockheed Martin Corporation | 0,00 | 11,54 | 2,16 | 19,49 | 0,6069 | 0,0450 | |||
| LNG / Cheniere Energy, Inc. | 0,01 | 11,58 | 2,15 | 15,75 | 0,6054 | 0,0267 | |||
| INGR / Ingredion Incorporated | 0,02 | 11,58 | 2,14 | 18,85 | 0,6031 | 0,0418 | |||
| HD / The Home Depot, Inc. | 0,01 | 35,25 | 2,13 | 25,58 | 0,5979 | 0,0714 | |||
| NRG / NRG Energy, Inc. | 0,01 | 11,58 | 2,12 | 64,54 | 0,5950 | 0,1951 | |||
| NEM / Newmont Corporation | 0,04 | 184,26 | 2,10 | 158,69 | 0,5899 | 0,1750 | |||
| CL / Colgate-Palmolive Company | 0,02 | 11,57 | 2,02 | 13,75 | 0,5674 | 0,0156 | |||
| EOG / EOG Resources, Inc. | 0,02 | 11,58 | 2,01 | −4,56 | 0,5648 | −0,0898 | |||
| MTG / MGIC Investment Corporation | 0,08 | 11,57 | 1,99 | 19,94 | 0,5600 | 0,0435 | |||
| PEGA / Pegasystems Inc. | 0,02 | 11,57 | 1,99 | 39,58 | 0,5592 | 0,1158 | |||
| FICO / Fair Isaac Corporation | 0,00 | 11,56 | 1,98 | 2,06 | 0,5572 | −0,0464 | |||
| IDXX / IDEXX Laboratories, Inc. | 0,00 | 11,51 | 1,93 | 31,03 | 0,5427 | 0,0844 | |||
| LDOS / Leidos Holdings, Inc. | 0,01 | 11,58 | 1,92 | 27,46 | 0,5392 | 0,0715 | |||
| GAP / The Gap, Inc. | 0,09 | 11,57 | 1,90 | 10,10 | 0,5334 | −0,0025 | |||
| EBAY / eBay Inc. | 0,03 | 11,57 | 1,86 | 26,12 | 0,5228 | 0,0643 | |||
| AMGN / Amgen Inc. | 0,01 | 69,55 | 1,84 | 58,58 | 0,5169 | 0,1565 | |||
| VIRT / Virtu Financial, Inc. | 0,05 | −20,09 | 1,83 | −12,18 | 0,5153 | −0,1335 | |||
| VRSN / VeriSign, Inc. | 0,01 | 1,78 | 0,5005 | 0,5005 | |||||
| CSL / Carlisle Companies Incorporated | 0,00 | 11,55 | 1,76 | 24,50 | 0,4944 | 0,0550 | |||
| GEN / Gen Digital Inc. | 0,06 | 11,58 | 1,73 | 16,34 | 0,4864 | 0,0237 | |||
| FAST / Fastenal Company | 0,04 | 123,15 | 1,70 | 21,82 | 0,4790 | 0,0441 | |||
| UAL / United Airlines Holdings, Inc. | 0,02 | 100,12 | 1,70 | 69,49 | 0,4782 | 0,1661 | |||
| KO / The Coca-Cola Company | 0,02 | 11,57 | 1,69 | 13,00 | 0,4742 | 0,0099 | |||
| AGO / Assured Guaranty Ltd. | 0,02 | 11,58 | 1,67 | 8,04 | 0,4686 | −0,0112 | |||
| COR / Cencora, Inc. | 0,01 | 1,65 | 0,4648 | 0,4648 | |||||
| SEIC / SEI Investments Company | 0,02 | 11,57 | 1,64 | 18,84 | 0,4613 | 0,0319 | |||
| CROX / Crocs, Inc. | 0,02 | 1,61 | 0,4533 | 0,4533 | |||||
| TWLO / Twilio Inc. | 0,01 | −23,96 | 1,58 | −25,35 | 0,4437 | −0,2139 | |||
| CRUS / Cirrus Logic, Inc. | 0,02 | 11,57 | 1,57 | 5,35 | 0,4426 | −0,0222 | |||
| VICI / VICI Properties Inc. | 0,05 | 1,52 | 0,4277 | 0,4277 | |||||
| PPC / Pilgrim's Pride Corporation | 0,03 | −87,96 | 1,50 | −71,38 | 0,4228 | −0,2440 | |||
| 35G / Genpact Limited | 0,03 | 1,50 | 0,4216 | 0,4216 | |||||
| EA / Electronic Arts Inc. | 0,01 | −15,20 | 1,49 | −5,64 | 0,4192 | −0,0718 | |||
| RNG / RingCentral, Inc. | 0,06 | 11,57 | 1,45 | 1,68 | 0,4087 | −0,0358 | |||
| STLD / Steel Dynamics, Inc. | 0,01 | −13,67 | 1,44 | −21,36 | 0,4059 | −0,1648 | |||
| ZM / Zoom Communications Inc. | 0,02 | 11,58 | 1,40 | 22,98 | 0,3944 | 0,0398 | |||
| FR / First Industrial Realty Trust, Inc. | 0,03 | 11,57 | 1,40 | −3,39 | 0,3929 | −0,0569 | |||
| PVH / PVH Corp. | 0,02 | 11,58 | 1,40 | 24,96 | 0,3928 | 0,0449 | |||
| OVV / Ovintiv Inc. | 0,04 | 1,39 | 0,3921 | 0,3921 | |||||
| XOM / Exxon Mobil Corporation | 0,01 | 11,57 | 1,36 | 2,57 | 0,3821 | −0,0301 | |||
| JAZZ / Jazz Pharmaceuticals plc | 0,01 | 65,82 | 1,36 | 50,78 | 0,3817 | −0,0556 | |||
| TAP / Molson Coors Beverage Company | 0,03 | 11,57 | 1,35 | −2,45 | 0,3802 | −0,0509 | |||
| UNM / Unum Group | 0,02 | 11,57 | 1,34 | 10,78 | 0,3758 | 0,0006 | |||
| STT / State Street Corporation | 0,01 | 11,58 | 1,24 | 8,20 | 0,3489 | −0,0076 | |||
| WU / The Western Union Company | 0,13 | 11,58 | 1,23 | −4,44 | 0,3452 | −0,0542 | |||
| AXS / AXIS Capital Holdings Limited | 0,01 | 11,58 | 1,22 | 19,55 | 0,3441 | 0,0258 | |||
| BSX / Boston Scientific Corporation | 0,01 | 11,58 | 1,22 | 13,15 | 0,3437 | 0,0078 | |||
| RS / Reliance, Inc. | 0,00 | 1,19 | 0,3357 | 0,3357 | |||||
| CMCSA / Comcast Corporation | 0,03 | 11,57 | 1,17 | 7,52 | 0,3300 | −0,0095 | |||
| KMB / Kimberly-Clark Corporation | 0,01 | 1,15 | 0,3241 | 0,3241 | |||||
| TPR / Tapestry, Inc. | 0,01 | 1,14 | 0,3217 | 0,3217 | |||||
| LRCX / Lam Research Corporation | 0,01 | 395,08 | 1,11 | −51,28 | 0,3107 | −0,4490 | |||
| UNH / UnitedHealth Group Incorporated | 0,00 | 11,53 | 1,09 | −29,10 | 0,3064 | −0,1716 | |||
| DXC / DXC Technology Company | 0,07 | 11,57 | 1,04 | −7,67 | 0,2911 | −0,0577 | |||
| ULTA / Ulta Beauty, Inc. | 0,00 | −26,87 | 0,98 | −5,93 | 0,2767 | −0,0485 | |||
| REGN / Regeneron Pharmaceuticals, Inc. | 0,00 | 11,49 | 0,91 | −21,77 | 0,2568 | −0,1063 | |||
| BLDR / Builders FirstSource, Inc. | 0,01 | 11,58 | 0,90 | −13,56 | 0,2528 | −0,0706 | |||
| BAC / Bank of America Corporation | 0,02 | 11,57 | 0,86 | 6,87 | 0,2408 | −0,0086 | |||
| SMG / The Scotts Miracle-Gro Company | 0,01 | −41,24 | 0,82 | −40,28 | 0,2299 | −0,1957 | |||
| DOCS / Doximity, Inc. | 0,02 | −51,46 | 0,81 | −64,15 | 0,2281 | −0,4755 | |||
| MEDP / Medpace Holdings, Inc. | 0,00 | −54,70 | 0,70 | −59,21 | 0,1981 | −0,3388 | |||
| OC / Owens Corning | 0,00 | −100,00 | 0,00 | −100,00 | −0,5301 | ||||
| SPG / Simon Property Group, Inc. | 0,00 | −100,00 | 0,00 | −100,00 | −0,7274 |