Grundläggande statistik
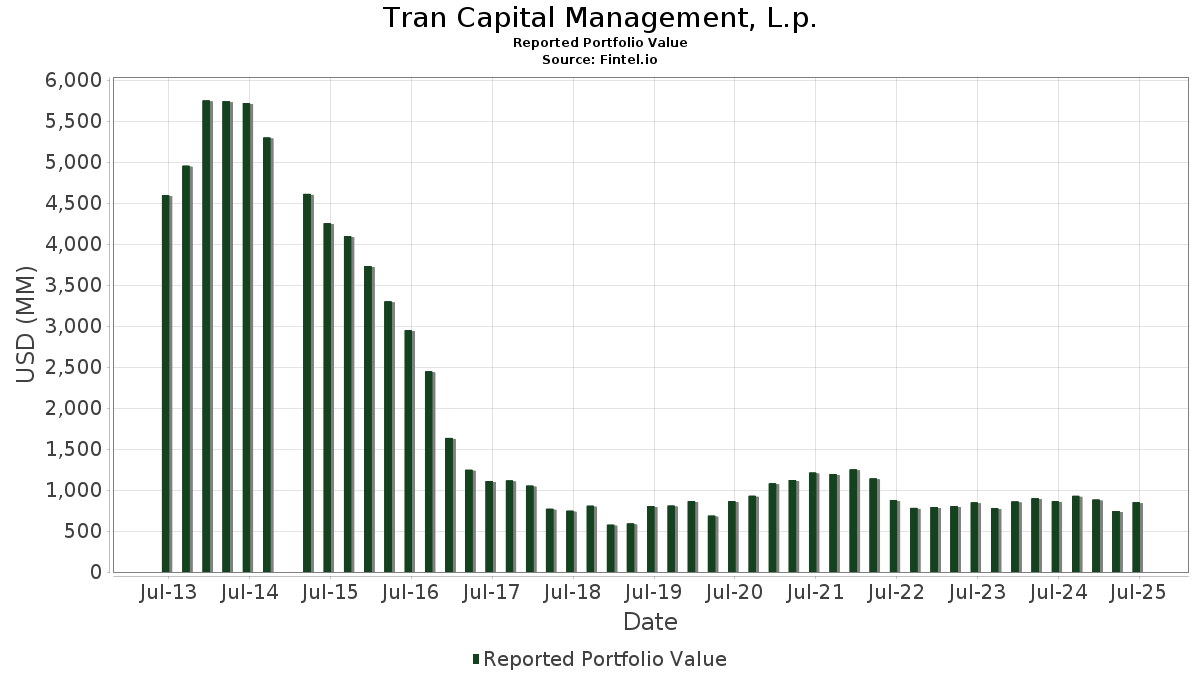
| Portföljvärde | $ 849 591 825 |
| Aktuella positioner | 68 |
Senaste innehav, resultat, förvaltat kapital (från 13F, 13D)
Tran Capital Management, L.p. har redovisat 68 totala innehav i sina senaste SEC-arkiveringar. Det senaste portföljvärdet beräknas vara $ 849 591 825 USD. Faktiskt förvaltade tillgångar (AUM) är detta värde plus likvida medel (som inte redovisas). Tran Capital Management, L.p.s största innehav är Microsoft Corporation (US:MSFT) , Amazon.com, Inc. (US:AMZN) , NVIDIA Corporation (US:NVDA) , Talen Energy Corporation (US:TLN) , and Meta Platforms, Inc. (US:META) . Tran Capital Management, L.p.s nya positioner inkluderar Capital One Financial Corporation (IT:1COF) , Tenet Healthcare Corporation (US:THC) , LPL Financial Holdings Inc. (US:LPLA) , Markel Group Inc. (US:MKL) , and .
Största ökningarna detta kvartal
Vi använder förändringen i portföljallokeringen eftersom det är det mest meningsfulla måttet. Förändringar kan bero på transaktioner eller förändringar i aktiekurser.
| Värdepapper | Aktier (MM) |
Värde (MM$) |
Portfölj % av | ΔPortfölj % av |
|---|---|---|---|---|
| 0,01 | 19,18 | 2,2573 | 1,9523 | |
| 0,04 | 14,32 | 1,6856 | 1,6856 | |
| 0,06 | 31,34 | 3,6890 | 1,5563 | |
| 0,06 | 13,11 | 1,5433 | 1,5433 | |
| 0,38 | 60,56 | 7,1277 | 1,4151 | |
| 0,01 | 17,39 | 2,0472 | 1,2786 | |
| 0,13 | 65,95 | 7,7627 | 0,9629 | |
| 0,20 | 43,37 | 5,1048 | 0,7441 | |
| 0,04 | 6,24 | 0,7341 | 0,7341 | |
| 0,06 | 44,91 | 5,2866 | 0,4947 |
Största minskningarna detta kvartal
Vi använder förändringen i portföljallokeringen eftersom det är det mest meningsfulla måttet. Förändringar kan bero på transaktioner eller förändringar i aktiepriser.
| Värdepapper | Aktier (MM) |
Värde (MM$) |
Portfölj % av | ΔPortfölj % av |
|---|---|---|---|---|
| 0,00 | 0,39 | 0,0463 | −2,4031 | |
| 0,01 | 0,74 | 0,0876 | −1,2219 | |
| 0,18 | 35,99 | 4,2361 | −1,0184 | |
| 0,11 | 26,00 | 3,0603 | −0,9023 | |
| 0,13 | 30,56 | 3,5969 | −0,6183 | |
| 0,05 | 8,86 | 1,0430 | −0,4023 | |
| 0,09 | 25,12 | 2,9572 | −0,3987 | |
| 0,29 | 23,00 | 2,7077 | −0,3703 | |
| 0,04 | 11,83 | 1,3923 | −0,3134 | |
| 0,03 | 10,92 | 1,2850 | −0,2327 |
13F- och fond arkiveringar
Denna blankett lämnades in den 2025-07-14 för rapporteringsperioden 2025-06-30. Klicka på länksymbolen för att se hela transaktionshistoriken.
Uppgradera för att låsa upp premiumdata och exportera till Excel![]() .
.
| Värdepapper | Typ | Genomsnittligt aktiepris | Aktier (MM) |
ΔAktier (%) |
ΔAktier (%) |
Värde ($MM) |
Portfölj (%) |
ΔPortfölj (%) |
|
|---|---|---|---|---|---|---|---|---|---|
| MSFT / Microsoft Corporation | 0,13 | −1,52 | 65,95 | 30,49 | 7,7627 | 0,9629 | |||
| AMZN / Amazon.com, Inc. | 0,29 | −1,57 | 64,12 | 13,50 | 7,5477 | −0,0535 | |||
| NVDA / NVIDIA Corporation | 0,38 | −2,17 | 60,56 | 42,62 | 7,1277 | 1,4151 | |||
| TLN / Talen Energy Corporation | 0,20 | −23,74 | 59,19 | 11,06 | 6,9668 | −0,2038 | |||
| META / Meta Platforms, Inc. | 0,06 | −1,53 | 44,91 | 26,10 | 5,2866 | 0,4947 | |||
| FERG / Ferguson Enterprises Inc. | 0,20 | −1,54 | 43,37 | 33,81 | 5,1048 | 0,7441 | |||
| PANW / Palo Alto Networks, Inc. | 0,19 | −1,31 | 38,25 | 18,36 | 4,5025 | 0,1543 | |||
| DHR / Danaher Corporation | 0,18 | −4,37 | 35,99 | −7,85 | 4,2361 | −1,0184 | |||
| INTU / Intuit Inc. | 0,04 | −0,83 | 32,37 | 27,21 | 3,8104 | 0,3867 | |||
| MLM / Martin Marietta Materials, Inc. | 0,06 | 4,84 | 32,01 | 20,38 | 3,7676 | 0,1900 | |||
| GEV / GE Vernova Inc. | 0,06 | 14,07 | 31,34 | 97,72 | 3,6890 | 1,5563 | |||
| TSM / Taiwan Semiconductor Manufacturing Company Limited - Depositary Receipt (Common Stock) | 0,13 | −28,51 | 30,56 | −2,46 | 3,5969 | −0,6183 | |||
| VEEV / Veeva Systems Inc. | 0,10 | −0,56 | 27,56 | 23,63 | 3,2444 | 0,2447 | |||
| TMUS / T-Mobile US, Inc. | 0,11 | −1,19 | 26,00 | −11,73 | 3,0603 | −0,9023 | |||
| CRM / Salesforce, Inc. | 0,09 | −0,88 | 25,12 | 0,72 | 2,9572 | −0,3987 | |||
| CSGP / CoStar Group, Inc. | 0,29 | −0,91 | 23,00 | 0,55 | 2,7077 | −0,3703 | |||
| FICO / Fair Isaac Corporation | 0,01 | 753,62 | 19,18 | 746,29 | 2,2573 | 1,9523 | |||
| GTLB / GitLab Inc. | 0,41 | 28,34 | 18,33 | 23,18 | 2,1570 | 0,1555 | |||
| GOOGL / Alphabet Inc. | 0,10 | −1,69 | 17,68 | 12,03 | 2,0812 | −0,0422 | |||
| NFLX / Netflix, Inc. | 0,01 | 112,01 | 17,39 | 204,48 | 2,0472 | 1,2786 | |||
| SCHW / The Charles Schwab Corporation | 0,17 | −7,22 | 15,10 | 8,14 | 1,7777 | −0,1013 | |||
| ELV / Elevance Health, Inc. | 0,04 | 14,32 | 1,6856 | 1,6856 | |||||
| 1COF / Capital One Financial Corporation | 0,06 | 13,11 | 1,5433 | 1,5433 | |||||
| PGR / The Progressive Corporation | 0,04 | −1,05 | 11,83 | −6,70 | 1,3923 | −0,3134 | |||
| SHW / The Sherwin-Williams Company | 0,03 | −1,58 | 10,92 | −3,23 | 1,2850 | −0,2327 | |||
| NKE / NIKE, Inc. | 0,13 | 27,69 | 9,05 | 42,89 | 1,0656 | 0,2132 | |||
| AER / AerCap Holdings N.V. | 0,08 | −0,91 | 8,93 | 13,47 | 1,0510 | −0,0077 | |||
| EXPE / Expedia Group, Inc. | 0,05 | −17,80 | 8,86 | −17,51 | 1,0430 | −0,4023 | |||
| APD / Air Products and Chemicals, Inc. | 0,03 | −2,65 | 8,16 | −6,90 | 0,9600 | −0,2185 | |||
| THC / Tenet Healthcare Corporation | 0,04 | 6,24 | 0,7341 | 0,7341 | |||||
| ACN / Accenture plc | 0,01 | −3,78 | 3,57 | −7,82 | 0,4204 | −0,1009 | |||
| GGG / Graco Inc. | 0,02 | −13,24 | 2,00 | −10,67 | 0,2355 | −0,0659 | |||
| AAPL / Apple Inc. | 0,01 | −0,39 | 1,89 | −8,01 | 0,2230 | −0,0540 | |||
| EXR / Extra Space Storage Inc. | 0,01 | 0,00 | 1,76 | −0,68 | 0,2067 | −0,0312 | |||
| KEYS / Keysight Technologies, Inc. | 0,01 | −8,90 | 1,32 | −0,30 | 0,1550 | −0,0228 | |||
| ADP / Automatic Data Processing, Inc. | 0,00 | 0,00 | 1,21 | 1,00 | 0,1425 | −0,0189 | |||
| PAYX / Paychex, Inc. | 0,01 | 0,00 | 1,15 | −5,67 | 0,1350 | −0,0287 | |||
| SPY / SPDR S&P 500 ETF | 0,00 | 0,00 | 1,12 | 10,45 | 0,1318 | −0,0046 | |||
| NTAP / NetApp, Inc. | 0,01 | 0,00 | 1,08 | 21,28 | 0,1275 | 0,0074 | |||
| TSLA / Tesla, Inc. | 0,00 | 0,00 | 1,01 | 22,71 | 0,1183 | 0,0080 | |||
| LPLA / LPL Financial Holdings Inc. | 0,00 | 0,96 | 0,1127 | 0,1127 | |||||
| LHX / L3Harris Technologies, Inc. | 0,00 | 0,00 | 0,89 | 19,76 | 0,1043 | 0,0048 | |||
| LLY / Eli Lilly and Company | 0,00 | 0,00 | 0,88 | −5,60 | 0,1033 | −0,0218 | |||
| AFL / Aflac Incorporated | 0,01 | 0,00 | 0,84 | −5,17 | 0,0993 | −0,0204 | |||
| TXN / Texas Instruments Incorporated | 0,00 | 0,00 | 0,78 | 15,49 | 0,0923 | 0,0010 | |||
| ENTG / Entegris, Inc. | 0,01 | −91,70 | 0,74 | −92,36 | 0,0876 | −1,2219 | |||
| DIS / The Walt Disney Company | 0,01 | 0,00 | 0,72 | 25,57 | 0,0845 | 0,0076 | |||
| EEM / iShares, Inc. - iShares MSCI Emerging Markets ETF | 0,01 | 7,09 | 0,64 | 18,17 | 0,0759 | 0,0025 | |||
| CSCO / Cisco Systems, Inc. | 0,01 | 0,00 | 0,59 | 12,40 | 0,0694 | −0,0012 | |||
| AMD / Advanced Micro Devices, Inc. | 0,00 | −2,52 | 0,55 | 34,56 | 0,0647 | 0,0098 | |||
| MKL / Markel Group Inc. | 0,00 | 0,54 | 0,0637 | 0,0637 | |||||
| SCHP / Schwab Strategic Trust - Schwab U.S. TIPS ETF | 0,02 | 0,00 | 0,49 | −0,81 | 0,0574 | −0,0087 | |||
| SCHR / Schwab Strategic Trust - Schwab Intermediate-Term U.S. Treasury ETF | 0,02 | 0,00 | 0,48 | 0,63 | 0,0569 | −0,0077 | |||
| RSP / Invesco Exchange-Traded Fund Trust - Invesco S&P 500 Equal Weight ETF | 0,00 | 0,00 | 0,47 | 4,97 | 0,0548 | −0,0049 | |||
| XYZ / Block, Inc. | 0,01 | 0,00 | 0,46 | 25,07 | 0,0541 | 0,0046 | |||
| IEFA / iShares Trust - iShares Core MSCI EAFE ETF | 0,01 | 15,30 | 0,46 | 27,37 | 0,0537 | 0,0055 | |||
| IWM / iShares Trust - iShares Russell 2000 ETF | 0,00 | 0,05 | 0,45 | 8,41 | 0,0531 | −0,0030 | |||
| VMBS / Vanguard Scottsdale Funds - Vanguard Mortgage-Backed Securities ETF | 0,01 | 0,00 | 0,39 | 0,25 | 0,0464 | −0,0066 | |||
| BLDR / Builders FirstSource, Inc. | 0,00 | −97,69 | 0,39 | −97,84 | 0,0463 | −2,4031 | |||
| IEF / iShares Trust - iShares 7-10 Year Treasury Bond ETF | 0,00 | 0,00 | 0,33 | 0,30 | 0,0389 | −0,0054 | |||
| BFB / Brown-Forman Corp. - Class B | 0,01 | 0,00 | 0,31 | −20,66 | 0,0367 | −0,0162 | |||
| HD / The Home Depot, Inc. | 0,00 | 0,00 | 0,28 | 0,00 | 0,0333 | −0,0047 | |||
| AHR / American Healthcare REIT, Inc. | 0,01 | 0,00 | 0,27 | 21,62 | 0,0318 | 0,0018 | |||
| JNJ / Johnson & Johnson | 0,00 | 0,00 | 0,24 | −7,92 | 0,0288 | −0,0069 | |||
| BRK.A / Berkshire Hathaway Inc. | 0,00 | 0,00 | 0,24 | −9,02 | 0,0286 | −0,0072 | |||
| JPM / JPMorgan Chase & Co. | 0,00 | 0,23 | 0,0273 | 0,0273 | |||||
| PFF / iShares Trust - iShares Preferred and Income Securities ETF | 0,01 | 0,00 | 0,22 | 0,00 | 0,0257 | −0,0037 | |||
| TECH / Bio-Techne Corporation | 0,00 | 0,00 | 0,21 | −12,39 | 0,0242 | −0,0073 | |||
| IQV / IQVIA Holdings Inc. | 0,00 | −100,00 | 0,00 | 0,0000 | |||||
| JEF / Jefferies Financial Group Inc. | 0,00 | −100,00 | 0,00 | 0,0000 | |||||
| ELF / e.l.f. Beauty, Inc. | 0,00 | −100,00 | 0,00 | 0,0000 |