Grundläggande statistik
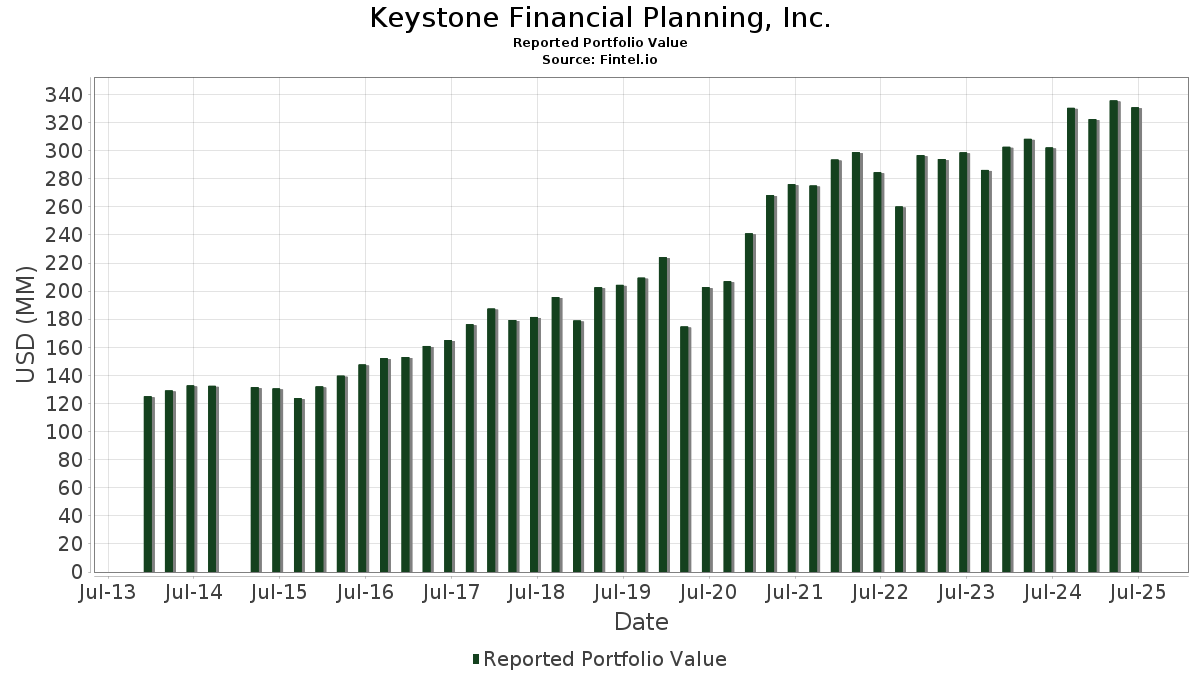
| Portföljvärde | $ 330 787 974 |
| Aktuella positioner | 45 |
Senaste innehav, resultat, förvaltat kapital (från 13F, 13D)
Keystone Financial Planning, Inc. har redovisat 45 totala innehav i sina senaste SEC-arkiveringar. Det senaste portföljvärdet beräknas vara $ 330 787 974 USD. Faktiskt förvaltade tillgångar (AUM) är detta värde plus likvida medel (som inte redovisas). Keystone Financial Planning, Inc.s största innehav är Schwab Strategic Trust - Schwab U.S. Dividend Equity ETF (US:SCHD) , Microsoft Corporation (US:MSFT) , Verizon Communications Inc. (US:VZ) , U.S. Bancorp (US:USB) , and GSK plc - Depositary Receipt (Common Stock) (US:GSK) .
Största ökningarna detta kvartal
Vi använder förändringen i portföljallokeringen eftersom det är det mest meningsfulla måttet. Förändringar kan bero på transaktioner eller förändringar i aktiekurser.
| Värdepapper | Aktier (MM) |
Värde (MM$) |
Portfölj % av | ΔPortfölj % av |
|---|---|---|---|---|
| 6,34 | 168,08 | 50,8118 | 5,0931 | |
| 0,03 | 13,37 | 4,0424 | 0,9424 | |
| 0,12 | 8,73 | 2,6379 | 0,5196 | |
| 0,14 | 7,73 | 2,3383 | 0,3754 | |
| 0,17 | 8,12 | 2,4556 | 0,3264 | |
| 0,23 | 10,35 | 3,1303 | 0,2497 | |
| 0,11 | 2,52 | 0,7622 | 0,1428 | |
| 0,03 | 4,65 | 1,4060 | 0,1418 | |
| 0,07 | 6,84 | 2,0663 | 0,1276 | |
| 0,05 | 3,47 | 1,0498 | 0,1124 |
Största minskningarna detta kvartal
Vi använder förändringen i portföljallokeringen eftersom det är det mest meningsfulla måttet. Förändringar kan bero på transaktioner eller förändringar i aktiepriser.
| Värdepapper | Aktier (MM) |
Värde (MM$) |
Portfölj % av | ΔPortfölj % av |
|---|---|---|---|---|
| 0,01 | 1,19 | 0,3612 | −1,9481 | |
| 0,07 | 2,16 | 0,6541 | −1,6676 | |
| 0,16 | 7,51 | 2,2705 | −0,6306 | |
| 0,02 | 3,55 | 1,0726 | −0,1913 | |
| 0,00 | 0,29 | 0,0880 | −0,1819 | |
| 0,05 | 5,28 | 1,5969 | −0,1704 | |
| 0,25 | 10,64 | 3,2155 | −0,1220 | |
| 0,05 | 4,77 | 1,4419 | −0,1065 | |
| 0,25 | 6,18 | 1,8676 | −0,0665 | |
| 0,20 | 8,36 | 2,5267 | −0,0651 |
13F- och fond arkiveringar
Denna blankett lämnades in den 2025-07-31 för rapporteringsperioden 2025-06-30. Klicka på länksymbolen för att se hela transaktionshistoriken.
Uppgradera för att låsa upp premiumdata och exportera till Excel![]() .
.
| Värdepapper | Typ | Genomsnittligt aktiepris | Aktier (MM) |
ΔAktier (%) |
ΔAktier (%) |
Värde ($MM) |
Portfölj (%) |
ΔPortfölj (%) |
|
|---|---|---|---|---|---|---|---|---|---|
| SCHD / Schwab Strategic Trust - Schwab U.S. Dividend Equity ETF | 6,34 | 15,57 | 168,08 | 9,53 | 50,8118 | 5,0931 | |||
| MSFT / Microsoft Corporation | 0,03 | −3,02 | 13,37 | 28,52 | 4,0424 | 0,9424 | |||
| VZ / Verizon Communications Inc. | 0,25 | −0,46 | 10,64 | −5,05 | 3,2155 | −0,1220 | |||
| USB / U.S. Bancorp | 0,23 | −0,08 | 10,35 | 7,10 | 3,1303 | 0,2497 | |||
| GSK / GSK plc - Depositary Receipt (Common Stock) | 0,23 | 0,10 | 8,80 | −0,78 | 2,6597 | 0,0179 | |||
| TD / The Toronto-Dominion Bank | 0,12 | 0,15 | 8,73 | 22,73 | 2,6379 | 0,5196 | |||
| SPYD / SPDR Series Trust - SPDR Portfolio S&P 500 High Dividend ETF | 0,20 | 0,20 | 8,36 | −3,93 | 2,5267 | −0,0651 | |||
| BTI / British American Tobacco p.l.c. - Depositary Receipt (Common Stock) | 0,17 | −0,65 | 8,12 | 13,66 | 2,4556 | 0,3264 | |||
| BNS / The Bank of Nova Scotia | 0,14 | 0,75 | 7,73 | 17,40 | 2,3383 | 0,3754 | |||
| BMY / Bristol-Myers Squibb Company | 0,16 | 1,62 | 7,51 | −22,87 | 2,2705 | −0,6306 | |||
| TROW / T. Rowe Price Group, Inc. | 0,07 | 0,00 | 6,84 | 5,04 | 2,0663 | 0,1276 | |||
| MO / Altria Group, Inc. | 0,11 | 0,00 | 6,43 | −2,31 | 1,9442 | −0,0173 | |||
| PFE / Pfizer Inc. | 0,25 | −0,52 | 6,18 | −4,84 | 1,8676 | −0,0665 | |||
| XOM / Exxon Mobil Corporation | 0,05 | −1,75 | 5,28 | −10,94 | 1,5969 | −0,1704 | |||
| UPS / United Parcel Service, Inc. | 0,05 | 0,00 | 4,77 | −8,24 | 1,4419 | −0,1065 | |||
| PM / Philip Morris International Inc. | 0,03 | −4,47 | 4,65 | 9,59 | 1,4060 | 0,1418 | |||
| QCOM / QUALCOMM Incorporated | 0,03 | −1,41 | 4,20 | 2,22 | 1,2693 | 0,0455 | |||
| CVX / Chevron Corporation | 0,02 | −2,29 | 3,55 | −16,38 | 1,0726 | −0,1913 | |||
| HDV / iShares Trust - iShares Core High Dividend ETF | 0,03 | −3,20 | 3,53 | −6,36 | 1,0677 | −0,0560 | |||
| CSCO / Cisco Systems, Inc. | 0,05 | −1,83 | 3,47 | 10,36 | 1,0498 | 0,1124 | |||
| KO / The Coca-Cola Company | 0,04 | −2,38 | 2,56 | −3,58 | 0,7742 | −0,0170 | |||
| GPC / Genuine Parts Company | 0,02 | −5,20 | 2,55 | −3,48 | 0,7720 | −0,0162 | |||
| IBM / International Business Machines Corporation | 0,01 | −4,44 | 2,53 | 13,31 | 0,7642 | 0,0994 | |||
| BEN / Franklin Resources, Inc. | 0,11 | −2,11 | 2,52 | 21,32 | 0,7622 | 0,1428 | |||
| MCD / McDonald's Corporation | 0,01 | 0,00 | 2,50 | −6,47 | 0,7561 | −0,0406 | |||
| HLN / Haleon plc - Depositary Receipt (Common Stock) | 0,22 | −0,56 | 2,32 | 0,22 | 0,7011 | 0,0116 | |||
| T / AT&T Inc. | 0,07 | −72,87 | 2,16 | −72,24 | 0,6541 | −1,6676 | |||
| JNJ / Johnson & Johnson | 0,01 | −3,64 | 1,47 | −11,28 | 0,4450 | −0,0491 | |||
| PG / The Procter & Gamble Company | 0,01 | 0,00 | 1,44 | −6,51 | 0,4345 | −0,0235 | |||
| SOLV / Solventum Corporation | 0,02 | −0,03 | 1,28 | −0,31 | 0,3866 | 0,0045 | |||
| PNW / Pinnacle West Capital Corporation | 0,01 | −83,59 | 1,19 | −84,60 | 0,3612 | −1,9481 | |||
| SNY / Sanofi - Depositary Receipt (Common Stock) | 0,02 | −4,16 | 1,06 | −16,53 | 0,3190 | −0,0576 | |||
| LMT / Lockheed Martin Corporation | 0,00 | 0,00 | 0,90 | 3,70 | 0,2711 | 0,0134 | |||
| CL / Colgate-Palmolive Company | 0,01 | 0,00 | 0,81 | −3,01 | 0,2439 | −0,0039 | |||
| WBD / Warner Bros. Discovery, Inc. | 0,06 | 0,48 | 0,74 | 7,27 | 0,2233 | 0,0182 | |||
| K / Kellanova | 0,01 | 0,00 | 0,70 | −3,60 | 0,2105 | −0,0047 | |||
| EMR / Emerson Electric Co. | 0,00 | −8,05 | 0,61 | 11,72 | 0,1847 | 0,0219 | |||
| TJX / The TJX Companies, Inc. | 0,00 | 0,33 | 0,52 | 1,76 | 0,1569 | 0,0049 | |||
| PEG / Public Service Enterprise Group Incorporated | 0,01 | −0,86 | 0,47 | 1,31 | 0,1408 | 0,0040 | |||
| VNQ / Vanguard Specialized Funds - Vanguard Real Estate ETF | 0,00 | 0,00 | 0,44 | −1,57 | 0,1331 | −0,0003 | |||
| ACN / Accenture plc | 0,00 | 0,00 | 0,32 | −4,14 | 0,0980 | −0,0028 | |||
| CVS / CVS Health Corporation | 0,00 | 0,00 | 0,31 | 1,63 | 0,0943 | 0,0030 | |||
| VYM / Vanguard Whitehall Funds - Vanguard High Dividend Yield ETF | 0,00 | −68,91 | 0,29 | −67,85 | 0,0880 | −0,1819 | |||
| BAC / Bank of America Corporation | 0,01 | 0,00 | 0,28 | 13,47 | 0,0841 | 0,0110 | |||
| VTRS / Viatris Inc. | 0,03 | −0,69 | 0,23 | 1,76 | 0,0701 | 0,0022 | |||
| CME / CME Group Inc. | 0,00 | −100,00 | 0,00 | 0,0000 |