Grundläggande statistik
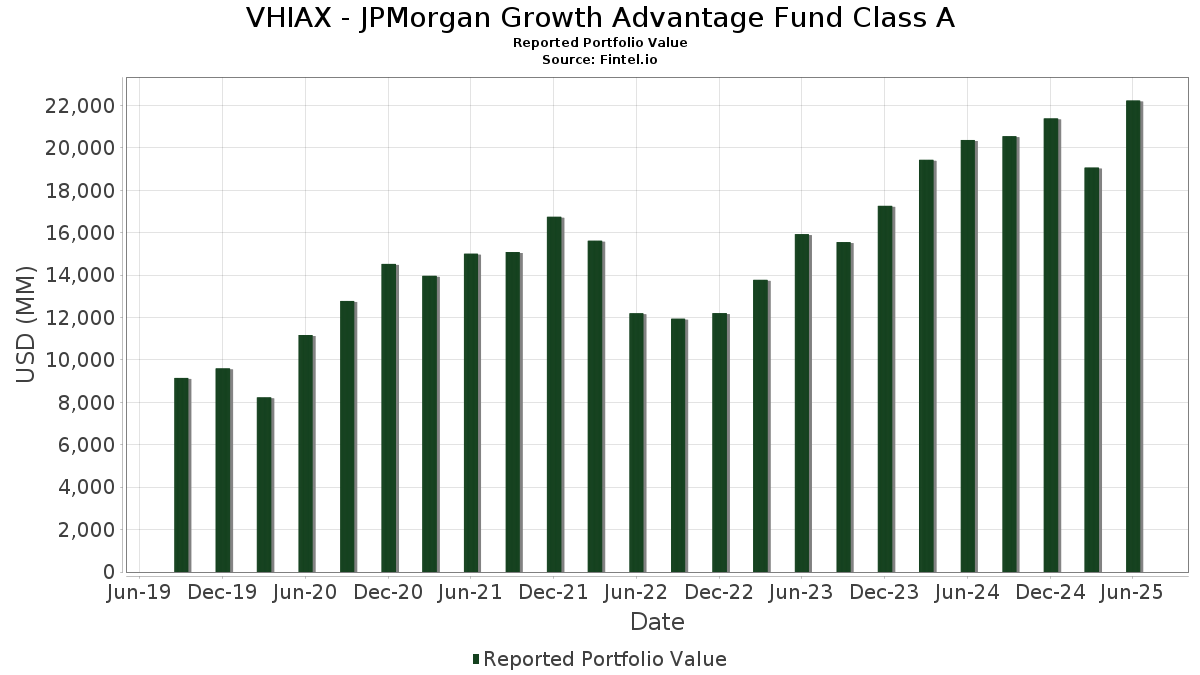
| Portföljvärde | $ 22 234 241 192 |
| Aktuella positioner | 78 |
Senaste innehav, resultat, förvaltat kapital (från 13F, 13D)
VHIAX - JPMorgan Growth Advantage Fund Class A har redovisat 78 totala innehav i sina senaste SEC-arkiveringar. Det senaste portföljvärdet beräknas vara $ 22 234 241 192 USD. Faktiskt förvaltade tillgångar (AUM) är detta värde plus likvida medel (som inte redovisas). VHIAX - JPMorgan Growth Advantage Fund Class As största innehav är NVIDIA Corporation (US:NVDA) , Microsoft Corporation (US:MSFT) , Apple Inc. (US:AAPL) , Amazon.com, Inc. (US:AMZN) , and Meta Platforms, Inc. (US:META) . VHIAX - JPMorgan Growth Advantage Fund Class As nya positioner inkluderar Gilead Sciences, Inc. (US:GILD) , Vistra Corp. (US:VST) , Neurocrine Biosciences, Inc. (US:NBIX) , Intercontinental Exchange, Inc. (US:ICE) , and .
Största ökningarna detta kvartal
Vi använder förändringen i portföljallokeringen eftersom det är det mest meningsfulla måttet. Förändringar kan bero på transaktioner eller förändringar i aktiekurser.
| Värdepapper | Aktier (MM) |
Värde (MM$) |
Portfölj % av | ΔPortfölj % av |
|---|---|---|---|---|
| 14,36 | 2 269,09 | 10,2095 | 4,1599 | |
| 4,29 | 2 136,29 | 9,6120 | 2,4324 | |
| 3,59 | 988,54 | 4,4478 | 1,2072 | |
| 1,23 | 136,31 | 0,6133 | 0,6133 | |
| 0,42 | 568,93 | 2,5598 | 0,5955 | |
| 1,92 | 610,84 | 2,7484 | 0,5356 | |
| 1,09 | 243,36 | 1,0950 | 0,5344 | |
| 0,97 | 158,88 | 0,7149 | 0,5253 | |
| 0,59 | 115,15 | 0,5181 | 0,5181 | |
| 1,66 | 155,76 | 0,7008 | 0,4561 |
Största minskningarna detta kvartal
Vi använder förändringen i portföljallokeringen eftersom det är det mest meningsfulla måttet. Förändringar kan bero på transaktioner eller förändringar i aktiepriser.
| Värdepapper | Aktier (MM) |
Värde (MM$) |
Portfölj % av | ΔPortfölj % av |
|---|---|---|---|---|
| 2,03 | 359,46 | 1,6173 | −2,0550 | |
| 0,36 | 278,19 | 1,2517 | −1,3642 | |
| 0,92 | 518,52 | 2,3330 | −1,3100 | |
| 6,64 | 1 363,28 | 6,1339 | −1,2469 | |
| 5,47 | 1 199,52 | 5,3971 | −1,0634 | |
| 0,39 | 104,25 | 0,4691 | −0,7626 | |
| 1,56 | 1 153,21 | 5,1887 | −0,4985 | |
| 2,56 | 125,58 | 0,5651 | −0,3991 | |
| 1,70 | 210,32 | 0,9463 | −0,3208 | |
| 0,00 | 0,00 | −0,2701 |
13F- och fond arkiveringar
Denna blankett lämnades in den 2025-08-26 för rapporteringsperioden 2025-06-30. Klicka på länksymbolen för att se hela transaktionshistoriken.
Uppgradera för att låsa upp premiumdata och exportera till Excel![]() .
.
| Värdepapper | Typ | Genomsnittligt aktiepris | Aktier (MM) |
ΔAktier (%) |
ΔAktier (%) |
Värde ($MM) |
Portfölj (%) |
ΔPortfölj (%) |
|
|---|---|---|---|---|---|---|---|---|---|
| NVDA / NVIDIA Corporation | 14,36 | 34,98 | 2 269,09 | 96,76 | 10,2095 | 4,1599 | |||
| MSFT / Microsoft Corporation | 4,29 | 17,80 | 2 136,29 | 56,09 | 9,6120 | 2,4324 | |||
| AAPL / Apple Inc. | 6,64 | 4,90 | 1 363,28 | −3,11 | 6,1339 | −1,2469 | |||
| AMZN / Amazon.com, Inc. | 5,47 | −15,53 | 1 199,52 | −2,60 | 5,3971 | −1,0634 | |||
| META / Meta Platforms, Inc. | 1,56 | −16,94 | 1 153,21 | 6,37 | 5,1887 | −0,4985 | |||
| AVGO / Broadcom Inc. | 3,59 | −2,80 | 988,54 | 60,03 | 4,4478 | 1,2072 | |||
| TSLA / Tesla, Inc. | 1,92 | 18,14 | 610,84 | 44,81 | 2,7484 | 0,5356 | |||
| NFLX / Netflix, Inc. | 0,42 | 5,81 | 568,93 | 51,94 | 2,5598 | 0,5955 | |||
| MA / Mastercard Incorporated | 0,92 | −27,17 | 518,52 | −25,33 | 2,3330 | −1,3100 | |||
| INTU / Intuit Inc. | 0,53 | 5,57 | 419,58 | 35,43 | 1,8879 | 0,2626 | |||
| GOOG / Alphabet Inc. | 2,03 | −54,78 | 359,46 | −48,65 | 1,6173 | −2,0550 | |||
| BKNG / Booking Holdings Inc. | 0,06 | 7,85 | 341,73 | 35,52 | 1,5376 | 0,2148 | |||
| ISRG / Intuitive Surgical, Inc. | 0,59 | −2,80 | 318,09 | 6,65 | 1,4312 | −0,1335 | |||
| ORCL / Oracle Corporation | 1,27 | −2,80 | 278,45 | 52,00 | 1,2529 | 0,2918 | |||
| LLY / Eli Lilly and Company | 0,36 | −40,89 | 278,19 | −44,21 | 1,2517 | −1,3642 | |||
| PWR / Quanta Services, Inc. | 0,72 | −2,80 | 272,25 | 44,58 | 1,2249 | 0,2371 | |||
| DASH / DoorDash, Inc. | 1,08 | −2,80 | 266,04 | 31,10 | 1,1970 | 0,1325 | |||
| PANW / Palo Alto Networks, Inc. | 1,27 | −13,33 | 260,30 | 3,94 | 1,1712 | −0,1425 | |||
| GS / The Goldman Sachs Group, Inc. | 0,35 | −1,62 | 248,57 | 27,46 | 1,1184 | 0,0953 | |||
| SNOW / Snowflake Inc. | 1,09 | 48,76 | 243,36 | 127,75 | 1,0950 | 0,5344 | |||
| BX / Blackstone Inc. | 1,59 | −2,80 | 238,41 | 4,01 | 1,0727 | −0,1297 | |||
| MCK / McKesson Corporation | 0,31 | 22,33 | 223,62 | 33,19 | 1,0062 | 0,1254 | |||
| JIMXX / JPMorgan Trust I. - JPMorgan Prime Money Market Fund IM | 222,55 | 5,95 | 222,60 | 5,94 | 1,0016 | −0,1007 | |||
| CRWD / CrowdStrike Holdings, Inc. | 0,43 | −2,80 | 218,26 | 40,41 | 0,9820 | 0,1666 | |||
| NTRA / Natera, Inc. | 1,28 | −2,80 | 216,57 | 16,12 | 0,9745 | −0,0039 | |||
| UBER / Uber Technologies, Inc. | 2,31 | −2,80 | 215,94 | 24,47 | 0,9716 | 0,0615 | |||
| TTWO / Take-Two Interactive Software, Inc. | 0,89 | −2,80 | 214,99 | 13,90 | 0,9673 | −0,0229 | |||
| SPOT / Spotify Technology S.A. | 0,27 | 9,03 | 210,60 | 52,11 | 0,9476 | 0,2213 | |||
| TJX / The TJX Companies, Inc. | 1,70 | −14,12 | 210,32 | −12,92 | 0,9463 | −0,3208 | |||
| HWM / Howmet Aerospace Inc. | 1,10 | 35,82 | 204,21 | 94,87 | 0,9188 | 0,3691 | |||
| MCO / Moody's Corporation | 0,40 | −11,84 | 198,85 | −5,04 | 0,8947 | −0,2039 | |||
| ITT / ITT Inc. | 1,21 | −2,80 | 189,98 | 18,02 | 0,8548 | 0,0104 | |||
| AZO / AutoZone, Inc. | 0,05 | −2,80 | 188,24 | −5,37 | 0,8470 | −0,1965 | |||
| FTI / TechnipFMC plc | 5,42 | −2,80 | 186,66 | 5,63 | 0,8398 | −0,0871 | |||
| MMM / 3M Company | 1,19 | 8,57 | 180,65 | 12,54 | 0,8128 | −0,0292 | |||
| INSM / Insmed Incorporated | 1,66 | 13,03 | 167,25 | 49,10 | 0,7525 | 0,1641 | |||
| IBKR / Interactive Brokers Group, Inc. | 2,92 | 202,53 | 161,98 | 1,23 | 0,7288 | −0,1106 | |||
| TSM / Taiwan Semiconductor Manufacturing Company Limited - Depositary Receipt (Common Stock) | 0,71 | −2,80 | 161,40 | 32,62 | 0,7262 | 0,0878 | |||
| CRWV / CoreWeave, Inc. | 0,97 | 0,00 | 158,88 | 339,75 | 0,7149 | 0,5253 | |||
| ALNY / Alnylam Pharmaceuticals, Inc. | 0,48 | −2,80 | 156,66 | 17,38 | 0,7049 | 0,0048 | |||
| HOOD / Robinhood Markets, Inc. | 1,66 | 48,40 | 155,76 | 233,86 | 0,7008 | 0,4561 | |||
| HUBS / HubSpot, Inc. | 0,28 | −2,80 | 155,47 | −5,29 | 0,6995 | −0,1617 | |||
| HD / The Home Depot, Inc. | 0,42 | −2,80 | 155,20 | −2,76 | 0,6983 | −0,1390 | |||
| AME / AMETEK, Inc. | 0,83 | −14,43 | 150,44 | −10,05 | 0,6769 | −0,2005 | |||
| DE / Deere & Company | 0,29 | 89,82 | 145,74 | 155,76 | 0,6558 | 0,2833 | |||
| SNPS / Synopsys, Inc. | 0,28 | −2,80 | 141,34 | 16,20 | 0,6360 | −0,0021 | |||
| TT / Trane Technologies plc | 0,32 | −2,80 | 138,70 | 26,19 | 0,6240 | 0,0475 | |||
| GILD / Gilead Sciences, Inc. | 1,23 | 136,31 | 0,6133 | 0,6133 | |||||
| EOG / EOG Resources, Inc. | 1,13 | −2,80 | 135,30 | −9,34 | 0,6088 | −0,1741 | |||
| FLUT / Flutter Entertainment plc | 0,47 | 50,55 | 134,25 | 94,18 | 0,6040 | 0,2414 | |||
| TEAM / Atlassian Corporation | 0,65 | −14,97 | 132,04 | −18,63 | 0,5941 | −0,2571 | |||
| NOW / ServiceNow, Inc. | 0,13 | −42,08 | 129,91 | 5,96 | 0,5845 | −0,1852 | |||
| AMT / American Tower Corporation | 0,58 | 186,72 | 128,30 | 191,23 | 0,5773 | 0,3462 | |||
| CPRT / Copart, Inc. | 2,56 | −21,20 | 125,58 | −31,67 | 0,5651 | −0,3991 | |||
| GRMN / Garmin Ltd. | 0,59 | −2,80 | 122,98 | −6,56 | 0,5533 | −0,1371 | |||
| WMB / The Williams Companies, Inc. | 1,95 | 18,11 | 122,66 | 24,13 | 0,5519 | 0,0335 | |||
| IR / Ingersoll Rand Inc. | 1,46 | −2,80 | 121,62 | 1,03 | 0,5472 | −0,0843 | |||
| TMO / Thermo Fisher Scientific Inc. | 0,29 | −2,80 | 116,98 | −20,80 | 0,5264 | −0,2485 | |||
| LNG / Cheniere Energy, Inc. | 0,48 | −2,80 | 115,79 | 2,29 | 0,5210 | −0,0728 | |||
| VST / Vistra Corp. | 0,59 | 115,15 | 0,5181 | 0,5181 | |||||
| ABT / Abbott Laboratories | 0,83 | −2,80 | 112,24 | −0,34 | 0,5050 | −0,0858 | |||
| SHOP / Shopify Inc. | 0,93 | 21,50 | 107,30 | 46,79 | 0,4828 | 0,0993 | |||
| PGR / The Progressive Corporation | 0,39 | −52,91 | 104,25 | −55,60 | 0,4691 | −0,7626 | |||
| CASY / Casey's General Stores, Inc. | 0,20 | −2,80 | 103,31 | 14,27 | 0,4648 | −0,0094 | |||
| TW / Tradeweb Markets Inc. | 0,70 | −2,80 | 103,14 | −4,15 | 0,4641 | −0,1004 | |||
| ULTA / Ulta Beauty, Inc. | 0,21 | 100,16 | 0,4507 | 0,4507 | |||||
| ON / ON Semiconductor Corporation | 1,76 | −2,80 | 92,29 | 25,20 | 0,4152 | 0,0285 | |||
| TWLO / Twilio Inc. | 0,73 | 310,98 | 90,26 | 49,99 | 0,4061 | −0,0316 | |||
| NBIX / Neurocrine Biosciences, Inc. | 0,67 | 84,34 | 0,3795 | 0,3795 | |||||
| ICE / Intercontinental Exchange, Inc. | 0,44 | 80,19 | 0,3608 | 0,3608 | |||||
| EXP / Eagle Materials Inc. | 0,40 | −2,80 | 79,90 | −11,48 | 0,3595 | −0,1140 | |||
| BFAM / Bright Horizons Family Solutions Inc. | 0,64 | −2,80 | 78,66 | −5,44 | 0,3539 | −0,0825 | |||
| TER / Teradyne, Inc. | 0,85 | −2,80 | 76,75 | 5,81 | 0,3453 | −0,0352 | |||
| HLT / Hilton Worldwide Holdings Inc. | 0,29 | −38,66 | 76,59 | −28,20 | 0,3446 | −0,2150 | |||
| AL / Air Lease Corporation | 1,26 | −2,80 | 73,74 | 17,68 | 0,3318 | 0,0031 | |||
| MTD / Mettler-Toledo International Inc. | 0,05 | −2,80 | 63,66 | −3,31 | 0,2864 | −0,0590 | |||
| APP / AppLovin Corporation | 0,17 | 46,31 | 58,95 | 93,30 | 0,2652 | 0,1053 | |||
| IQV / IQVIA Holdings Inc. | 0,31 | −2,80 | 48,62 | −13,11 | 0,2187 | −0,0748 | |||
| ELF / e.l.f. Beauty, Inc. | 0,00 | −100,00 | 0,00 | −100,00 | −0,2701 |