Grundläggande statistik
| Portföljvärde | $ 4 980 341 552 |
| Aktuella positioner | 140 |
Senaste innehav, resultat, förvaltat kapital (från 13F, 13D)
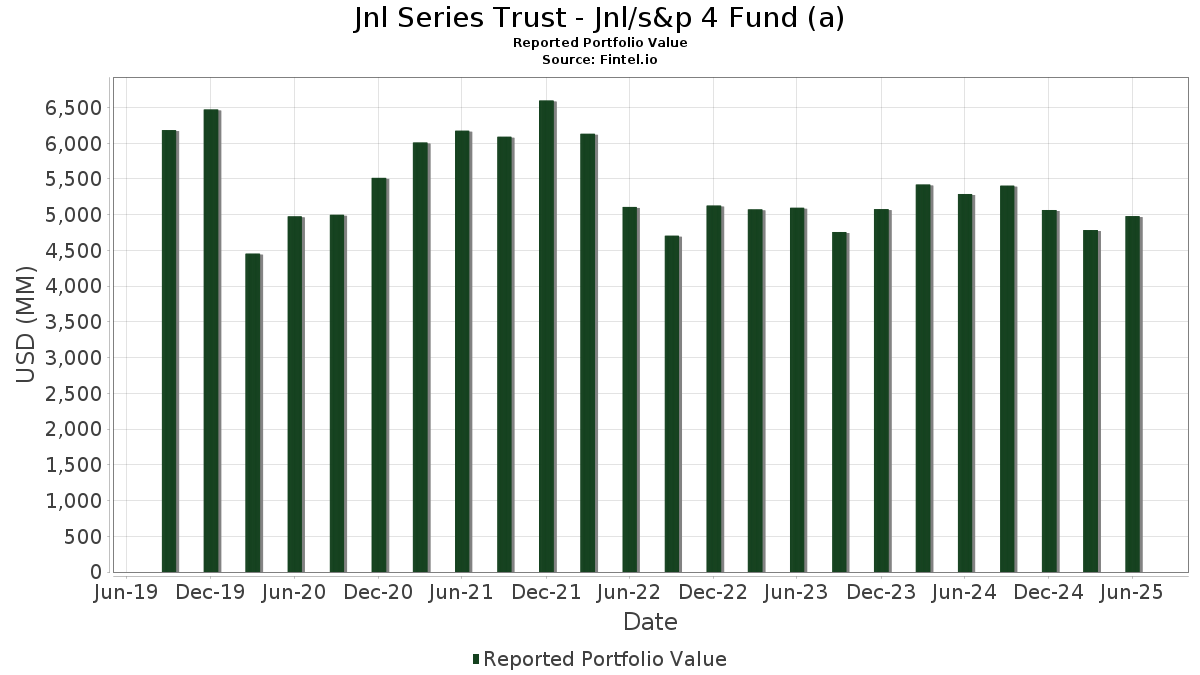
Jnl Series Trust - Jnl/s&p 4 Fund (a) har redovisat 140 totala innehav i sina senaste SEC-arkiveringar. Det senaste portföljvärdet beräknas vara $ 4 980 341 552 USD. Faktiskt förvaltade tillgångar (AUM) är detta värde plus likvida medel (som inte redovisas). Jnl Series Trust - Jnl/s&p 4 Fund (a)s största innehav är NetApp, Inc. (US:NTAP) , Jabil Inc. (US:JBL) , QUALCOMM Incorporated (US:QCOM) , Ralph Lauren Corporation (US:RL) , and Visa Inc. (US:V) .
Största ökningarna detta kvartal
Vi använder förändringen i portföljallokeringen eftersom det är det mest meningsfulla måttet. Förändringar kan bero på transaktioner eller förändringar i aktiekurser.
| Värdepapper | Aktier (MM) |
Värde (MM$) |
Portfölj % av | ΔPortfölj % av |
|---|---|---|---|---|
| 0,62 | 134,49 | 2,7003 | 0,8792 | |
| 0,31 | 84,16 | 1,6898 | 0,5763 | |
| 0,06 | 83,88 | 1,6842 | 0,4118 | |
| 0,42 | 65,73 | 1,3197 | 0,3375 | |
| 0,83 | 80,48 | 1,6159 | 0,3066 | |
| 0,10 | 85,84 | 1,7235 | 0,3044 | |
| 1,33 | 142,09 | 2,8528 | 0,3013 | |
| 0,21 | 44,89 | 0,9014 | 0,2760 | |
| 0,50 | 49,29 | 0,9896 | 0,2708 | |
| 0,02 | 87,11 | 1,7490 | 0,2390 |
Största minskningarna detta kvartal
Vi använder förändringen i portföljallokeringen eftersom det är det mest meningsfulla måttet. Förändringar kan bero på transaktioner eller förändringar i aktiepriser.
| Värdepapper | Aktier (MM) |
Värde (MM$) |
Portfölj % av | ΔPortfölj % av |
|---|---|---|---|---|
| 1,10 | 50,80 | 1,0200 | −0,4380 | |
| 0,87 | 62,44 | 1,2536 | −0,3138 | |
| 1,66 | 34,04 | 0,6835 | −0,2709 | |
| 0,10 | 78,94 | 1,5850 | −0,2369 | |
| 0,27 | 71,46 | 1,4349 | −0,2160 | |
| 0,86 | 44,33 | 0,8900 | −0,2107 | |
| 0,38 | 48,67 | 0,9771 | −0,1923 | |
| 0,65 | 58,36 | 1,1717 | −0,1753 | |
| 1,72 | 42,15 | 0,8462 | −0,1696 | |
| 1,58 | 38,73 | 0,7776 | −0,1690 |
13F- och fond arkiveringar
Denna blankett lämnades in den 2025-08-27 för rapporteringsperioden 2025-06-30. Klicka på länksymbolen för att se hela transaktionshistoriken.
Uppgradera för att låsa upp premiumdata och exportera till Excel![]() .
.
| Värdepapper | Typ | Genomsnittligt aktiepris | Aktier (MM) |
ΔAktier (%) |
ΔAktier (%) |
Värde ($MM) |
Portfölj (%) |
ΔPortfölj (%) |
|
|---|---|---|---|---|---|---|---|---|---|
| NTAP / NetApp, Inc. | 1,33 | −4,14 | 142,09 | 16,28 | 2,8528 | 0,3013 | |||
| JBL / Jabil Inc. | 0,62 | −3,79 | 134,49 | 54,21 | 2,7003 | 0,8792 | |||
| QCOM / QUALCOMM Incorporated | 0,71 | −4,14 | 112,48 | −0,61 | 2,2583 | −0,1048 | |||
| RL / Ralph Lauren Corporation | 0,34 | −4,14 | 91,89 | 19,11 | 1,8450 | 0,2341 | |||
| V / Visa Inc. | 0,26 | −4,14 | 90,56 | −2,88 | 1,8182 | −0,1289 | |||
| BKNG / Booking Holdings Inc. | 0,02 | −4,14 | 87,11 | 20,46 | 1,7490 | 0,2390 | |||
| KLAC / KLA Corporation | 0,10 | −4,14 | 85,84 | 26,31 | 1,7235 | 0,3044 | |||
| AVGO / Broadcom Inc. | 0,31 | −4,14 | 84,16 | 57,82 | 1,6898 | 0,5763 | |||
| NFLX / Netflix, Inc. | 0,06 | −4,14 | 83,88 | 37,66 | 1,6842 | 0,4118 | |||
| LRCX / Lam Research Corporation | 0,83 | −4,14 | 80,48 | 28,35 | 1,6159 | 0,3066 | |||
| LLY / Eli Lilly and Company | 0,10 | −4,14 | 78,94 | −9,52 | 1,5850 | −0,2369 | |||
| AMAT / Applied Materials, Inc. | 0,42 | −4,14 | 76,47 | 20,93 | 1,5354 | 0,2150 | |||
| COR / Cencora, Inc. | 0,25 | −3,93 | 75,74 | 3,59 | 1,5207 | −0,0061 | |||
| GOOGL / Alphabet Inc. | 0,42 | −4,14 | 74,54 | 9,24 | 1,4967 | 0,0719 | |||
| PGR / The Progressive Corporation | 0,27 | −4,14 | 71,46 | −9,61 | 1,4349 | −0,2160 | |||
| GLW / Corning Incorporated | 1,30 | −4,14 | 68,58 | 10,12 | 1,3770 | 0,0765 | |||
| NVDA / NVIDIA Corporation | 0,42 | −4,14 | 65,73 | 39,74 | 1,3197 | 0,3375 | |||
| MSFT / Microsoft Corporation | 0,13 | −4,14 | 64,64 | 27,02 | 1,2979 | 0,2352 | |||
| CL / Colgate-Palmolive Company | 0,71 | −4,14 | 64,18 | −7,00 | 1,2886 | −0,1525 | |||
| OMC / Omnicom Group Inc. | 0,87 | −4,14 | 62,44 | −16,82 | 1,2536 | −0,3138 | |||
| ORLY / O'Reilly Automotive, Inc. | 0,65 | 1 337,90 | 58,36 | −9,54 | 1,1717 | −0,1753 | |||
| CMCSA / Comcast Corporation | 1,63 | −4,14 | 58,27 | −7,28 | 1,1699 | −0,1424 | |||
| SBAC / SBA Communications Corporation | 0,24 | −3,96 | 56,08 | 2,52 | 1,1260 | −0,0163 | |||
| ADP / Automatic Data Processing, Inc. | 0,18 | −4,14 | 55,37 | −3,24 | 1,1117 | −0,0832 | |||
| CSCO / Cisco Systems, Inc. | 0,78 | −4,14 | 53,79 | 7,78 | 1,0800 | 0,0378 | |||
| BMY / Bristol-Myers Squibb Company | 1,10 | −4,14 | 50,80 | −27,24 | 1,0200 | −0,4380 | |||
| KKR / KKR & Co. Inc. | 0,38 | −4,14 | 50,45 | 10,30 | 1,0129 | 0,0579 | |||
| KMI / Kinder Morgan, Inc. | 1,71 | −4,14 | 50,29 | −1,22 | 1,0098 | −0,0533 | |||
| APH / Amphenol Corporation | 0,50 | −4,90 | 49,29 | 43,18 | 0,9896 | 0,2708 | |||
| TE Connectivity Public Limited Company / EC (IE000IVNQZ81) | 0,29 | −4,14 | 49,14 | 14,41 | 0,9866 | 0,0898 | |||
| FICO / Fair Isaac Corporation | 0,03 | −4,14 | 48,93 | −4,98 | 0,9825 | −0,0929 | |||
| KMB / Kimberly-Clark Corporation | 0,38 | −4,14 | 48,67 | −13,10 | 0,9771 | −0,1923 | |||
| MSI / Motorola Solutions, Inc. | 0,11 | −4,14 | 48,06 | −7,94 | 0,9650 | −0,1251 | |||
| META / Meta Platforms, Inc. | 0,06 | −4,14 | 47,37 | 22,76 | 0,9511 | 0,1454 | |||
| MO / Altria Group, Inc. | 0,80 | −4,14 | 46,93 | −6,36 | 0,9423 | −0,1042 | |||
| UHS / Universal Health Services, Inc. | 0,26 | −4,14 | 46,38 | −7,58 | 0,9312 | −0,1167 | |||
| ORCL / Oracle Corporation | 0,21 | −4,14 | 44,89 | 49,90 | 0,9014 | 0,2760 | |||
| EIX / Edison International | 0,86 | −3,98 | 44,33 | −15,91 | 0,8900 | −0,2107 | |||
| TPR / Tapestry, Inc. | 0,50 | −4,14 | 44,26 | 19,55 | 0,8886 | 0,1156 | |||
| IPG / The Interpublic Group of Companies, Inc. | 1,72 | −3,88 | 42,15 | −13,36 | 0,8462 | −0,1696 | |||
| ADBE / Adobe Inc. | 0,11 | −4,14 | 41,20 | −3,30 | 0,8273 | −0,0625 | |||
| CVS / CVS Health Corporation | 0,59 | −4,14 | 40,66 | −2,40 | 0,8163 | −0,0535 | |||
| AZO / AutoZone, Inc. | 0,01 | −4,14 | 39,49 | −6,67 | 0,7928 | −0,0906 | |||
| TT / Trane Technologies plc | 0,09 | −4,90 | 39,44 | 23,46 | 0,7919 | 0,1248 | |||
| HPQ / HP Inc. | 1,58 | −3,28 | 38,73 | −14,57 | 0,7776 | −0,1690 | |||
| BK / The Bank of New York Mellon Corporation | 0,42 | −4,14 | 38,26 | 4,13 | 0,7682 | 0,0010 | |||
| FTNT / Fortinet, Inc. | 0,36 | −3,18 | 38,00 | 6,33 | 0,7630 | 0,0167 | |||
| SYF / Synchrony Financial | 0,56 | −4,14 | 37,38 | 20,85 | 0,7505 | 0,1046 | |||
| WMT / Walmart Inc. | 0,38 | −3,18 | 37,14 | 7,83 | 0,7456 | 0,0265 | |||
| CBRE / CBRE Group, Inc. | 0,26 | −3,18 | 35,80 | 3,73 | 0,7189 | −0,0019 | |||
| ABBV / AbbVie Inc. | 0,19 | −3,18 | 35,57 | −14,23 | 0,7141 | −0,1517 | |||
| CPAY / Corpay, Inc. | 0,11 | −3,04 | 34,87 | −7,74 | 0,7000 | −0,0891 | |||
| MMC / Marsh & McLennan Companies, Inc. | 0,16 | −3,18 | 34,44 | −13,26 | 0,6915 | −0,1376 | |||
| PEG / Public Service Enterprise Group Incorporated | 0,41 | −3,18 | 34,11 | −0,97 | 0,6848 | −0,0344 | |||
| CAG / Conagra Brands, Inc. | 1,66 | −2,96 | 34,04 | −25,52 | 0,6835 | −0,2709 | |||
| SHW / The Sherwin-Williams Company | 0,10 | −3,06 | 33,57 | −4,67 | 0,6741 | −0,0613 | |||
| EOG / EOG Resources, Inc. | 0,28 | −3,18 | 33,45 | −9,70 | 0,6717 | −0,1019 | |||
| TMUS / T-Mobile US, Inc. | 0,14 | −3,18 | 33,45 | −13,51 | 0,6715 | −0,1359 | |||
| HCA / HCA Healthcare, Inc. | 0,08 | −3,95 | 32,37 | 6,48 | 0,6499 | 0,0152 | |||
| FITB / Fifth Third Bancorp | 0,78 | −3,18 | 32,04 | 1,58 | 0,6433 | −0,0153 | |||
| ZTS / Zoetis Inc. | 0,20 | −3,18 | 31,87 | −8,30 | 0,6399 | −0,0858 | |||
| IP / International Paper Company | 0,67 | −3,18 | 31,21 | −15,02 | 0,6267 | −0,1402 | |||
| HST / Host Hotels & Resorts, Inc. | 2,03 | −4,14 | 31,17 | 3,62 | 0,6259 | −0,0023 | |||
| NRG / NRG Energy, Inc. | 0,19 | −4,91 | 31,07 | 59,96 | 0,6239 | 0,2183 | |||
| ACN / Accenture plc | 0,10 | −3,18 | 30,83 | −7,26 | 0,6189 | −0,0752 | |||
| HAS / Hasbro, Inc. | 0,41 | −4,14 | 30,15 | 15,08 | 0,6053 | 0,0583 | |||
| CF / CF Industries Holdings, Inc. | 0,32 | −4,14 | 29,06 | 12,85 | 0,5835 | 0,0458 | |||
| MA / Mastercard Incorporated | 0,05 | −4,14 | 28,25 | −1,72 | 0,5671 | −0,0330 | |||
| IT / Gartner, Inc. | 0,07 | −4,14 | 28,14 | −7,68 | 0,5649 | −0,0715 | |||
| LDOS / Leidos Holdings, Inc. | 0,18 | −4,14 | 28,13 | 12,08 | 0,5648 | 0,0407 | |||
| AMP / Ameriprise Financial, Inc. | 0,05 | −4,14 | 27,51 | 5,69 | 0,5524 | 0,0088 | |||
| TXN / Texas Instruments Incorporated | 0,13 | −4,40 | 27,45 | 10,46 | 0,5511 | 0,0322 | |||
| HPE / Hewlett Packard Enterprise Company | 1,34 | −3,57 | 27,38 | 27,80 | 0,5497 | 0,1024 | |||
| BWA / BorgWarner Inc. | 0,82 | −3,87 | 27,35 | 12,34 | 0,5492 | 0,0408 | |||
| VZ / Verizon Communications Inc. | 0,63 | −1,81 | 27,20 | −6,34 | 0,5462 | −0,0603 | |||
| MCO / Moody's Corporation | 0,05 | −4,14 | 26,80 | 3,25 | 0,5381 | −0,0039 | |||
| KEY / KeyCorp | 1,51 | −4,62 | 26,33 | 3,91 | 0,5287 | −0,0005 | |||
| VLO / Valero Energy Corporation | 0,19 | −4,14 | 25,86 | −2,43 | 0,5192 | −0,0342 | |||
| SNA / Snap-on Incorporated | 0,08 | −4,14 | 25,19 | −11,49 | 0,5057 | −0,0885 | |||
| NXPI / NXP Semiconductors N.V. | 0,11 | −4,14 | 25,03 | 10,20 | 0,5025 | 0,0283 | |||
| TFC / Truist Financial Corporation | 0,58 | −4,14 | 24,97 | 0,15 | 0,5013 | −0,0193 | |||
| CDW / CDW Corporation | 0,14 | −4,14 | 24,93 | 6,83 | 0,5006 | 0,0132 | |||
| PFE / Pfizer Inc. | 0,99 | −4,14 | 24,07 | −8,30 | 0,4832 | −0,0648 | |||
| PCAR / PACCAR Inc | 0,25 | −4,14 | 24,05 | −6,41 | 0,4828 | −0,0537 | |||
| 46628D437 / JNL Government Money Market Fund | 23,86 | 91,31 | 23,86 | 91,31 | 0,4791 | 0,2187 | |||
| SWKS / Skyworks Solutions, Inc. | 0,32 | −4,14 | 23,76 | 10,53 | 0,4771 | 0,0282 | |||
| DRI / Darden Restaurants, Inc. | 0,11 | −4,91 | 23,69 | −0,24 | 0,4756 | −0,0202 | |||
| CME / CME Group Inc. | 0,08 | −4,91 | 22,02 | −1,20 | 0,4421 | −0,0233 | |||
| MCK / McKesson Corporation | 0,03 | −4,14 | 21,98 | 4,38 | 0,4414 | 0,0016 | |||
| UPS / United Parcel Service, Inc. | 0,21 | −4,14 | 21,24 | −12,02 | 0,4265 | −0,0777 | |||
| PM / Philip Morris International Inc. | 0,11 | −4,14 | 20,64 | 9,99 | 0,4144 | 0,0226 | |||
| NTRS / Northern Trust Corporation | 0,16 | −2,61 | 20,49 | 25,16 | 0,4114 | 0,0696 | |||
| BEN / Franklin Resources, Inc. | 0,84 | −4,91 | 20,13 | 17,82 | 0,4042 | 0,0474 | |||
| BBY / Best Buy Co., Inc. | 0,29 | −2,72 | 19,66 | −11,29 | 0,3947 | −0,0680 | |||
| WMB / The Williams Companies, Inc. | 0,31 | −5,84 | 19,61 | −1,04 | 0,3937 | −0,0200 | |||
| DTE / DTE Energy Company | 0,14 | −4,91 | 19,02 | −8,90 | 0,3820 | −0,0541 | |||
| AXP / American Express Company | 0,06 | −3,18 | 18,88 | 14,78 | 0,3790 | 0,0356 | |||
| CCI / Crown Castle Inc. | 0,18 | −2,18 | 18,86 | −3,59 | 0,3786 | −0,0298 | |||
| CTAS / Cintas Corporation | 0,08 | −4,91 | 18,82 | 3,12 | 0,3780 | −0,0032 | |||
| MS / Morgan Stanley | 0,13 | −3,18 | 18,81 | 16,89 | 0,3776 | 0,0416 | |||
| GWW / W.W. Grainger, Inc. | 0,02 | −4,14 | 18,78 | 0,95 | 0,3770 | −0,0114 | |||
| COST / Costco Wholesale Corporation | 0,02 | −4,14 | 18,67 | 0,33 | 0,3749 | −0,0137 | |||
| EXPE / Expedia Group, Inc. | 0,11 | −2,18 | 18,35 | −1,85 | 0,3684 | −0,0219 | |||
| DGX / Quest Diagnostics Incorporated | 0,10 | −4,14 | 18,28 | 1,77 | 0,3671 | −0,0080 | |||
| LYB / LyondellBasell Industries N.V. | 0,31 | −4,14 | 18,21 | −21,22 | 0,3656 | −0,1170 | |||
| ALL / The Allstate Corporation | 0,09 | −4,91 | 18,11 | −7,55 | 0,3637 | −0,0454 | |||
| K / Kellanova | 0,23 | −4,91 | 17,97 | −8,32 | 0,3608 | −0,0485 | |||
| D / Dominion Energy, Inc. | 0,32 | −2,18 | 17,86 | −1,40 | 0,3586 | −0,0196 | |||
| CI / The Cigna Group | 0,05 | −2,18 | 17,77 | −1,71 | 0,3567 | −0,0207 | |||
| INTC / Intel Corporation | 0,79 | −3,18 | 17,73 | −4,50 | 0,3560 | −0,0317 | |||
| MMM / 3M Company | 0,11 | −3,18 | 17,44 | 0,37 | 0,3502 | −0,0127 | |||
| LII / Lennox International Inc. | 0,03 | −2,19 | 17,16 | −0,02 | 0,3446 | −0,0139 | |||
| ETR / Entergy Corporation | 0,21 | −2,18 | 17,10 | −4,90 | 0,3432 | −0,0321 | |||
| AKAM / Akamai Technologies, Inc. | 0,21 | −2,18 | 16,97 | −3,08 | 0,3408 | −0,0249 | |||
| SPG / Simon Property Group, Inc. | 0,10 | −3,18 | 16,33 | −6,28 | 0,3279 | −0,0360 | |||
| ITW / Illinois Tool Works Inc. | 0,07 | −5,84 | 16,26 | −6,14 | 0,3265 | −0,0352 | |||
| ADM / Archer-Daniels-Midland Company | 0,31 | −5,85 | 16,15 | 3,51 | 0,3243 | −0,0015 | |||
| GM / General Motors Company | 0,33 | −5,84 | 16,10 | −1,48 | 0,3232 | −0,0180 | |||
| URI / United Rentals, Inc. | 0,02 | −5,85 | 15,96 | 13,19 | 0,3204 | 0,0260 | |||
| AVY / Avery Dennison Corporation | 0,09 | −2,96 | 15,84 | −4,32 | 0,3181 | −0,0277 | |||
| MRK / Merck & Co., Inc. | 0,20 | −2,18 | 15,44 | −13,74 | 0,3100 | −0,0637 | |||
| RVTY / Revvity, Inc. | 0,16 | −2,81 | 15,33 | −11,16 | 0,3078 | −0,0525 | |||
| COP / ConocoPhillips | 0,17 | −5,84 | 15,17 | −19,54 | 0,3046 | −0,0891 | |||
| OKE / ONEOK, Inc. | 0,18 | −5,84 | 14,88 | −22,54 | 0,2987 | −0,1023 | |||
| LOW / Lowe's Companies, Inc. | 0,07 | −5,85 | 14,74 | −10,43 | 0,2960 | −0,0477 | |||
| DAL / Delta Air Lines, Inc. | 0,30 | −3,18 | 14,54 | 9,21 | 0,2919 | 0,0139 | |||
| PKG / Packaging Corporation of America | 0,07 | −5,84 | 13,85 | −10,39 | 0,2780 | −0,0447 | |||
| PHM / PulteGroup, Inc. | 0,13 | −3,18 | 13,62 | −0,67 | 0,2734 | −0,0129 | |||
| VRSN / VeriSign, Inc. | 0,05 | −3,84 | 13,60 | 9,40 | 0,2730 | 0,0135 | |||
| DHI / D.R. Horton, Inc. | 0,09 | −3,94 | 11,61 | −2,58 | 0,2331 | −0,0158 | |||
| EA / Electronic Arts Inc. | 0,07 | −4,14 | 11,16 | 5,93 | 0,2241 | 0,0041 | |||
| TDY / Teledyne Technologies Incorporated | 0,02 | −3,84 | 10,25 | −1,01 | 0,2058 | −0,0104 | |||
| APTV / Aptiv PLC | 0,14 | −4,14 | 9,45 | 9,91 | 0,1898 | 0,0102 | |||
| GPC / Genuine Parts Company | 0,07 | 0,00 | 9,04 | 1,82 | 0,1815 | −0,0039 | |||
| USB / U.S. Bancorp | 0,20 | 0,00 | 8,98 | 7,19 | 0,1803 | 0,0053 | |||
| PRU / Prudential Financial, Inc. | 0,08 | 0,00 | 8,69 | −3,80 | 0,1744 | −0,0141 | |||
| MDT / Medtronic plc | 0,10 | −4,14 | 8,67 | −7,01 | 0,1742 | −0,0206 | |||
| TFX / Teleflex Incorporated | 0,07 | 0,00 | 8,39 | −14,35 | 0,1685 | −0,0361 | |||
| LEN / Lennar Corporation | 0,05 | 0,00 | 6,02 | −3,64 | 0,1208 | −0,0096 | |||
| FUTURE - CASH SETTLED / DE (N/A) | 0,86 | 0,0173 | 0,0173 |