Grundläggande statistik
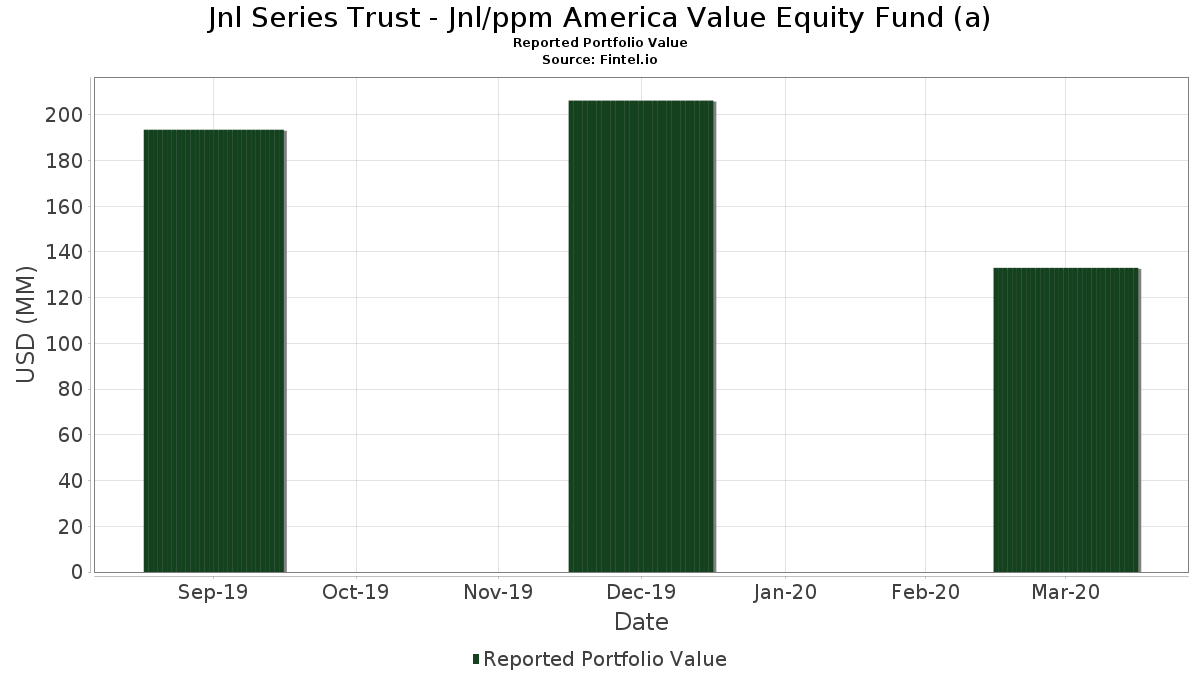
| Portföljvärde | $ 133 050 630 |
| Aktuella positioner | 53 |
Senaste innehav, resultat, förvaltat kapital (från 13F, 13D)
Jnl Series Trust - Jnl/ppm America Value Equity Fund (a) har redovisat 53 totala innehav i sina senaste SEC-arkiveringar. Det senaste portföljvärdet beräknas vara $ 133 050 630 USD. Faktiskt förvaltade tillgångar (AUM) är detta värde plus likvida medel (som inte redovisas). Jnl Series Trust - Jnl/ppm America Value Equity Fund (a)s största innehav är The Cigna Group (US:CI) , Leidos Holdings, Inc. (US:LDOS) , JPMorgan Chase & Co. (US:JPM) , The Allstate Corporation (US:ALL) , and McKesson Corporation (US:MCK) . Jnl Series Trust - Jnl/ppm America Value Equity Fund (a)s nya positioner inkluderar Exelon Corporation (US:EXC) , Cognizant Technology Solutions Corporation (US:CTSH) , .
Största ökningarna detta kvartal
Vi använder förändringen i portföljallokeringen eftersom det är det mest meningsfulla måttet. Förändringar kan bero på transaktioner eller förändringar i aktiekurser.
| Värdepapper | Aktier (MM) |
Värde (MM$) |
Portfölj % av | ΔPortfölj % av |
|---|---|---|---|---|
| 0,09 | 3,35 | 2,5116 | 2,5116 | |
| 0,03 | 1,51 | 1,1289 | 1,1289 | |
| 0,10 | 3,16 | 2,3713 | 1,0780 | |
| 0,03 | 3,34 | 2,5072 | 0,9935 | |
| 0,04 | 3,59 | 2,6927 | 0,7733 | |
| 0,09 | 3,56 | 2,6675 | 0,7314 | |
| 0,03 | 3,58 | 2,6876 | 0,7022 | |
| 0,22 | 3,51 | 2,6327 | 0,6818 | |
| 0,04 | 2,99 | 2,2383 | 0,6154 | |
| 0,04 | 3,67 | 2,7488 | 0,5795 |
Största minskningarna detta kvartal
Vi använder förändringen i portföljallokeringen eftersom det är det mest meningsfulla måttet. Förändringar kan bero på transaktioner eller förändringar i aktiepriser.
| Värdepapper | Aktier (MM) |
Värde (MM$) |
Portfölj % av | ΔPortfölj % av |
|---|---|---|---|---|
| 0,00 | 0,00 | −1,8954 | ||
| 0,00 | 0,00 | −1,8849 | ||
| 0,00 | 0,00 | −1,8428 | ||
| 0,04 | 1,19 | 0,8925 | −1,2422 | |
| 0,14 | 1,99 | 1,4917 | −1,1767 | |
| 0,00 | 0,00 | −1,0122 | ||
| 0,08 | 1,71 | 1,2838 | −1,0047 | |
| 0,00 | 0,00 | −0,9555 | ||
| 0,14 | 0,96 | 0,7191 | −0,9421 | |
| 0,04 | 0,98 | 0,7356 | −0,6921 |
13F- och fond arkiveringar
Denna blankett lämnades in den 2020-05-28 för rapporteringsperioden 2020-03-31. Klicka på länksymbolen för att se hela transaktionshistoriken.
Uppgradera för att låsa upp premiumdata och exportera till Excel![]() .
.
| Värdepapper | Typ | Genomsnittligt aktiepris | Aktier (MM) |
ΔAktier (%) |
ΔAktier (%) |
Värde ($MM) |
Portfölj (%) |
ΔPortfölj (%) |
|
|---|---|---|---|---|---|---|---|---|---|
| CI / The Cigna Group | 0,02 | −16,67 | 3,99 | −27,80 | 2,9891 | 0,3118 | |||
| LDOS / Leidos Holdings, Inc. | 0,04 | −12,47 | 3,67 | −18,04 | 2,7488 | 0,5795 | |||
| JPM / JPMorgan Chase & Co. | 0,04 | 22,77 | 3,59 | −20,71 | 2,6934 | 0,4965 | |||
| ALL / The Allstate Corporation | 0,04 | 11,22 | 3,59 | −9,27 | 2,6927 | 0,7733 | |||
| MCK / McKesson Corporation | 0,03 | −10,47 | 3,58 | −12,46 | 2,6876 | 0,7022 | |||
| MO / Altria Group, Inc. | 0,09 | 15,00 | 3,56 | −10,90 | 2,6675 | 0,7314 | |||
| VST / Vistra Corp. | 0,22 | 25,71 | 3,51 | −12,73 | 2,6327 | 0,6818 | |||
| AES / The AES Corporation | 0,26 | 0,00 | 3,47 | −31,67 | 2,6054 | 0,1399 | |||
| AAPL / Apple Inc. | 0,01 | −28,95 | 3,43 | −38,48 | 2,5740 | −0,1315 | |||
| CMCSA / Comcast Corporation | 0,10 | −4,33 | 3,42 | −26,86 | 2,5649 | 0,2971 | |||
| CVS / CVS Health Corporation | 0,06 | −0,86 | 3,41 | −20,82 | 2,5579 | 0,4685 | |||
| PFE / Pfizer Inc. | 0,10 | −19,68 | 3,41 | −33,10 | 2,5575 | 0,0857 | |||
| EXC / Exelon Corporation | 0,09 | 3,35 | 2,5116 | 2,5116 | |||||
| JNJ / Johnson & Johnson | 0,03 | 19,16 | 3,34 | 7,11 | 2,5072 | 0,9935 | |||
| ABBV / AbbVie Inc. | 0,04 | −9,38 | 3,31 | −22,01 | 2,4850 | 0,4242 | |||
| CAT / Caterpillar Inc. | 0,03 | −1,72 | 3,31 | −22,77 | 2,4797 | 0,4030 | |||
| T / AT&T Inc. | 0,11 | −3,80 | 3,25 | −28,24 | 2,4370 | 0,2407 | |||
| ADM / Archer-Daniels-Midland Company | 0,09 | −0,55 | 3,18 | −24,52 | 2,3872 | 0,3419 | |||
| KR / The Kroger Co. | 0,10 | 14,13 | 3,16 | 18,56 | 2,3713 | 1,0780 | |||
| MRK / Merck & Co., Inc. | 0,04 | 5,43 | 2,99 | −10,79 | 2,2383 | 0,6154 | |||
| CVX / Chevron Corporation | 0,04 | 0,00 | 2,98 | −39,86 | 2,2330 | −0,1688 | |||
| MS / Morgan Stanley | 0,09 | −7,64 | 2,96 | −38,57 | 2,2179 | −0,1172 | |||
| HIG / The Hartford Insurance Group, Inc. | 0,08 | 1,23 | 2,89 | −41,30 | 2,1667 | −0,2202 | |||
| GM / General Motors Company | 0,14 | 2,91 | 2,87 | −41,59 | 2,1501 | −0,2298 | |||
| DAL / Delta Air Lines, Inc. | 0,10 | 25,88 | 2,84 | −38,59 | 2,1328 | −0,1132 | |||
| CSCO / Cisco Systems, Inc. | 0,07 | −1,27 | 2,75 | −19,09 | 2,0632 | 0,4143 | |||
| C / Citigroup Inc. | 0,06 | 6,84 | 2,70 | −43,68 | 2,0212 | −0,2993 | |||
| QCOM / QUALCOMM Incorporated | 0,04 | −1,02 | 2,64 | −24,11 | 1,9782 | 0,2926 | |||
| BERY / Berry Global Group, Inc. | 0,08 | 0,00 | 2,63 | −29,02 | 1,9715 | 0,1753 | |||
| MSFT / Microsoft Corporation | 0,02 | −21,43 | 2,60 | −21,41 | 1,9511 | 0,3453 | |||
| CPB / The Campbell's Company | 0,05 | 0,20 | 2,35 | −6,40 | 1,7651 | 0,5454 | |||
| SNV / Synovus Financial Corp. | 0,12 | 22,95 | 2,05 | −44,92 | 1,5378 | −0,2680 | |||
| XOM / Exxon Mobil Corporation | 0,05 | 36,46 | 2,05 | −25,76 | 1,5345 | 0,1980 | |||
| INTC / Intel Corporation | 0,04 | −1,32 | 2,03 | −10,77 | 1,5217 | 0,4189 | |||
| NWL / Newell Brands Inc. | 0,15 | 0,00 | 2,01 | −30,91 | 1,5036 | 0,0962 | |||
| HBAN / Huntington Bancshares Incorporated | 0,24 | −10,44 | 2,00 | −51,23 | 1,4974 | −0,4886 | |||
| / ViacomCBS Inc | 0,14 | 8,30 | 1,99 | −63,85 | 1,4917 | −1,1767 | |||
| NUE / Nucor Corporation | 0,05 | 0,00 | 1,89 | −36,01 | 1,4206 | −0,0149 | |||
| RHI / Robert Half Inc. | 0,05 | 40,14 | 1,83 | −16,21 | 1,3685 | 0,3121 | |||
| BAC / Bank of America Corporation | 0,08 | −39,81 | 1,71 | −63,72 | 1,2838 | −1,0047 | |||
| PNC / The PNC Financial Services Group, Inc. | 0,02 | 0,00 | 1,68 | −40,05 | 1,2632 | −0,0992 | |||
| NUAN / Nuance Communications Inc | 0,10 | −19,76 | 1,67 | −24,48 | 1,2519 | 0,1798 | |||
| FL / Foot Locker, Inc. | 0,07 | 2,31 | 1,57 | −42,14 | 1,1738 | −0,1383 | |||
| TXT / Textron Inc. | 0,06 | 0,00 | 1,55 | −40,22 | 1,1598 | −0,0945 | |||
| BBY / Best Buy Co., Inc. | 0,03 | 0,00 | 1,54 | −35,06 | 1,1539 | 0,0044 | |||
| CTSH / Cognizant Technology Solutions Corporation | 0,03 | 1,51 | 1,1289 | 1,1289 | |||||
| AVT / Avnet, Inc. | 0,05 | 0,00 | 1,25 | −40,86 | 0,9391 | −0,0878 | |||
| RCL / Royal Caribbean Cruises Ltd. | 0,04 | −3,14 | 1,19 | −71,24 | 0,8925 | −1,2422 | |||
| 46628D437 / JNL Government Money Market Fund | 1,11 | 37,69 | 1,11 | 37,70 | 0,8357 | 0,4432 | |||
| SPG / Simon Property Group, Inc. | 0,02 | 5,88 | 0,99 | −61,02 | 0,7404 | −0,4875 | |||
| SPR / Spirit AeroSystems Holdings, Inc. | 0,04 | 1,49 | 0,98 | −66,68 | 0,7356 | −0,6921 | |||
| HAL / Halliburton Company | 0,14 | 0,00 | 0,96 | −72,00 | 0,7191 | −0,9421 | |||
| ADS / Bread Financial Holdings Inc | 0,02 | 2,74 | 0,76 | −69,19 | 0,5677 | −0,6238 | |||
| WFC / Wells Fargo & Company | 0,00 | −100,00 | 0,00 | −100,00 | −1,0122 | ||||
| GS / The Goldman Sachs Group, Inc. | 0,00 | −100,00 | 0,00 | −100,00 | −1,8954 | ||||
| IBM / International Business Machines Corporation | 0,00 | −100,00 | 0,00 | −100,00 | −0,9555 | ||||
| LNC / Lincoln National Corporation | 0,00 | −100,00 | 0,00 | −100,00 | −1,8428 | ||||
| APA / APA Corporation | 0,00 | −100,00 | 0,00 | −100,00 | −1,8849 | ||||
| GILD / Gilead Sciences, Inc. | 0,00 | −100,00 | 0,00 | −100,00 | −0,1733 |