Grundläggande statistik
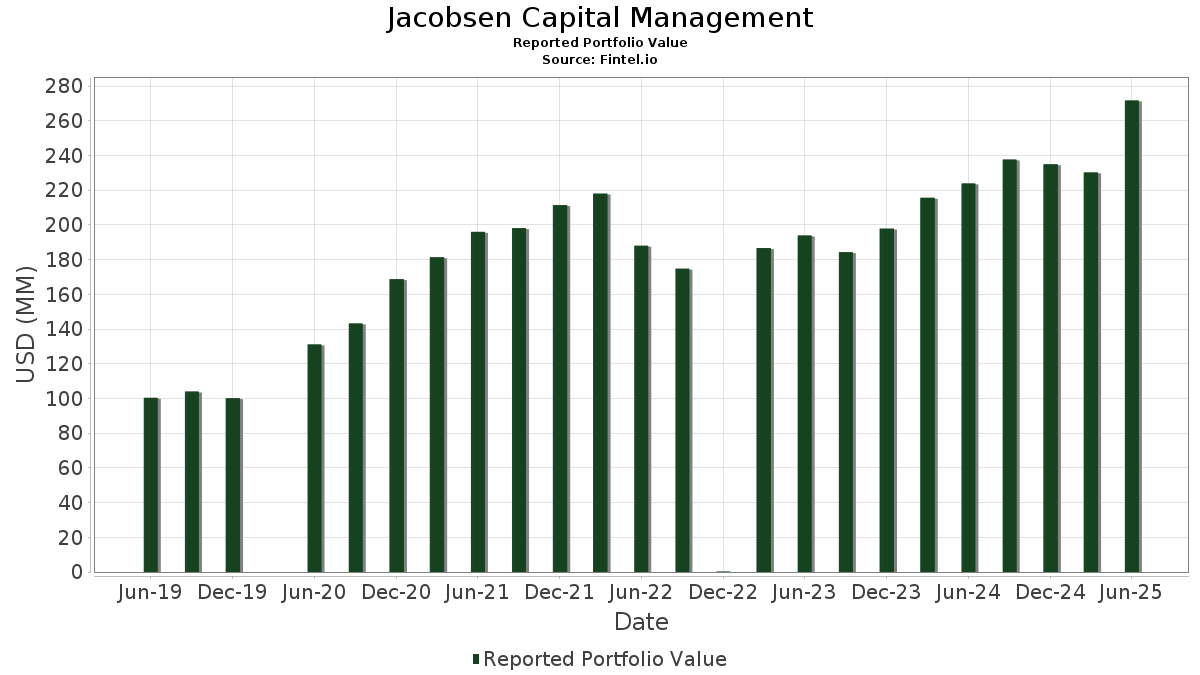
| Portföljvärde | $ 271 631 378 |
| Aktuella positioner | 116 |
Senaste innehav, resultat, förvaltat kapital (från 13F, 13D)
Jacobsen Capital Management har redovisat 116 totala innehav i sina senaste SEC-arkiveringar. Det senaste portföljvärdet beräknas vara $ 271 631 378 USD. Faktiskt förvaltade tillgångar (AUM) är detta värde plus likvida medel (som inte redovisas). Jacobsen Capital Managements största innehav är Vanguard Tax-Managed Funds - Vanguard FTSE Developed Markets ETF (US:VEA) , Vanguard Index Funds - Vanguard Growth ETF (US:VUG) , Vanguard Index Funds - Vanguard Value ETF (US:VTV) , Vanguard Index Funds - Vanguard Small-Cap Value ETF (US:VBR) , and Vanguard Index Funds - Vanguard Small-Cap Growth ETF (US:VBK) . Jacobsen Capital Managements nya positioner inkluderar GE Vernova Inc. (US:GEV) , BlackRock, Inc. (US:BLK) , CrowdStrike Holdings, Inc. (US:CRWD) , Elevance Health, Inc. (US:ELV) , and Lam Research Corporation (US:LRCX) .
Största ökningarna detta kvartal
Vi använder förändringen i portföljallokeringen eftersom det är det mest meningsfulla måttet. Förändringar kan bero på transaktioner eller förändringar i aktiekurser.
| Värdepapper | Aktier (MM) |
Värde (MM$) |
Portfölj % av | ΔPortfölj % av |
|---|---|---|---|---|
| 0,05 | 7,74 | 2,8490 | 0,7379 | |
| 0,02 | 7,83 | 2,8814 | 0,6406 | |
| 0,10 | 44,88 | 16,5228 | 0,3653 | |
| 0,01 | 2,55 | 0,9385 | 0,3331 | |
| 0,00 | 3,15 | 1,1611 | 0,2120 | |
| 0,02 | 4,04 | 1,4875 | 0,1669 | |
| 0,01 | 1,79 | 0,6581 | 0,1661 | |
| 0,02 | 5,17 | 1,9039 | 0,1416 | |
| 0,04 | 11,23 | 4,1335 | 0,1237 | |
| 0,00 | 0,32 | 0,1196 | 0,1196 |
Största minskningarna detta kvartal
Vi använder förändringen i portföljallokeringen eftersom det är det mest meningsfulla måttet. Förändringar kan bero på transaktioner eller förändringar i aktiepriser.
| Värdepapper | Aktier (MM) |
Värde (MM$) |
Portfölj % av | ΔPortfölj % av |
|---|---|---|---|---|
| 0,19 | 32,84 | 12,0890 | −1,6116 | |
| 0,03 | 7,11 | 2,6170 | −0,4132 | |
| 0,98 | 56,10 | 20,6535 | −0,4039 | |
| 0,04 | 5,72 | 2,1061 | −0,3868 | |
| 0,07 | 13,93 | 5,1276 | −0,3752 | |
| 0,06 | 4,72 | 1,7389 | −0,2935 | |
| 0,00 | 0,21 | 0,0783 | −0,2494 | |
| 0,03 | 2,60 | 0,9589 | −0,2147 | |
| 0,00 | 1,60 | 0,5884 | −0,1246 | |
| 0,00 | 0,64 | 0,2367 | −0,1150 |
13F- och fond arkiveringar
Denna blankett lämnades in den 2025-07-30 för rapporteringsperioden 2025-06-30. Klicka på länksymbolen för att se hela transaktionshistoriken.
Uppgradera för att låsa upp premiumdata och exportera till Excel![]() .
.
| Värdepapper | Typ | Genomsnittligt aktiepris | Aktier (MM) |
ΔAktier (%) |
ΔAktier (%) |
Värde ($MM) |
Portfölj (%) |
ΔPortfölj (%) |
|
|---|---|---|---|---|---|---|---|---|---|
| VEA / Vanguard Tax-Managed Funds - Vanguard FTSE Developed Markets ETF | 0,98 | 3,21 | 56,10 | 15,76 | 20,6535 | −0,4039 | |||
| VUG / Vanguard Index Funds - Vanguard Growth ETF | 0,10 | 2,08 | 44,88 | 20,69 | 16,5228 | 0,3653 | |||
| VTV / Vanguard Index Funds - Vanguard Value ETF | 0,19 | 1,78 | 32,84 | 4,14 | 12,0890 | −1,6116 | |||
| VBR / Vanguard Index Funds - Vanguard Small-Cap Value ETF | 0,07 | 5,05 | 13,93 | 9,97 | 5,1276 | −0,3752 | |||
| VBK / Vanguard Index Funds - Vanguard Small-Cap Growth ETF | 0,04 | 10,60 | 11,23 | 21,66 | 4,1335 | 0,1237 | |||
| SCHF / Schwab Strategic Trust - Schwab International Equity ETF | 0,41 | 3,97 | 9,11 | 16,16 | 3,3522 | −0,0536 | |||
| MSFT / Microsoft Corporation | 0,02 | 14,53 | 7,83 | 51,75 | 2,8814 | 0,6406 | |||
| NVDA / NVIDIA Corporation | 0,05 | 9,26 | 7,74 | 59,25 | 2,8490 | 0,7379 | |||
| AAPL / Apple Inc. | 0,03 | 10,35 | 7,11 | 1,92 | 2,6170 | −0,4132 | |||
| EXR / Extra Space Storage Inc. | 0,04 | 0,42 | 5,72 | −0,30 | 2,1061 | −0,3868 | |||
| VB / Vanguard Index Funds - Vanguard Small-Cap ETF | 0,02 | 19,30 | 5,17 | 27,49 | 1,9039 | 0,1416 | |||
| BIV / Vanguard Bond Index Funds - Vanguard Intermediate-Term Bond ETF | 0,06 | −0,03 | 4,72 | 0,98 | 1,7389 | −0,2935 | |||
| AMZN / Amazon.com, Inc. | 0,02 | 15,29 | 4,04 | 32,94 | 1,4875 | 0,1669 | |||
| GOOGL / Alphabet Inc. | 0,02 | 5,46 | 3,47 | 20,19 | 1,2758 | 0,0230 | |||
| META / Meta Platforms, Inc. | 0,00 | 12,74 | 3,15 | 44,37 | 1,1611 | 0,2120 | |||
| BSV / Vanguard Bond Index Funds - Vanguard Short-Term Bond ETF | 0,03 | −4,09 | 2,60 | −3,59 | 0,9589 | −0,2147 | |||
| AVGO / Broadcom Inc. | 0,01 | 11,13 | 2,55 | 82,99 | 0,9385 | 0,3331 | |||
| V / Visa Inc. | 0,01 | 11,14 | 1,97 | 12,61 | 0,7237 | −0,0349 | |||
| TSLA / Tesla, Inc. | 0,01 | 28,79 | 1,79 | 57,86 | 0,6581 | 0,1661 | |||
| BRK.B / Berkshire Hathaway Inc. | 0,00 | 6,78 | 1,60 | −2,56 | 0,5884 | −0,1246 | |||
| JPM / JPMorgan Chase & Co. | 0,01 | 7,38 | 1,54 | 26,96 | 0,5670 | 0,0398 | |||
| GOOG / Alphabet Inc. | 0,01 | 27,93 | 1,33 | 45,30 | 0,4891 | 0,0917 | |||
| MA / Mastercard Incorporated | 0,00 | 10,80 | 1,26 | 13,65 | 0,4628 | −0,0180 | |||
| LLY / Eli Lilly and Company | 0,00 | 15,86 | 1,22 | 9,34 | 0,4486 | −0,0355 | |||
| SCHX / Schwab Strategic Trust - Schwab U.S. Large-Cap ETF | 0,04 | 0,07 | 1,01 | 10,70 | 0,3736 | −0,0244 | |||
| HD / The Home Depot, Inc. | 0,00 | 15,20 | 0,99 | 15,35 | 0,3652 | −0,0088 | |||
| NFLX / Netflix, Inc. | 0,00 | 5,09 | 0,97 | 50,94 | 0,3559 | 0,0776 | |||
| WMT / Walmart Inc. | 0,01 | 13,71 | 0,94 | 26,68 | 0,3461 | 0,0236 | |||
| BKNG / Booking Holdings Inc. | 0,00 | −2,44 | 0,93 | 22,65 | 0,3410 | 0,0127 | |||
| XOM / Exxon Mobil Corporation | 0,01 | 41,10 | 0,88 | 27,93 | 0,3255 | 0,0251 | |||
| GLD / SPDR Gold Trust | 0,00 | 0,00 | 0,88 | 5,75 | 0,3252 | −0,0376 | |||
| SPGI / S&P Global Inc. | 0,00 | −0,06 | 0,87 | 3,72 | 0,3187 | −0,0440 | |||
| APH / Amphenol Corporation | 0,01 | −3,41 | 0,87 | 45,38 | 0,3186 | 0,0601 | |||
| GJR / Strats Trust For Procter & Gambel Security - Preferred Security | 0,01 | 7,53 | 0,81 | 0,63 | 0,2964 | −0,0516 | |||
| IWF / iShares Trust - iShares Russell 1000 Growth ETF | 0,00 | 0,42 | 0,80 | 18,06 | 0,2961 | 0,0002 | |||
| COST / Costco Wholesale Corporation | 0,00 | 7,55 | 0,78 | 12,65 | 0,2854 | −0,0138 | |||
| JNJ / Johnson & Johnson | 0,00 | 54,32 | 0,75 | 42,29 | 0,2751 | 0,0467 | |||
| ABBV / AbbVie Inc. | 0,00 | 11,65 | 0,68 | −1,16 | 0,2521 | −0,0488 | |||
| ORCL / Oracle Corporation | 0,00 | 10,04 | 0,65 | 72,22 | 0,2399 | 0,0754 | |||
| TMO / Thermo Fisher Scientific Inc. | 0,00 | −2,52 | 0,64 | −20,52 | 0,2367 | −0,1150 | |||
| GE / General Electric Company | 0,00 | 12,42 | 0,58 | 44,78 | 0,2144 | 0,0394 | |||
| KO / The Coca-Cola Company | 0,01 | 14,25 | 0,58 | 12,84 | 0,2138 | −0,0098 | |||
| SHW / The Sherwin-Williams Company | 0,00 | −5,01 | 0,57 | −6,53 | 0,2111 | −0,0556 | |||
| PLTR / Palantir Technologies Inc. | 0,00 | 13,62 | 0,57 | 83,65 | 0,2110 | 0,0753 | |||
| CSCO / Cisco Systems, Inc. | 0,01 | 30,32 | 0,56 | 46,60 | 0,2064 | 0,0401 | |||
| RTX / RTX Corporation | 0,00 | 3,11 | 0,53 | 13,68 | 0,1961 | −0,0075 | |||
| AMD / Advanced Micro Devices, Inc. | 0,00 | 20,76 | 0,53 | 66,67 | 0,1954 | 0,0571 | |||
| IBM / International Business Machines Corporation | 0,00 | 18,17 | 0,53 | 40,32 | 0,1948 | 0,0307 | |||
| PM / Philip Morris International Inc. | 0,00 | 18,61 | 0,50 | 36,24 | 0,1842 | 0,0245 | |||
| WFC / Wells Fargo & Company | 0,01 | 12,50 | 0,50 | 25,57 | 0,1826 | 0,0109 | |||
| SIVR / abrdn Silver ETF Trust - abrdn Physical Silver Shares ETF | 0,01 | 0,00 | 0,49 | 5,83 | 0,1804 | −0,0208 | |||
| INTU / Intuit Inc. | 0,00 | 11,45 | 0,48 | 43,03 | 0,1777 | 0,0310 | |||
| CRM / Salesforce, Inc. | 0,00 | 3,47 | 0,48 | 5,27 | 0,1764 | −0,0216 | |||
| ABT / Abbott Laboratories | 0,00 | 14,50 | 0,48 | 17,20 | 0,1759 | −0,0009 | |||
| TJX / The TJX Companies, Inc. | 0,00 | −4,47 | 0,47 | −3,08 | 0,1739 | −0,0380 | |||
| T / AT&T Inc. | 0,02 | 13,06 | 0,47 | 15,72 | 0,1736 | −0,0035 | |||
| BAC / Bank of America Corporation | 0,01 | 5,72 | 0,47 | 19,90 | 0,1732 | 0,0027 | |||
| NOW / ServiceNow, Inc. | 0,00 | 33,73 | 0,46 | 72,73 | 0,1680 | 0,0532 | |||
| LIN / Linde plc | 0,00 | 13,78 | 0,42 | 14,67 | 0,1555 | −0,0046 | |||
| UBER / Uber Technologies, Inc. | 0,00 | 25,89 | 0,39 | 61,67 | 0,1430 | 0,0383 | |||
| ADBE / Adobe Inc. | 0,00 | −1,63 | 0,37 | −0,80 | 0,1376 | −0,0261 | |||
| WMB / The Williams Companies, Inc. | 0,01 | 1,07 | 0,37 | 6,27 | 0,1373 | −0,0152 | |||
| VZ / Verizon Communications Inc. | 0,01 | 10,38 | 0,36 | 5,26 | 0,1328 | −0,0160 | |||
| MCD / McDonald's Corporation | 0,00 | 13,17 | 0,36 | 5,95 | 0,1312 | −0,0151 | |||
| NEE / NextEra Energy, Inc. | 0,01 | 26,93 | 0,35 | 24,37 | 0,1279 | 0,0065 | |||
| QCOM / QUALCOMM Incorporated | 0,00 | 9,32 | 0,35 | 13,49 | 0,1272 | −0,0052 | |||
| MS / Morgan Stanley | 0,00 | 9,72 | 0,34 | 32,17 | 0,1259 | 0,0137 | |||
| ETN / Eaton Corporation plc | 0,00 | 24,57 | 0,34 | 63,90 | 0,1239 | 0,0345 | |||
| BSX / Boston Scientific Corporation | 0,00 | 8,41 | 0,33 | 15,17 | 0,1233 | −0,0028 | |||
| ISRG / Intuitive Surgical, Inc. | 0,00 | 6,40 | 0,33 | 16,78 | 0,1230 | −0,0013 | |||
| GEV / GE Vernova Inc. | 0,00 | 0,32 | 0,1196 | 0,1196 | |||||
| MU / Micron Technology, Inc. | 0,00 | 12,22 | 0,32 | 58,82 | 0,1196 | 0,0309 | |||
| MRK / Merck & Co., Inc. | 0,00 | 30,55 | 0,32 | 15,36 | 0,1190 | −0,0030 | |||
| CAT / Caterpillar Inc. | 0,00 | 0,32 | 0,1188 | 0,1188 | |||||
| AXP / American Express Company | 0,00 | 12,00 | 0,30 | 32,89 | 0,1118 | 0,0124 | |||
| UNP / Union Pacific Corporation | 0,00 | 4,58 | 0,30 | 2,05 | 0,1102 | −0,0175 | |||
| PGR / The Progressive Corporation | 0,00 | 19,40 | 0,30 | 12,50 | 0,1094 | −0,0053 | |||
| PANW / Palo Alto Networks, Inc. | 0,00 | 8,28 | 0,30 | 30,26 | 0,1094 | 0,0100 | |||
| TXN / Texas Instruments Incorporated | 0,00 | −2,99 | 0,30 | 12,12 | 0,1090 | −0,0058 | |||
| DIS / The Walt Disney Company | 0,00 | 13,42 | 0,30 | 42,51 | 0,1088 | 0,0187 | |||
| XPRO / Expro Group Holdings N.V. | 0,00 | −1,42 | 0,29 | −23,26 | 0,1060 | −0,0565 | |||
| AMGN / Amgen Inc. | 0,00 | 18,90 | 0,28 | 6,42 | 0,1041 | −0,0112 | |||
| ACN / Accenture plc | 0,00 | −0,42 | 0,28 | −4,75 | 0,1037 | −0,0246 | |||
| ADP / Automatic Data Processing, Inc. | 0,00 | 3,78 | 0,28 | 4,49 | 0,1030 | −0,0130 | |||
| AMAT / Applied Materials, Inc. | 0,00 | 0,28 | 0,1022 | 0,1022 | |||||
| ANET / Arista Networks Inc | 0,00 | 0,27 | 0,1009 | 0,1009 | |||||
| BLK / BlackRock, Inc. | 0,00 | 0,27 | 0,1008 | 0,1008 | |||||
| SYK / Stryker Corporation | 0,00 | 21,89 | 0,27 | 29,67 | 0,0998 | 0,0089 | |||
| HON / Honeywell International Inc. | 0,00 | 11,94 | 0,27 | 22,94 | 0,0989 | 0,0041 | |||
| SO / The Southern Company | 0,00 | 18,15 | 0,27 | 18,14 | 0,0986 | −0,0000 | |||
| CRWD / CrowdStrike Holdings, Inc. | 0,00 | 0,27 | 0,0977 | 0,0977 | |||||
| ZTS / Zoetis Inc. | 0,00 | −6,66 | 0,26 | −11,71 | 0,0974 | −0,0326 | |||
| ELV / Elevance Health, Inc. | 0,00 | 0,26 | 0,0971 | 0,0971 | |||||
| LRCX / Lam Research Corporation | 0,00 | 0,26 | 0,0965 | 0,0965 | |||||
| PH / Parker-Hannifin Corporation | 0,00 | 10,81 | 0,26 | 27,23 | 0,0949 | 0,0069 | |||
| O / Realty Income Corporation | 0,00 | 0,88 | 0,25 | 0,40 | 0,0925 | −0,0165 | |||
| COF / Capital One Financial Corporation | 0,00 | 0,25 | 0,0918 | 0,0918 | |||||
| BR / Broadridge Financial Solutions, Inc. | 0,00 | −0,39 | 0,25 | −0,40 | 0,0908 | −0,0165 | |||
| GS / The Goldman Sachs Group, Inc. | 0,00 | 0,23 | 0,0842 | 0,0842 | |||||
| CMCSA / Comcast Corporation | 0,01 | 13,53 | 0,22 | 9,80 | 0,0827 | −0,0062 | |||
| CB / Chubb Limited | 0,00 | 5,31 | 0,22 | 0,90 | 0,0824 | −0,0139 | |||
| GILD / Gilead Sciences, Inc. | 0,00 | 0,22 | 0,0824 | 0,0824 | |||||
| ADSK / Autodesk, Inc. | 0,00 | 0,22 | 0,0806 | 0,0806 | |||||
| TT / Trane Technologies plc | 0,00 | 0,21 | 0,0791 | 0,0791 | |||||
| BA / The Boeing Company | 0,00 | 0,21 | 0,0789 | 0,0789 | |||||
| SWX / Southwest Gas Holdings, Inc. | 0,00 | 0,21 | 0,0789 | 0,0789 | |||||
| UNH / UnitedHealth Group Incorporated | 0,00 | −52,64 | 0,21 | −71,88 | 0,0783 | −0,2494 | |||
| KLAC / KLA Corporation | 0,00 | 0,21 | 0,0775 | 0,0775 | |||||
| TMUS / T-Mobile US, Inc. | 0,00 | 2,68 | 0,21 | −8,30 | 0,0774 | −0,0222 | |||
| SCHW / The Charles Schwab Corporation | 0,00 | 0,21 | 0,0771 | 0,0771 | |||||
| CME / CME Group Inc. | 0,00 | 0,21 | 0,0769 | 0,0769 | |||||
| LOW / Lowe's Companies, Inc. | 0,00 | 0,22 | 0,21 | −4,65 | 0,0758 | −0,0180 | |||
| BMY / Bristol-Myers Squibb Company | 0,00 | 0,20 | 0,0748 | 0,0748 | |||||
| MO / Altria Group, Inc. | 0,00 | 0,20 | 0,0741 | 0,0741 | |||||
| MDT / Medtronic plc | 0,00 | 0,20 | 0,0737 | 0,0737 | |||||
| PACS / PACS Group, Inc. | 0,01 | 0,19 | 0,0699 | 0,0699 | |||||
| CVX / Chevron Corporation | 0,00 | −100,00 | 0,00 | 0,0000 | |||||
| PFE / Pfizer Inc. | 0,00 | −100,00 | 0,00 | 0,0000 | |||||
| COP / ConocoPhillips | 0,00 | −100,00 | 0,00 | 0,0000 | |||||
| PEP / PepsiCo, Inc. | 0,00 | −100,00 | 0,00 | 0,0000 | |||||
| MMC / Marsh & McLennan Companies, Inc. | 0,00 | −100,00 | 0,00 | 0,0000 | |||||
| NEM / Newmont Corporation | 0,00 | −100,00 | 0,00 | 0,0000 |