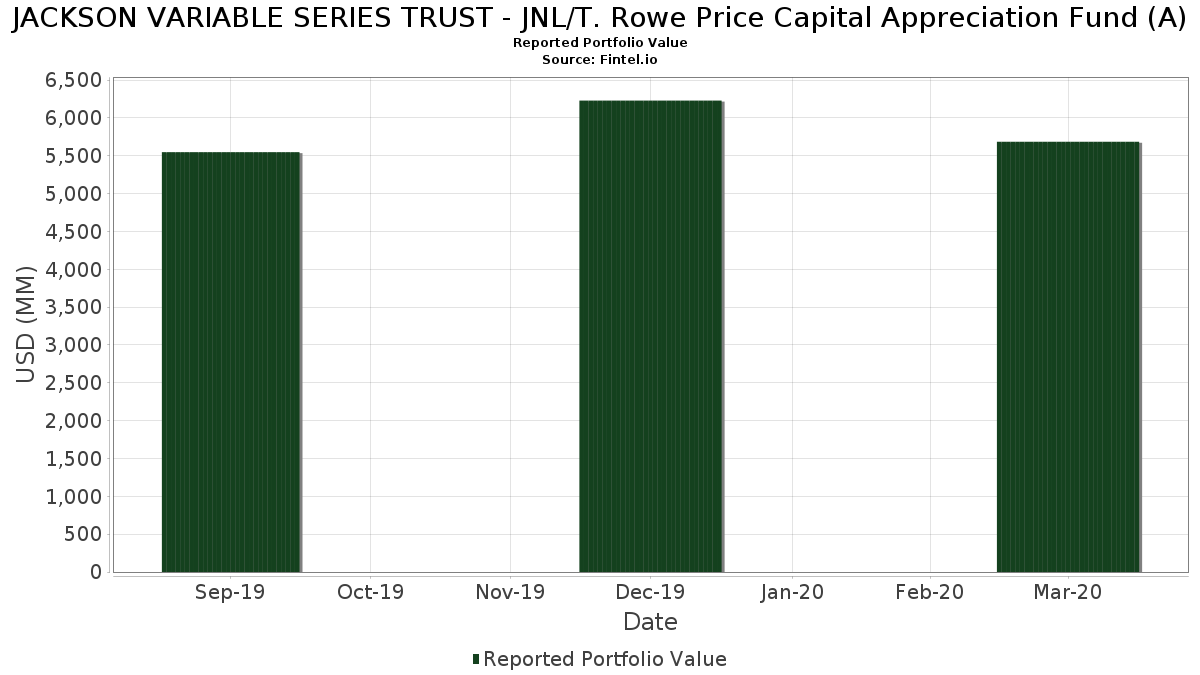
Grundläggande statistik
| Portföljvärde | $ 5 685 700 776 |
| Aktuella positioner | 215 |
Senaste innehav, resultat, förvaltat kapital (från 13F, 13D)
JACKSON VARIABLE SERIES TRUST - JNL/T. Rowe Price Capital Appreciation Fund (A) har redovisat 215 totala innehav i sina senaste SEC-arkiveringar. Det senaste portföljvärdet beräknas vara $ 5 685 700 776 USD. Faktiskt förvaltade tillgångar (AUM) är detta värde plus likvida medel (som inte redovisas). JACKSON VARIABLE SERIES TRUST - JNL/T. Rowe Price Capital Appreciation Fund (A)s största innehav är T. Rowe Price Government Reserve Fund (US:US76105Y1091) , Microsoft Corporation (US:MSFT) , Fiserv, Inc. (US:FISV) , General Electric Company (US:GE) , and Humana Inc. (US:HUM) . JACKSON VARIABLE SERIES TRUST - JNL/T. Rowe Price Capital Appreciation Fund (A)s nya positioner inkluderar Humana Inc. (US:HUM) , Raytheon Co. (US:RTN) , NiSource Inc. (US:NI) , Linedata Services S.A. (FR:LIN) , and Marriott International, Inc. (US:MAR) .
Största ökningarna detta kvartal
Vi använder förändringen i portföljallokeringen eftersom det är det mest meningsfulla måttet. Förändringar kan bero på transaktioner eller förändringar i aktiekurser.
| Värdepapper | Aktier (MM) |
Värde (MM$) |
Portfölj % av | ΔPortfölj % av |
|---|---|---|---|---|
| 0,58 | 181,77 | 3,1995 | 3,1995 | |
| 111,66 | 1,9653 | 1,9653 | ||
| 0,68 | 89,08 | 1,5680 | 1,5680 | |
| 5,96 | 144,54 | 2,5441 | 1,4173 | |
| 80,14 | 1,4106 | 1,4106 | ||
| 1,68 | 139,47 | 2,4549 | 1,3853 | |
| 1,04 | 83,19 | 1,4642 | 1,3554 | |
| 3,08 | 76,89 | 1,3534 | 1,2828 | |
| 0,34 | 58,07 | 1,0221 | 1,0221 | |
| 57,90 | 1,0191 | 1,0191 |
Största minskningarna detta kvartal
Vi använder förändringen i portföljallokeringen eftersom det är det mest meningsfulla måttet. Förändringar kan bero på transaktioner eller förändringar i aktiepriser.
| Värdepapper | Aktier (MM) |
Värde (MM$) |
Portfölj % av | ΔPortfölj % av |
|---|---|---|---|---|
| 468,45 | 468,45 | 8,2454 | −9,3654 | |
| 0,13 | 6,18 | 0,1088 | −1,6651 | |
| 0,65 | 104,48 | 1,8391 | −1,2996 | |
| 0,00 | 0,00 | −1,2930 | ||
| 0,00 | 0,00 | −1,0704 | ||
| 0,45 | 28,13 | 0,4951 | −1,0543 | |
| 0,00 | 0,00 | −0,7136 | ||
| 0,45 | 103,97 | 1,8300 | −0,6378 | |
| 1,95 | 146,49 | 2,5785 | −0,5887 | |
| 0,94 | 56,80 | 0,9998 | −0,5281 |
13F- och fond arkiveringar
Denna blankett lämnades in den 2020-05-28 för rapporteringsperioden 2020-03-31. Klicka på länksymbolen för att se hela transaktionshistoriken.
Uppgradera för att låsa upp premiumdata och exportera till Excel![]() .
.
| Värdepapper | Typ | Genomsnittligt aktiepris | Aktier (MM) |
ΔAktier (%) |
ΔAktier (%) |
Värde ($MM) |
Portfölj (%) |
ΔPortfölj (%) |
|
|---|---|---|---|---|---|---|---|---|---|
| US76105Y1091 / T. Rowe Price Government Reserve Fund | 468,45 | −57,12 | 468,45 | −57,12 | 8,2454 | −9,3654 | |||
| MSFT / Microsoft Corporation | 1,42 | −1,26 | 223,33 | −1,25 | 3,9310 | 0,2849 | |||
| FISV / Fiserv, Inc. | 2,31 | 36,49 | 219,70 | 12,13 | 3,8670 | 0,7081 | |||
| GE / General Electric Company | 27,24 | 37,95 | 216,33 | −1,85 | 3,8077 | 0,2543 | |||
| HUM / Humana Inc. | 0,58 | 181,77 | 3,1995 | 3,1995 | |||||
| MMC / Marsh & McLennan Companies, Inc. | 1,85 | 9,09 | 159,79 | −15,34 | 2,8125 | −0,2303 | |||
| PKI / Revvity Inc. | 1,95 | −3,82 | 146,49 | −25,43 | 2,5785 | −0,5887 | |||
| KDP / Keurig Dr Pepper Inc. | 5,96 | 146,68 | 144,54 | 106,80 | 2,5441 | 1,4173 | |||
| AMZN / Amazon.com, Inc. | 0,07 | 5,96 | 142,02 | 11,81 | 2,4998 | 0,4519 | |||
| NXPI / NXP Semiconductors N.V. | 1,68 | 211,51 | 139,47 | 136,75 | 2,4549 | 1,3853 | |||
| TMO / Thermo Fisher Scientific Inc. | 0,49 | 10,67 | 139,40 | −3,39 | 2,4537 | 0,1275 | |||
| DHR / Danaher Corporation | 1,00 | −4,07 | 138,45 | −13,49 | 2,4369 | −0,1433 | |||
| GOOG / Alphabet Inc. | 0,11 | 15,10 | 131,16 | 0,10 | 2,3087 | 0,1963 | |||
| FTV / Fortive Corporation | 2,31 | 37,16 | 127,61 | −0,91 | 2,2461 | 0,1700 | |||
| YUM / Yum! Brands, Inc. | 1,66 | 133,97 | 114,10 | 59,18 | 2,0083 | 0,8527 | |||
| Refinitiv US Holdings Inc. / LON (N/A) | 111,66 | 205,71 | 1,9653 | 1,9653 | |||||
| HLT / Hilton Worldwide Holdings Inc. | 1,57 | 109,83 | 107,27 | 29,10 | 1,8881 | 0,5486 | |||
| V / Visa Inc. | 0,65 | −37,41 | 104,48 | −46,33 | 1,8391 | −1,2996 | |||
| BDX / Becton, Dickinson and Company | 0,45 | −19,60 | 103,97 | −32,08 | 1,8300 | −0,6378 | |||
| META / Meta Platforms, Inc. | 0,62 | 52,11 | 103,52 | 23,61 | 1,8220 | 0,4719 | |||
| UNH / UnitedHealth Group Incorporated | 0,40 | 123,54 | 100,92 | 89,63 | 1,7764 | 0,9184 | |||
| ICE / Intercontinental Exchange, Inc. | 1,25 | 70,61 | 100,77 | 48,86 | 1,7737 | 0,6823 | |||
| ROP / Roper Technologies, Inc. | 0,31 | −17,48 | 97,03 | −27,36 | 1,7079 | −0,4457 | |||
| GPN / Global Payments Inc. | 0,62 | 10,34 | 89,84 | −12,83 | 1,5814 | −0,0802 | |||
| RTN / Raytheon Co. | 0,68 | 89,08 | 1,5680 | 1,5680 | |||||
| ALC / Alcon Inc. | 1,69 | 27,41 | 86,24 | 11,77 | 1,5180 | 0,1170 | |||
| AEP / American Electric Power Company, Inc. | 1,04 | 711,98 | 83,19 | 1 246,04 | 1,4642 | 1,3554 | |||
| Hub International Limited / LON (N/A) | 80,14 | 119,42 | 1,4106 | 1,4106 | |||||
| NI / NiSource Inc. | 3,08 | 19,02 | 76,89 | 1 816,07 | 1,3534 | 1,2828 | |||
| 0JZM / Maxim Integrated Products Inc | 1,53 | 24,73 | 74,57 | 4,70 | 1,3125 | 0,0194 | |||
| WFC.PRL / Wells Fargo & Company - Preferred Stock | 0,05 | 5,46 | 66,41 | −7,34 | 1,1690 | 0,0135 | |||
| LIN / Linedata Services S.A. | 0,34 | 58,07 | 1,0221 | 1,0221 | |||||
| Kronos Incorporated / LON (N/A) | 57,90 | 58,53 | 1,0191 | 1,0191 | |||||
| MAR / Marriott International, Inc. | 0,77 | 57,53 | 1,0126 | 1,0126 | |||||
| US05352AAC45 / Avantor Inc | 56,91 | 18,02 | 1,0017 | 0,2242 | |||||
| XEL / Xcel Energy Inc. | 0,94 | −36,90 | 56,80 | −40,07 | 0,9998 | −0,5281 | |||
| AEE / Ameren Corporation | 0,70 | 50,84 | 0,8948 | 0,8948 | |||||
| IR / Ingersoll Rand Inc. | 1,92 | 47,71 | 0,8397 | 0,8397 | |||||
| US64110LAT35 / Netflix Inc | 44,01 | 0,06 | 0,7747 | 0,0656 | |||||
| 46628D437 / JNL Government Money Market Fund | 43,21 | 132,05 | 43,21 | 132,04 | 0,7606 | 0,4603 | |||
| BDXA / Becton Dickinson & Co. 6.125% Preferred Series A | 0,76 | 4,84 | 39,60 | −16,27 | 0,6970 | −0,0654 | |||
| US83422AAA16 / Solera LLC / Solera Finance Inc | 37,38 | 12,45 | 0,6580 | 0,1220 | |||||
| US64110LAS51 / Netflix Inc | 36,74 | −11,46 | 0,6467 | −0,0223 | |||||
| AVTR / Avantor, Inc. | 0,81 | −53,95 | 35,27 | 59,86 | 0,6208 | 0,6208 | |||
| CCC Information Services, Inc. / LON (N/A) | 33,05 | −9,50 | 0,5818 | 0,5818 | |||||
| US1248EPBX05 / CCO Holdings LLC / CCO Holdings Capital Corp | 33,04 | 1,53 | 0,5815 | 0,0569 | |||||
| WCN / Waste Connections, Inc. | 0,39 | −41,15 | 29,93 | −49,77 | 0,5268 | −0,4337 | |||
| TEL / TE Connectivity plc | 0,45 | −51,23 | 28,13 | −67,04 | 0,4951 | −1,0543 | |||
| APTV / Aptiv PLC | 0,52 | −13,79 | 25,68 | −51,44 | 0,4521 | −0,5083 | |||
| US64110LAX47 / CORPORATE BONDS | 25,68 | −1,54 | 0,4520 | 0,0315 | |||||
| US369604BQ57 / General Electric Co. 5% Perpetual Bond | 25,66 | 43,78 | 0,4517 | 0,1639 | |||||
| US64110LAN64 / Netflix Inc | 23,20 | 14,72 | 0,4084 | 0,0823 | |||||
| US1248EPBT92 / CCO Holdings LLC / CCO Holdings Capital Corp | 22,74 | 9,57 | 0,4003 | 0,0657 | |||||
| AVTR / Avantor, Inc. | 1,77 | 33,41 | 22,06 | −8,19 | 0,3883 | 0,0009 | |||
| US48250NAC92 / KFC Holding Co/Pizza Hut Holdings LLC/Taco Bell of America LLC | 21,14 | 3,29 | 0,3720 | 0,0421 | |||||
| NVST / Envista Holdings Corporation | 1,41 | 8,58 | 21,04 | −45,27 | 0,3703 | −0,2495 | |||
| NEE / NextEra Energy, Inc. | 0,08 | −48,76 | 19,32 | −49,09 | 0,3400 | −0,2717 | |||
| CMS / CMS Energy Corporation | 0,75 | 0,00 | 18,94 | −7,54 | 0,3333 | 0,0031 | |||
| NEE.PRP / NextEra Energy, Inc. | 0,35 | 15,62 | 0,2750 | 0,2750 | |||||
| USI, Inc. / LON (N/A) | 15,38 | −57,90 | 0,2706 | 0,2706 | |||||
| LGC Group TL B 1L / LON (N/A) | 15,21 | −58,36 | 0,2677 | 0,2677 | |||||
| Sunshine Luxembourg VII SARL / LON (N/A) | 14,95 | −59,07 | 0,2632 | 0,2632 | |||||
| CMS / CMS Energy Corporation | 0,58 | −22,00 | 14,74 | −28,02 | 0,2595 | 0,2595 | |||
| Hub International Limited / LON (N/A) | 14,54 | −60,20 | 0,2559 | 0,2559 | |||||
| 46628D411 / JNL Securities Lending Collateral Fund | 14,51 | 12,64 | 14,51 | 12,64 | 0,2554 | 0,0477 | |||
| US48250NAB10 / KFC HLDG/PIZZA HUT/TACO BELL 5.25% 06/01/2026 144A | 13,11 | −4,63 | 0,2307 | 0,0091 | |||||
| CCC Information Services, Inc. / LON (N/A) | 11,64 | −68,12 | 0,2050 | 0,2050 | |||||
| US48250NAA37 / KFC HLDG/PIZZA HUT/TACO BELL 5.00% 06/01/2024 144A | 11,58 | 66,83 | 0,2037 | 0,0919 | |||||
| NVA Holdings, Inc. / LON (N/A) | 11,57 | −68,31 | 0,2037 | 0,2037 | |||||
| US05352AAA88 / Avantor, Inc. | 10,95 | −1,74 | 0,1927 | 0,0131 | |||||
| / Fortive Corporation 5.00% Mandatory Convertible Preferred Stock, Series A | 0,01 | 0,00 | 9,78 | −26,01 | 0,1721 | −0,0410 | |||
| US75625QAC33 / Reckitt Benckiser Treasury Services PLC | 9,77 | 22,62 | 0,1721 | 0,0435 | |||||
| US988498AH48 / Yum! Brands Inc 3.75 11/01/21 | 9,68 | −5,86 | 0,1703 | 0,0046 | |||||
| US988498AK76 / Yum! Brands Inc | 9,33 | 8,78 | 0,1643 | 0,0260 | |||||
| US64110LAL09 / Netflix Inc Bond | 9,33 | −5,43 | 0,1642 | 0,0052 | |||||
| US31740LAC72 / Refinitiv US Holdings Inc | 9,29 | −5,72 | 0,1636 | 0,0046 | |||||
| US65473QBE26 / NiSource Inc | 9,29 | −14,92 | 0,1634 | −0,0125 | |||||
| DUK / Duke Energy Corporation | 0,36 | 27,93 | 9,17 | 21,11 | 0,1615 | 0,1615 | |||
| US20605P1012 / Concho Resources, Inc. | 0,21 | 6,40 | 8,83 | −47,94 | 0,1554 | −0,1180 | |||
| DTE / DTE Energy Company | 0,37 | 0,00 | 8,80 | −9,34 | 0,1550 | 0,1550 | |||
| US693475AQ81 / Pnc Financial Se 5.000 11/01 Bond | 8,45 | −18,87 | 0,1487 | −0,0192 | |||||
| NI / NiSource Inc. | 0,33 | 0,00 | 8,37 | 108,65 | 0,1474 | 0,1474 | |||
| US78410GAB05 / SBA Communications Corp | 8,15 | −1,87 | 0,1435 | 0,0096 | |||||
| US1248EPBF98 / CCO HOLDINGS LLC/CAPITAL CORP 5.125% 05/01/2023 144A | 7,79 | −1,27 | 0,1370 | 0,0099 | |||||
| US150190AB26 / Cedar Fair LP / Canada's Wonderland Co / Magnum Management Corp / Millennium Op | 7,41 | −13,68 | 0,1304 | −0,0080 | |||||
| US31740LAA17 / Refinitiv US Holdings Inc | 7,35 | −4,29 | 0,1293 | 0,0056 | |||||
| US1248EPAY96 / CCO HOLDINGS LLC/CAPITAL CORP 5.25% 09/30/2022 | 7,25 | −12,42 | 0,1277 | −0,0059 | |||||
| US1248EPBP70 / CCO Holdings LLC / CCO Holdings Capital Corp | 7,07 | −1,61 | 0,1245 | 0,0086 | |||||
| SCE.PRJ / SCE Trust IV - Preferred Stock | 0,34 | −0,65 | 6,37 | −24,82 | 0,1120 | −0,0244 | |||
| AEP / American Electric Power Company, Inc. | 0,13 | −89,00 | 6,18 | −94,38 | 0,1088 | −1,6651 | |||
| US1248EPBZ52 / CCO Holdings LLC / CCO Holdings Capital Corp | 5,94 | −1,74 | 0,1045 | 0,0071 | |||||
| US65473QBF90 / NiSource, Inc. | 5,71 | −7,58 | 0,1004 | 0,0009 | |||||
| US064058AD28 / Bank of New York Mellon Corp., 5.20% Dep Shares Series C Non-Cumul Perp Preferred | 5,65 | −13,61 | 0,0994 | −0,0060 | |||||
| US988498AG64 / Yum! Brands Inc 3.875% Senior Notes 11/01/20 | 5,60 | −1,48 | 0,0986 | 0,0069 | |||||
| JPM / JPMorgan Chase & Co. | 0,22 | −45,44 | 5,53 | −49,40 | 0,0974 | 0,0974 | |||
| US988498AJ04 / Yum Brands Inc Bond | 5,16 | −8,20 | 0,0908 | 0,0002 | |||||
| US064058AF75 / Bank Of New York 4.625 3/20 Bond | 5,01 | −32,29 | 0,0882 | −0,0311 | |||||
| USB.PRP / U.S. Bancorp - Preferred Stock | 0,20 | 0,00 | 4,98 | −9,12 | 0,0877 | −0,0007 | |||
| US879369AE63 / Teleflex Inc | 4,88 | −5,06 | 0,0859 | 0,0030 | |||||
| US83001AAB89 / Six Flags Entertainment Corp. | 4,87 | 193,25 | 0,0856 | 0,0589 | |||||
| US337738AN81 / Fiserv Inc | 4,82 | −0,41 | 0,0848 | 0,0068 | |||||
| US761735AT63 / Reynolds Group Issuer Inc/llc/sa 5.125% 07/15/2023 144a Bond | 4,67 | −2,49 | 0,0821 | 0,0050 | |||||
| Emerald TopCo Inc / LON (N/A) | 4,60 | −87,42 | 0,0809 | 0,0809 | |||||
| US83001AAC62 / Six Flags Entertainment Corp | 4,51 | 635,40 | 0,0794 | 0,0695 | |||||
| US150191AJ35 / Cedar Fair LP / Canada's Wonderland Co / Magnum Management Corp | 4,26 | −4,81 | 0,0749 | 0,0028 | |||||
| US82967NAL29 / Sirius XM Radio Inc | 4,22 | −1,52 | 0,0743 | 0,0052 | |||||
| ST / Sensata Technologies Holding plc | 4,19 | −12,40 | 0,0738 | −0,0034 | |||||
| US527298BD49 / LEVEL 3 FINANCING INC COMPANY GUAR 08/22 5.375 | 4,03 | 0,12 | 0,0709 | 0,0060 | |||||
| US436440AK75 / Hologic Inc. | 4,03 | −14,16 | 0,0709 | −0,0047 | |||||
| NI / NiSource Inc. | 4,01 | −15,96 | 0,0706 | −0,0063 | |||||
| US28414HAF01 / Elanco Animal Health Inc | 3,96 | −1,76 | 0,0698 | 0,0047 | |||||
| US817565CB82 / CORPORATE BONDS | 3,87 | −1,28 | 0,0680 | 0,0049 | |||||
| Emerald TopCo Inc / LON (N/A) | 3,83 | −89,50 | 0,0675 | 0,0675 | |||||
| Hub International Limited / LON (N/A) | 3,82 | −89,54 | 0,0673 | 0,0673 | |||||
| Reckitt Benckiser Treasury Services PLC / DBT (US75625QAF63) | 3,80 | −0,21 | 0,0668 | 0,0055 | |||||
| Sunshine Luxembourg VII SARL / LON (N/A) | 3,54 | −90,30 | 0,0624 | 0,0624 | |||||
| Refinitiv US Holdings Inc. / LON (N/A) | 3,50 | −90,41 | 0,0617 | 0,0617 | |||||
| US776743AE68 / Roper Technologies Inc | 3,43 | −31,64 | 0,0603 | −0,0205 | |||||
| US761735AR08 / Reynolds Group Holdings, Inc. | 3,33 | −2,83 | 0,0587 | 0,0034 | |||||
| US25755TAH32 / Domino's Pizza Master Issuer LLC | 3,33 | −12,34 | 0,0587 | −0,0026 | |||||
| US78388JAV89 / SBA Communications Corp | 3,28 | −2,44 | 0,0577 | 0,0035 | |||||
| US25755TAJ97 / Domino's Pizza Master Issuer LLC | 3,26 | −6,35 | 0,0574 | 0,0013 | |||||
| US988498AD34 / Yum Brands! 6.875% Senior Notes 11/15/37 | 3,23 | −17,07 | 0,0568 | −0,0059 | |||||
| US78410GAC87 / SBA COMMUNICATIONS CORP SR UNSECURED 144A 02/27 3.875 | 2,96 | 0,0520 | 0,0520 | ||||||
| US64110LAE65 / Netflix, Inc. Bond | 2,90 | −2,19 | 0,0511 | 0,0033 | |||||
| US432833AB70 / Hilton Domestic Operating Co Inc | 2,89 | −8,33 | 0,0509 | 0,0000 | |||||
| Four Seasons Hotels Limited / LON (N/A) | 2,85 | −92,19 | 0,0502 | 0,0502 | |||||
| US032095AF85 / Amphenol Corp | 2,77 | 0,04 | 0,0487 | 0,0041 | |||||
| US30040WAC29 / Eversource Energy | 2,72 | −1,52 | 0,0479 | 0,0033 | |||||
| Delta 2 (LUX) S.a.r.l. / LON (N/A) | 2,71 | −92,59 | 0,0477 | 0,0477 | |||||
| ST / Sensata Technologies Holding plc | 2,64 | −8,95 | 0,0464 | −0,0003 | |||||
| US075887BU29 / Becton Dickinson and Co | 2,62 | −5,99 | 0,0461 | 0,0012 | |||||
| US25755TAL44 / Domino's Pizza Master Issuer LLC, Series 2019-1A, Class A2 | 2,61 | −11,62 | 0,0459 | −0,0017 | |||||
| US902973AZ90 / U.s. Bancorp 5.300 2/02 Bond | 2,56 | −22,17 | 0,0451 | −0,0080 | |||||
| US161175AX26 / Charter Communications Operating LLC / Charter Communications Operating Capital | 2,54 | −0,12 | 0,0447 | 0,0037 | |||||
| US822582BH45 / Shell International Finance BV | 2,31 | −68,35 | 0,0407 | −0,0770 | |||||
| US879369AF39 / Teleflex Inc | 2,20 | −24,60 | 0,0387 | −0,0083 | |||||
| US81727TAA60 / Sensata Technologies UK Financing Co PLC | 2,19 | −9,37 | 0,0385 | −0,0004 | |||||
| US075887BT55 / Becton Dickinson and Co | 2,12 | −76,85 | 0,0373 | −0,1102 | |||||
| US95058XAD03 / Wendy's Funding LLC | 2,09 | −9,56 | 0,0368 | −0,0005 | |||||
| US67059TAB17 / Nustar Logistics Lp 4.8% 09/01/20 | 1,91 | −13,97 | 0,0336 | −0,0022 | |||||
| US44332PAD33 / HUB International Ltd. | 1,90 | 0,0335 | 0,0335 | ||||||
| US8085134026 / Schwab Charles Corp, 6.00% Dep Shares Non-cumul Perp Preferred Stock Series C | 0,07 | 0,00 | 1,89 | −2,92 | 0,0333 | 0,0019 | |||
| US857477AQ64 / State Street Cor 5.250 12/29/49 Bond | 1,87 | −14,88 | 0,0329 | −0,0025 | |||||
| US150190AC09 / Cedar Fair LP | 1,83 | 0,0322 | 0,0322 | ||||||
| US87264AAM71 / T MOBILE USA INC COMPANY GUAR 03/23 6 | 1,82 | −1,19 | 0,0321 | 0,0024 | |||||
| US563568AB08 / Welbilt Inc | 1,76 | −19,66 | 0,0309 | −0,0043 | |||||
| Ultimate Software Group Inc(The) / LON (N/A) | 1,75 | −95,22 | 0,0307 | 0,0307 | |||||
| US64110LAJ52 / Netflix Inc | 1,65 | −25,14 | 0,0291 | −0,0065 | |||||
| CPI Holdco, LLC / LON (N/A) | 1,61 | −95,60 | 0,0283 | 0,0283 | |||||
| US571900BA65 / Marriott International, Inc. | 1,47 | −1,21 | 0,0259 | 0,0019 | |||||
| ALBMP / Alabama Power 5.5% Senior Notes 10/15/17 | 0,06 | 0,00 | 1,41 | −5,64 | 0,0247 | 0,0007 | |||
| AmWINS Group, Inc. / LON (N/A) | 1,29 | −96,48 | 0,0226 | 0,0226 | |||||
| ELAN / Elanco Animal Health Incorporated | 0,03 | 1,26 | 0,0221 | 0,0221 | |||||
| US30040WAG33 / Eversource Energy | 1,20 | −1,47 | 0,0212 | 0,0015 | |||||
| Four Seasons Hotels Limited / LON (N/A) | 1,12 | −96,93 | 0,0198 | 0,0198 | |||||
| US50067PAA75 / Korn Ferry | 1,12 | −13,50 | 0,0197 | −0,0011 | |||||
| RPIFX / T. Rowe Price Institutional Income Funds Inc - T. Rowe Price Institutional Floating Rate Fund | 0,13 | 1,17 | 1,10 | −12,98 | 0,0194 | −0,0010 | |||
| TMCM / T MOBILE USA INC COMPANY GUAR 01/26 6.5 | 1,08 | −2,18 | 0,0189 | 0,0012 | |||||
| H.B. Fuller Company / LON (N/A) | 0,93 | −97,46 | 0,0163 | 0,0163 | |||||
| US91739VAA61 / USI, Inc. | 0,92 | 0,0162 | 0,0162 | ||||||
| USI, Inc. / LON (N/A) | 0,79 | −97,85 | 0,0139 | 0,0139 | |||||
| US205887BX94 / Conagra Brands Inc | 0,78 | −48,51 | 0,0137 | −0,0107 | |||||
| Gartner, Inc. / LON (N/A) | 0,78 | −97,87 | 0,0137 | 0,0137 | |||||
| ST / Sensata Technologies Holding plc | 0,65 | −12,60 | 0,0115 | −0,0006 | |||||
| USB.PRM / U.S. Bancorp, 6.50% Fixed/Float Dep Shares Non-Cumul Perp Preferred Stock, F | 0,03 | 0,00 | 0,64 | −6,67 | 0,0113 | 0,0002 | |||
| Hub International Limited / LON (N/A) | 0,59 | −98,40 | 0,0103 | 0,0103 | |||||
| Hub International Limited / LON (N/A) | 0,49 | −98,67 | 0,0086 | 0,0086 | |||||
| US35803QAA58 / Fresenius Medical Care US Finance Inc | 0,39 | −2,03 | 0,0068 | 0,0005 | |||||
| US526107AD92 / Lennox Interntnl In Bond | 0,33 | −4,36 | 0,0058 | 0,0003 | |||||
| US256746AE84 / Dollar Tree, Inc. | 0,32 | −66,67 | 0,0055 | −0,0097 | |||||
| US90345WAD65 / Us Airways 4.625% 06/03/25 | 0,30 | −9,82 | 0,0053 | −0,0001 | |||||
| AmWINS Group, Inc. / LON (N/A) | 0,26 | −99,30 | 0,0045 | 0,0045 | |||||
| US98419MAJ99 / Xylem Inc/NY | 0,22 | −15,18 | 0,0038 | −0,0003 | |||||
| Hub International Limited / LON (N/A) | 0,20 | −99,44 | 0,0036 | 0,0036 | |||||
| US90346WAA18 / US Airways 2013-1 Class A Pass Through Trust | 0,18 | −8,96 | 0,0032 | −0,0000 | |||||
| SCE.PRH / SCE Trust III - Preferred Security | 0,01 | −76,81 | 0,16 | −81,28 | 0,0028 | −0,0110 | |||
| US98419MAB63 / Xylem, Inc. | 0,13 | −0,77 | 0,0023 | 0,0002 | |||||
| US90345WAE49 / Us Airways 6.75% 06/03/21 | 0,12 | −5,69 | 0,0020 | 0,0001 | |||||
| SCHW.PRD / The Charles Schwab Corporation - Preferred Stock | 0,00 | 0,00 | 0,10 | −5,66 | 0,0018 | 0,0001 | |||
| Prestige Brands, Inc. / LON (N/A) | 0,09 | −99,76 | 0,0016 | 0,0016 | |||||
| US210795PZ71 / Continental Airlines 2012-1 Class A Pass Through Trust | 0,01 | −7,14 | 0,0002 | 0,0000 | |||||
| GOOGL / Alphabet Inc. | 0,00 | −99,92 | 0,01 | −99,94 | 0,0001 | −0,1710 | |||
| AWK / American Water Works Company, Inc. | 0,00 | −100,00 | 0,00 | −100,00 | −0,7136 | ||||
| SPGI / S&P Global Inc. | 0,00 | −100,00 | 0,00 | −100,00 | −1,2930 | ||||
| ES / Eversource Energy | 0,00 | −100,00 | 0,00 | −100,00 | −0,5142 | ||||
| AMT / American Tower Corporation | 0,00 | −100,00 | 0,00 | −100,00 | −0,0668 | ||||
| MCD / McDonald's Corporation | 0,00 | −100,00 | 0,00 | −100,00 | −0,2616 | ||||
| PNC / The PNC Financial Services Group, Inc. | 0,00 | −100,00 | 0,00 | −100,00 | −0,2491 | ||||
| TXN / Texas Instruments Incorporated | 0,00 | −100,00 | 0,00 | −100,00 | −1,0704 | ||||
| OPTION / DE (N/A) | −0,01 | −100,02 | −0,0001 | −0,0001 | |||||
| OPTION / DE (N/A) | −0,01 | −100,03 | −0,0002 | −0,0002 | |||||
| OPTION / DE (N/A) | −0,01 | −100,03 | −0,0002 | −0,0002 | |||||
| OPTION / DE (N/A) | −0,01 | −100,03 | −0,0002 | −0,0002 | |||||
| OPTION / DE (N/A) | −0,01 | −100,03 | −0,0002 | −0,0002 | |||||
| OPTION / DE (N/A) | −0,01 | −100,04 | −0,0003 | −0,0003 | |||||
| OPTION / DE (N/A) | −0,02 | −100,04 | −0,0003 | −0,0003 | |||||
| OPTION / DE (N/A) | −0,02 | −100,04 | −0,0003 | −0,0003 | |||||
| OPTION / DE (N/A) | −0,02 | −100,04 | −0,0003 | −0,0003 | |||||
| OPTION / DE (N/A) | −0,02 | −100,04 | −0,0003 | −0,0003 | |||||
| OPTION / DE (N/A) | −0,02 | −100,05 | −0,0004 | −0,0004 | |||||
| OPTION / DE (N/A) | −0,02 | −100,06 | −0,0004 | −0,0004 | |||||
| OPTION / DE (N/A) | −0,02 | −100,07 | −0,0004 | −0,0004 | |||||
| OPTION / DE (N/A) | −0,03 | −100,07 | −0,0005 | −0,0005 | |||||
| OPTION / DE (N/A) | −0,03 | −100,08 | −0,0005 | −0,0005 | |||||
| OPTION / DE (N/A) | −0,04 | −100,11 | −0,0008 | −0,0008 | |||||
| OPTION / DE (N/A) | −0,05 | −100,13 | −0,0009 | −0,0009 | |||||
| OPTION / DE (N/A) | −0,09 | −100,25 | −0,0016 | −0,0016 | |||||
| OPTION / DE (N/A) | −0,10 | −100,27 | −0,0017 | −0,0017 | |||||
| OPTION / DE (N/A) | −0,12 | −100,33 | −0,0021 | −0,0021 | |||||
| OPTION / DE (N/A) | −0,13 | −100,34 | −0,0022 | −0,0022 | |||||
| OPTION / DE (N/A) | −0,13 | −100,35 | −0,0023 | −0,0023 | |||||
| OPTION / DE (N/A) | −0,14 | −100,37 | −0,0024 | −0,0024 | |||||
| OPTION / DE (N/A) | −0,14 | −100,38 | −0,0025 | −0,0025 | |||||
| OPTION / DE (N/A) | −0,16 | −100,43 | −0,0028 | −0,0028 | |||||
| OPTION / DE (N/A) | −0,18 | −100,48 | −0,0031 | −0,0031 | |||||
| OPTION / DE (N/A) | −0,22 | −100,59 | −0,0038 | −0,0038 | |||||
| OPTION / DE (N/A) | −0,25 | −100,67 | −0,0043 | −0,0043 | |||||
| OPTION / DE (N/A) | −0,27 | −100,74 | −0,0048 | −0,0048 | |||||
| OPTION / DE (N/A) | −0,49 | −101,35 | −0,0087 | −0,0087 | |||||
| OPTION / DE (N/A) | −3,97 | −110,86 | −0,0698 | −0,0698 | |||||
| OPTION / DE (N/A) | −4,14 | −111,33 | −0,0728 | −0,0728 |