Grundläggande statistik
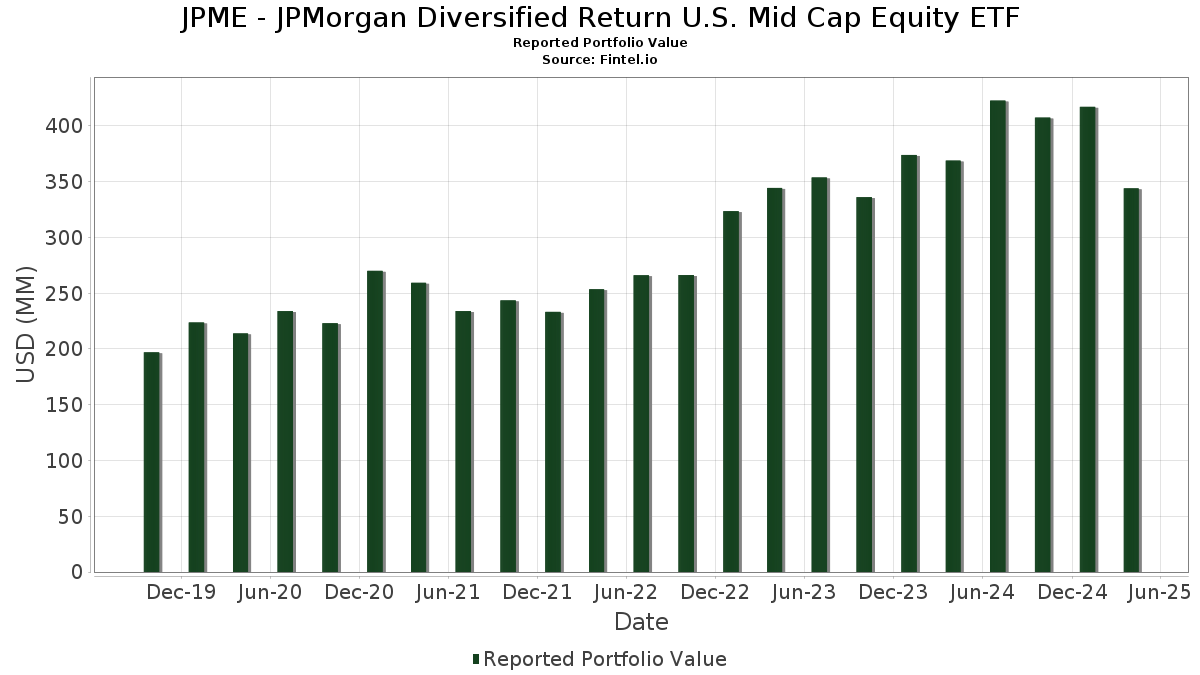
| Portföljvärde | $ 344 085 912 |
| Aktuella positioner | 350 |
Senaste innehav, resultat, förvaltat kapital (från 13F, 13D)
JPME - JPMorgan Diversified Return U.S. Mid Cap Equity ETF har redovisat 350 totala innehav i sina senaste SEC-arkiveringar. Det senaste portföljvärdet beräknas vara $ 344 085 912 USD. Faktiskt förvaltade tillgångar (AUM) är detta värde plus likvida medel (som inte redovisas). JPME - JPMorgan Diversified Return U.S. Mid Cap Equity ETFs största innehav är NRG Energy, Inc. (US:NRG) , Royal Gold, Inc. (US:RGLD) , United States Steel Corporation (US:X) , Encompass Health Corporation (US:EHC) , and Casey's General Stores, Inc. (US:CASY) . JPME - JPMorgan Diversified Return U.S. Mid Cap Equity ETFs nya positioner inkluderar GoDaddy Inc. (US:GDDY) , Fox Corporation (US:FOXA) , Genpact Limited (US:G) , Valmont Industries, Inc. (US:VMI) , and .
Största ökningarna detta kvartal
Vi använder förändringen i portföljallokeringen eftersom det är det mest meningsfulla måttet. Förändringar kan bero på transaktioner eller förändringar i aktiekurser.
| Värdepapper | Aktier (MM) |
Värde (MM$) |
Portfölj % av | ΔPortfölj % av |
|---|---|---|---|---|
| 0,01 | 1,54 | 0,4470 | 0,4470 | |
| 0,01 | 0,89 | 0,2581 | 0,2581 | |
| 1,20 | 1,20 | 0,3506 | 0,2192 | |
| 0,01 | 0,68 | 0,1992 | 0,1992 | |
| 0,01 | 1,69 | 0,4928 | 0,1945 | |
| 0,90 | 0,90 | 0,2611 | 0,1747 | |
| 0,02 | 1,37 | 0,3975 | 0,1722 | |
| 0,04 | 1,41 | 0,4099 | 0,1426 | |
| 0,04 | 1,69 | 0,4925 | 0,1400 | |
| 0,01 | 0,64 | 0,1860 | 0,1285 |
Största minskningarna detta kvartal
Vi använder förändringen i portföljallokeringen eftersom det är det mest meningsfulla måttet. Förändringar kan bero på transaktioner eller förändringar i aktiepriser.
| Värdepapper | Aktier (MM) |
Värde (MM$) |
Portfölj % av | ΔPortfölj % av |
|---|---|---|---|---|
| 0,00 | 0,00 | −0,3185 | ||
| 0,00 | 0,31 | 0,0917 | −0,2940 | |
| 0,00 | 0,15 | 0,0440 | −0,2171 | |
| 0,00 | 0,00 | −0,2113 | ||
| 0,01 | 0,32 | 0,0922 | −0,1660 | |
| 0,00 | 0,00 | −0,1287 | ||
| 0,01 | 1,17 | 0,3392 | −0,1173 | |
| 0,01 | 0,91 | 0,2661 | −0,1031 | |
| 0,01 | 0,88 | 0,2552 | −0,1030 | |
| 0,02 | 1,05 | 0,3044 | −0,1027 |
13F- och fond arkiveringar
Denna blankett lämnades in den 2025-06-24 för rapporteringsperioden 2025-04-30. Klicka på länksymbolen för att se hela transaktionshistoriken.
Uppgradera för att låsa upp premiumdata och exportera till Excel![]() .
.
| Värdepapper | Typ | Genomsnittligt aktiepris | Aktier (MM) |
ΔAktier (%) |
ΔAktier (%) |
Värde ($MM) |
Portfölj (%) |
ΔPortfölj (%) |
|
|---|---|---|---|---|---|---|---|---|---|
| NRG / NRG Energy, Inc. | 0,02 | −6,76 | 1,78 | −0,22 | 0,5182 | 0,0903 | |||
| RGLD / Royal Gold, Inc. | 0,01 | 4,12 | 1,69 | 36,01 | 0,4928 | 0,1945 | |||
| X / United States Steel Corporation | 0,04 | −2,98 | 1,69 | 15,03 | 0,4925 | 0,1400 | |||
| EHC / Encompass Health Corporation | 0,01 | −15,08 | 1,67 | 0,06 | 0,4869 | 0,0862 | |||
| CASY / Casey's General Stores, Inc. | 0,00 | −12,81 | 1,65 | −4,35 | 0,4804 | 0,0667 | |||
| COR / Cencora, Inc. | 0,01 | −19,39 | 1,64 | −7,18 | 0,4778 | 0,0538 | |||
| VST / Vistra Corp. | 0,01 | 14,55 | 1,62 | −11,63 | 0,4714 | 0,0321 | |||
| CAH / Cardinal Health, Inc. | 0,01 | −17,55 | 1,59 | −5,81 | 0,4631 | 0,0582 | |||
| THC / Tenet Healthcare Corporation | 0,01 | −10,23 | 1,59 | −8,89 | 0,4625 | 0,0443 | |||
| WMB / The Williams Companies, Inc. | 0,03 | −13,88 | 1,55 | −8,96 | 0,4524 | 0,0429 | |||
| EXC / Exelon Corporation | 0,03 | −3,33 | 1,55 | 13,28 | 0,4520 | 0,1236 | |||
| ED / Consolidated Edison, Inc. | 0,01 | −14,64 | 1,55 | 2,65 | 0,4508 | 0,0892 | |||
| KR / The Kroger Co. | 0,02 | −27,02 | 1,55 | −14,50 | 0,4497 | 0,0165 | |||
| ATO / Atmos Energy Corporation | 0,01 | −21,06 | 1,54 | −11,05 | 0,4480 | 0,0333 | |||
| DTM / DT Midstream, Inc. | 0,02 | −5,52 | 1,54 | −9,10 | 0,4477 | 0,0419 | |||
| PPL / PPL Corporation | 0,04 | −17,58 | 1,54 | −10,48 | 0,4475 | 0,0358 | |||
| GDDY / GoDaddy Inc. | 0,01 | 1,54 | 0,4470 | 0,4470 | |||||
| CNM / Core & Main, Inc. | 0,03 | −7,54 | 1,52 | −13,73 | 0,4430 | 0,0202 | |||
| EVRG / Evergy, Inc. | 0,02 | −18,74 | 1,50 | −12,51 | 0,4380 | 0,0258 | |||
| LNG / Cheniere Energy, Inc. | 0,01 | −17,41 | 1,50 | −14,64 | 0,4362 | 0,0152 | |||
| BRBR / BellRing Brands, Inc. | 0,02 | −7,00 | 1,49 | −7,26 | 0,4350 | 0,0487 | |||
| XEL / Xcel Energy Inc. | 0,02 | −15,19 | 1,49 | −10,75 | 0,4350 | 0,0335 | |||
| HIG / The Hartford Insurance Group, Inc. | 0,01 | −14,40 | 1,48 | −5,84 | 0,4318 | 0,0540 | |||
| DTE / DTE Energy Company | 0,01 | −17,66 | 1,48 | −5,91 | 0,4309 | 0,0538 | |||
| OHI / Omega Healthcare Investors, Inc. | 0,04 | −7,05 | 1,47 | −2,06 | 0,4292 | 0,0683 | |||
| STLD / Steel Dynamics, Inc. | 0,01 | −9,29 | 1,47 | −8,22 | 0,4290 | 0,0440 | |||
| NFG / National Fuel Gas Company | 0,02 | −26,37 | 1,47 | −19,29 | 0,4278 | −0,0087 | |||
| PNW / Pinnacle West Capital Corporation | 0,02 | −15,45 | 1,47 | −7,44 | 0,4274 | 0,0470 | |||
| ETR / Entergy Corporation | 0,02 | −22,88 | 1,47 | −20,92 | 0,4273 | −0,0176 | |||
| COKE / Coca-Cola Consolidated, Inc. | 0,00 | −18,15 | 1,47 | −18,87 | 0,4270 | −0,0064 | |||
| HPE / Hewlett Packard Enterprise Company | 0,09 | 52,10 | 1,47 | 16,35 | 0,4270 | 0,1249 | |||
| OGE / OGE Energy Corp. | 0,03 | −20,50 | 1,47 | −14,57 | 0,4268 | 0,0153 | |||
| UHS / Universal Health Services, Inc. | 0,01 | −6,59 | 1,46 | −12,28 | 0,4264 | 0,0260 | |||
| ACI / Albertsons Companies, Inc. | 0,07 | −1,83 | 1,46 | 7,65 | 0,4263 | 0,1000 | |||
| RMD / ResMed Inc. | 0,01 | −13,31 | 1,46 | −13,14 | 0,4254 | 0,0220 | |||
| JBL / Jabil Inc. | 0,01 | −3,05 | 1,46 | −12,51 | 0,4253 | 0,0249 | |||
| WEC / WEC Energy Group, Inc. | 0,01 | −23,95 | 1,46 | −16,09 | 0,4251 | 0,0079 | |||
| PFGC / Performance Food Group Company | 0,02 | −5,44 | 1,46 | −15,56 | 0,4251 | 0,0106 | |||
| UI / Ubiquiti Inc. | 0,00 | 4,98 | 1,45 | −15,08 | 0,4231 | 0,0128 | |||
| FMC / FMC Corporation | 0,03 | 52,81 | 1,45 | 14,79 | 0,4226 | 0,1195 | |||
| MTG / MGIC Investment Corporation | 0,06 | −9,72 | 1,45 | −11,99 | 0,4212 | 0,0272 | |||
| KMI / Kinder Morgan, Inc. | 0,06 | −12,43 | 1,45 | −16,22 | 0,4211 | 0,0073 | |||
| CMS / CMS Energy Corporation | 0,02 | −18,35 | 1,45 | −8,89 | 0,4208 | 0,0404 | |||
| CF / CF Industries Holdings, Inc. | 0,02 | −5,52 | 1,44 | −19,73 | 0,4205 | −0,0108 | |||
| DGX / Quest Diagnostics Incorporated | 0,01 | −24,95 | 1,44 | −18,01 | 0,4203 | −0,0018 | |||
| ORI / Old Republic International Corporation | 0,04 | −16,17 | 1,44 | −13,85 | 0,4202 | 0,0186 | |||
| NI / NiSource Inc. | 0,04 | −20,83 | 1,44 | −16,97 | 0,4201 | 0,0033 | |||
| AR / Antero Resources Corporation | 0,04 | −5,57 | 1,44 | −11,87 | 0,4194 | 0,0274 | |||
| EXEL / Exelixis, Inc. | 0,04 | −23,56 | 1,44 | −9,72 | 0,4194 | 0,0368 | |||
| K / Kellanova | 0,02 | −12,43 | 1,44 | −11,31 | 0,4179 | 0,0298 | |||
| FAST / Fastenal Company | 0,02 | −17,29 | 1,44 | −8,54 | 0,4178 | 0,0415 | |||
| AFL / Aflac Incorporated | 0,01 | −15,26 | 1,43 | −14,19 | 0,4171 | 0,0165 | |||
| USFD / US Foods Holding Corp. | 0,02 | −9,14 | 1,43 | −15,86 | 0,4169 | 0,0087 | |||
| TSN / Tyson Foods, Inc. | 0,02 | −10,51 | 1,43 | −2,99 | 0,4164 | 0,0629 | |||
| JNPR / Juniper Networks, Inc. | 0,04 | −16,40 | 1,43 | −12,87 | 0,4160 | 0,0226 | |||
| AM / Antero Midstream Corporation | 0,09 | −23,02 | 1,43 | −20,56 | 0,4152 | −0,0154 | |||
| AJG / Arthur J. Gallagher & Co. | 0,00 | −21,06 | 1,42 | −16,14 | 0,4130 | 0,0075 | |||
| PPC / Pilgrim's Pride Corporation | 0,03 | −23,37 | 1,42 | −10,15 | 0,4126 | 0,0345 | |||
| RS / Reliance, Inc. | 0,00 | −7,06 | 1,41 | −7,46 | 0,4117 | 0,0452 | |||
| UGI / UGI Corporation | 0,04 | −30,76 | 1,41 | −26,10 | 0,4105 | −0,0471 | |||
| RPRX / Royalty Pharma plc | 0,04 | 21,50 | 1,41 | 26,28 | 0,4099 | 0,1426 | |||
| INGR / Ingredion Incorporated | 0,01 | −10,84 | 1,40 | −13,20 | 0,4078 | 0,0208 | |||
| PWR / Quanta Services, Inc. | 0,00 | −8,72 | 1,40 | −13,15 | 0,4077 | 0,0211 | |||
| APP / AppLovin Corporation | 0,01 | 18,96 | 1,40 | −13,32 | 0,4073 | 0,0203 | |||
| UNM / Unum Group | 0,02 | −21,96 | 1,40 | −20,50 | 0,4064 | −0,0147 | |||
| FE / FirstEnergy Corp. | 0,03 | −11,69 | 1,39 | −4,86 | 0,4051 | 0,0545 | |||
| CIEN / Ciena Corporation | 0,02 | −11,50 | 1,39 | −31,78 | 0,4049 | −0,0840 | |||
| CHTR / Charter Communications, Inc. | 0,00 | −16,78 | 1,39 | −5,64 | 0,4046 | 0,0516 | |||
| LNT / Alliant Energy Corporation | 0,02 | −17,96 | 1,39 | −14,96 | 0,4038 | 0,0128 | |||
| PEG / Public Service Enterprise Group Incorporated | 0,02 | −10,63 | 1,38 | −14,54 | 0,4023 | 0,0148 | |||
| FYBR / Frontier Communications Parent, Inc. | 0,04 | −13,37 | 1,38 | −12,21 | 0,4022 | 0,0250 | |||
| AVB / AvalonBay Communities, Inc. | 0,01 | −9,81 | 1,38 | −14,52 | 0,4014 | 0,0147 | |||
| DVA / DaVita Inc. | 0,01 | −9,35 | 1,38 | −27,18 | 0,4009 | −0,0525 | |||
| FFIV / F5, Inc. | 0,01 | 3,68 | 1,37 | −7,67 | 0,3996 | 0,0432 | |||
| POST / Post Holdings, Inc. | 0,01 | −12,28 | 1,37 | −6,48 | 0,3994 | 0,0476 | |||
| WPC / W. P. Carey Inc. | 0,02 | 30,14 | 1,37 | 45,37 | 0,3975 | 0,1722 | |||
| LH / Labcorp Holdings Inc. | 0,01 | −1,50 | 1,36 | −4,95 | 0,3969 | 0,0529 | |||
| IFF / International Flavors & Fragrances Inc. | 0,02 | 19,52 | 1,36 | 7,68 | 0,3959 | 0,0931 | |||
| REG / Regency Centers Corporation | 0,02 | −9,90 | 1,36 | −9,52 | 0,3959 | 0,0357 | |||
| UTHR / United Therapeutics Corporation | 0,00 | −3,15 | 1,36 | −16,43 | 0,3955 | 0,0058 | |||
| TRGP / Targa Resources Corp. | 0,01 | −11,61 | 1,35 | −23,24 | 0,3934 | −0,0287 | |||
| TPL / Texas Pacific Land Corporation | 0,00 | −18,32 | 1,35 | −18,87 | 0,3932 | −0,0058 | |||
| AMP / Ameriprise Financial, Inc. | 0,00 | −7,04 | 1,35 | −19,46 | 0,3930 | −0,0087 | |||
| HBAN / Huntington Bancshares Incorporated | 0,09 | −5,43 | 1,35 | −20,12 | 0,3921 | −0,0121 | |||
| TPR / Tapestry, Inc. | 0,02 | −31,54 | 1,34 | −33,70 | 0,3902 | −0,0944 | |||
| FCNCA / First Citizens BancShares, Inc. | 0,00 | −3,84 | 1,34 | −22,45 | 0,3894 | −0,0239 | |||
| OMF / OneMain Holdings, Inc. | 0,03 | −5,45 | 1,34 | −19,92 | 0,3889 | −0,0108 | |||
| CBRE / CBRE Group, Inc. | 0,01 | −12,69 | 1,33 | −26,30 | 0,3884 | −0,0457 | |||
| TAP / Molson Coors Beverage Company | 0,02 | −17,20 | 1,33 | −13,00 | 0,3880 | 0,0207 | |||
| PR / Permian Resources Corporation | 0,11 | −3,96 | 1,33 | −22,62 | 0,3875 | −0,0251 | |||
| GWW / W.W. Grainger, Inc. | 0,00 | −11,10 | 1,33 | −14,31 | 0,3870 | 0,0151 | |||
| GMED / Globus Medical, Inc. | 0,02 | 37,76 | 1,33 | 6,68 | 0,3861 | 0,0879 | |||
| SPG / Simon Property Group, Inc. | 0,01 | −11,41 | 1,33 | −19,79 | 0,3858 | −0,0104 | |||
| EPR / EPR Properties | 0,03 | −14,20 | 1,32 | −7,90 | 0,3838 | 0,0406 | |||
| RGA / Reinsurance Group of America, Incorporated | 0,01 | −8,41 | 1,32 | −24,70 | 0,3835 | −0,0360 | |||
| CTVA / Corteva, Inc. | 0,02 | −8,33 | 1,31 | −12,93 | 0,3823 | 0,0207 | |||
| GEN / Gen Digital Inc. | 0,05 | 11,10 | 1,31 | 6,75 | 0,3822 | 0,0875 | |||
| BRX / Brixmor Property Group Inc. | 0,05 | −8,35 | 1,31 | −12,42 | 0,3820 | 0,0229 | |||
| RITM / Rithm Capital Corp. | 0,12 | −10,87 | 1,31 | −13,40 | 0,3820 | 0,0186 | |||
| SNA / Snap-on Incorporated | 0,00 | −14,02 | 1,30 | −24,02 | 0,3794 | −0,0319 | |||
| CSL / Carlisle Companies Incorporated | 0,00 | −12,71 | 1,30 | −14,95 | 0,3793 | 0,0120 | |||
| JLL / Jones Lang LaSalle Incorporated | 0,01 | −6,43 | 1,30 | −24,72 | 0,3784 | −0,0358 | |||
| AN / AutoNation, Inc. | 0,01 | −6,56 | 1,30 | −13,69 | 0,3782 | 0,0173 | |||
| TYL / Tyler Technologies, Inc. | 0,00 | −10,46 | 1,30 | −19,19 | 0,3778 | −0,0070 | |||
| TXRH / Texas Roadhouse, Inc. | 0,01 | −10,61 | 1,29 | −18,14 | 0,3760 | −0,0020 | |||
| OKE / ONEOK, Inc. | 0,02 | −2,10 | 1,29 | −17,25 | 0,3758 | 0,0019 | |||
| AME / AMETEK, Inc. | 0,01 | −10,67 | 1,29 | −17,95 | 0,3755 | −0,0013 | |||
| COG / Cabot Oil & Gas Corp. | 0,05 | −10,14 | 1,29 | −20,43 | 0,3743 | −0,0129 | |||
| VICI / VICI Properties Inc. | 0,04 | −12,36 | 1,29 | −5,79 | 0,3743 | 0,0473 | |||
| NEU / NewMarket Corporation | 0,00 | −9,23 | 1,28 | 12,15 | 0,3736 | 0,0992 | |||
| CHE / Chemed Corporation | 0,00 | −11,80 | 1,28 | −8,72 | 0,3719 | 0,0363 | |||
| GLPI / Gaming and Leisure Properties, Inc. | 0,03 | −14,46 | 1,27 | −15,42 | 0,3707 | 0,0098 | |||
| LAMR / Lamar Advertising Company | 0,01 | −14,32 | 1,27 | −22,91 | 0,3705 | −0,0251 | |||
| KVUE / Kenvue Inc. | 0,05 | −12,04 | 1,27 | −2,53 | 0,3697 | 0,0574 | |||
| DOCS / Doximity, Inc. | 0,02 | −3,36 | 1,27 | −6,96 | 0,3695 | 0,0423 | |||
| SYF / Synchrony Financial | 0,02 | −4,45 | 1,27 | −28,03 | 0,3686 | −0,0533 | |||
| CHD / Church & Dwight Co., Inc. | 0,01 | −5,33 | 1,25 | −10,89 | 0,3646 | 0,0277 | |||
| IP / International Paper Company | 0,03 | −10,00 | 1,25 | −26,09 | 0,3645 | −0,0417 | |||
| SSNC / SS&C Technologies Holdings, Inc. | 0,02 | −18,02 | 1,25 | −23,44 | 0,3643 | −0,0276 | |||
| LDOS / Leidos Holdings, Inc. | 0,01 | −18,22 | 1,25 | −15,27 | 0,3636 | 0,0103 | |||
| MOS / The Mosaic Company | 0,04 | −13,25 | 1,25 | −5,46 | 0,3629 | 0,0468 | |||
| GIS / General Mills, Inc. | 0,02 | 2,59 | 1,25 | −3,19 | 0,3626 | 0,0541 | |||
| ROLL / RBC Bearings Inc. | 0,00 | −8,79 | 1,24 | −14,07 | 0,3611 | 0,0150 | |||
| CWEN / Clearway Energy, Inc. | 0,04 | −6,83 | 1,24 | 5,45 | 0,3607 | 0,0789 | |||
| CMI / Cummins Inc. | 0,00 | −8,31 | 1,24 | −24,39 | 0,3603 | −0,0321 | |||
| DKS / DICK'S Sporting Goods, Inc. | 0,01 | −8,62 | 1,24 | −28,51 | 0,3598 | −0,0548 | |||
| IRM / Iron Mountain Incorporated | 0,01 | −3,87 | 1,24 | −15,12 | 0,3595 | 0,0106 | |||
| HUBB / Hubbell Incorporated | 0,00 | −8,66 | 1,23 | −21,56 | 0,3590 | −0,0180 | |||
| HRB / H&R Block, Inc. | 0,02 | −14,78 | 1,23 | −6,95 | 0,3587 | 0,0411 | |||
| ANSS / ANSYS, Inc. | 0,00 | −10,57 | 1,23 | −17,84 | 0,3566 | −0,0010 | |||
| ALSN / Allison Transmission Holdings, Inc. | 0,01 | −9,67 | 1,22 | −29,08 | 0,3563 | −0,0577 | |||
| EME / EMCOR Group, Inc. | 0,00 | −4,58 | 1,22 | −14,63 | 0,3552 | 0,0124 | |||
| FANG / Diamondback Energy, Inc. | 0,01 | −1,27 | 1,22 | −20,70 | 0,3548 | −0,0137 | |||
| DRI / Darden Restaurants, Inc. | 0,01 | −10,26 | 1,22 | −7,81 | 0,3542 | 0,0379 | |||
| GRMN / Garmin Ltd. | 0,01 | −18,12 | 1,21 | −29,13 | 0,3536 | −0,0573 | |||
| SNX / TD SYNNEX Corporation | 0,01 | 13,25 | 1,21 | −11,97 | 0,3533 | 0,0228 | |||
| PAG / Penske Automotive Group, Inc. | 0,01 | −14,17 | 1,21 | −19,36 | 0,3518 | −0,0074 | |||
| MGMXX / JPMorgan Trust II - JPMorgan U.S. Government Money Market Fund IM | 1,20 | 119,70 | 1,20 | 119,71 | 0,3506 | 0,2192 | |||
| PCG / PG&E Corporation | 0,07 | −9,43 | 1,20 | −4,37 | 0,3505 | 0,0486 | |||
| RRC / Range Resources Corporation | 0,04 | −7,77 | 1,20 | −15,55 | 0,3495 | 0,0088 | |||
| JAZZ / Jazz Pharmaceuticals plc | 0,01 | −2,51 | 1,19 | −8,38 | 0,3473 | 0,0353 | |||
| IDA / IDACORP, Inc. | 0,01 | −9,66 | 1,19 | −2,94 | 0,3458 | 0,0523 | |||
| PKG / Packaging Corporation of America | 0,01 | −11,12 | 1,18 | −22,39 | 0,3421 | −0,0211 | |||
| RPM / RPM International Inc. | 0,01 | −12,09 | 1,18 | −25,87 | 0,3421 | −0,0380 | |||
| RL / Ralph Lauren Corporation | 0,01 | 1,22 | 1,17 | −8,79 | 0,3415 | 0,0331 | |||
| GGG / Graco Inc. | 0,01 | −14,11 | 1,17 | −16,73 | 0,3407 | 0,0037 | |||
| CACI / CACI International Inc | 0,00 | −24,87 | 1,17 | −10,98 | 0,3403 | 0,0256 | |||
| WSM / Williams-Sonoma, Inc. | 0,01 | −16,25 | 1,17 | −38,81 | 0,3392 | −0,1173 | |||
| ESI / Element Solutions Inc | 0,06 | −4,17 | 1,16 | −24,19 | 0,3386 | −0,0294 | |||
| BPOP / Popular, Inc. | 0,01 | −6,30 | 1,16 | −13,17 | 0,3379 | 0,0175 | |||
| SMG / The Scotts Miracle-Gro Company | 0,02 | 34,19 | 1,15 | −4,73 | 0,3339 | 0,0453 | |||
| OC / Owens Corning | 0,01 | −7,48 | 1,14 | −27,14 | 0,3323 | −0,0431 | |||
| ROST / Ross Stores, Inc. | 0,01 | −9,77 | 1,14 | −16,70 | 0,3311 | 0,0037 | |||
| CH1300646267 / Bunge Global SA | 0,01 | −14,83 | 1,13 | −11,98 | 0,3298 | 0,0214 | |||
| TKR / The Timken Company | 0,02 | −9,55 | 1,13 | −27,62 | 0,3297 | −0,0454 | |||
| CLX / The Clorox Company | 0,01 | −9,93 | 1,12 | −19,22 | 0,3268 | −0,0064 | |||
| VVV / Valvoline Inc. | 0,03 | −9,02 | 1,12 | −16,03 | 0,3265 | 0,0063 | |||
| IT / Gartner, Inc. | 0,00 | −9,73 | 1,12 | −30,00 | 0,3263 | −0,0575 | |||
| STE / STERIS plc | 0,00 | −18,33 | 1,12 | −16,83 | 0,3252 | 0,0032 | |||
| KIM / Kimco Realty Corporation | 0,06 | −10,74 | 1,11 | −20,57 | 0,3226 | −0,0119 | |||
| MKC / McCormick & Company, Incorporated | 0,01 | −13,02 | 1,11 | −13,64 | 0,3226 | 0,0149 | |||
| ESS / Essex Property Trust, Inc. | 0,00 | −10,02 | 1,11 | −11,74 | 0,3217 | 0,0215 | |||
| EMN / Eastman Chemical Company | 0,01 | −13,99 | 1,11 | −33,51 | 0,3217 | −0,0770 | |||
| SAM / The Boston Beer Company, Inc. | 0,00 | 24,86 | 1,10 | 22,39 | 0,3216 | 0,1053 | |||
| AXS / AXIS Capital Holdings Limited | 0,01 | −8,45 | 1,10 | −3,08 | 0,3208 | 0,0481 | |||
| NXST / Nexstar Media Group, Inc. | 0,01 | −17,45 | 1,10 | −19,35 | 0,3202 | −0,0069 | |||
| EG / Everest Group, Ltd. | 0,00 | −16,24 | 1,10 | −13,46 | 0,3199 | 0,0153 | |||
| TSCO / Tractor Supply Company | 0,02 | −15,25 | 1,10 | −21,14 | 0,3196 | −0,0139 | |||
| PHM / PulteGroup, Inc. | 0,01 | −16,72 | 1,09 | −24,91 | 0,3187 | −0,0309 | |||
| DOX / Amdocs Limited | 0,01 | −16,27 | 1,09 | −15,95 | 0,3178 | 0,0066 | |||
| EQR / Equity Residential | 0,02 | −10,23 | 1,07 | −10,73 | 0,3125 | 0,0243 | |||
| BEPC / Brookfield Renewable Corporation | 0,04 | −12,69 | 1,07 | −6,88 | 0,3115 | 0,0359 | |||
| MSM / MSC Industrial Direct Co., Inc. | 0,01 | −15,38 | 1,06 | −19,53 | 0,3096 | −0,0072 | |||
| CUBE / CubeSmart | 0,03 | −16,58 | 1,06 | −18,67 | 0,3096 | −0,0038 | |||
| CPT / Camden Property Trust | 0,01 | −11,36 | 1,06 | −11,27 | 0,3095 | 0,0222 | |||
| HRL / Hormel Foods Corporation | 0,04 | −10,11 | 1,06 | −10,38 | 0,3093 | 0,0252 | |||
| UDR / UDR, Inc. | 0,03 | −11,77 | 1,06 | −11,53 | 0,3085 | 0,0215 | |||
| PKI / Revvity Inc. | 0,01 | 2,34 | 1,06 | −24,21 | 0,3072 | −0,0266 | |||
| SJM / The J. M. Smucker Company | 0,01 | −18,62 | 1,05 | −11,43 | 0,3068 | 0,0213 | |||
| MOH / Molina Healthcare, Inc. | 0,00 | −20,80 | 1,05 | −16,60 | 0,3058 | 0,0039 | |||
| LITE / Lumentum Holdings Inc. | 0,02 | −1,79 | 1,05 | −31,86 | 0,3058 | −0,0637 | |||
| HSIC / Henry Schein, Inc. | 0,02 | −16,01 | 1,05 | −31,82 | 0,3052 | −0,0633 | |||
| NVR / NVR, Inc. | 0,00 | −14,53 | 1,05 | −24,02 | 0,3049 | −0,0256 | |||
| JEF / Jefferies Financial Group Inc. | 0,02 | 1,33 | 1,05 | −38,46 | 0,3044 | −0,1027 | |||
| NUE / Nucor Corporation | 0,01 | −10,46 | 1,03 | −16,79 | 0,3004 | 0,0031 | |||
| ADM / Archer-Daniels-Midland Company | 0,02 | −13,99 | 1,03 | −19,84 | 0,3000 | −0,0082 | |||
| MTB / M&T Bank Corporation | 0,01 | −6,19 | 1,01 | −20,88 | 0,2935 | −0,0120 | |||
| PAYX / Paychex, Inc. | 0,01 | −13,59 | 1,00 | −13,98 | 0,2922 | 0,0127 | |||
| HSY / The Hershey Company | 0,01 | −18,75 | 1,00 | −8,98 | 0,2921 | 0,0278 | |||
| AMH / American Homes 4 Rent | 0,03 | −11,82 | 1,00 | −4,85 | 0,2917 | 0,0393 | |||
| PINC / Premier, Inc. | 0,05 | 30,48 | 1,00 | 17,14 | 0,2907 | 0,0864 | |||
| SYY / Sysco Corporation | 0,01 | −13,04 | 1,00 | −14,86 | 0,2904 | 0,0095 | |||
| TOL / Toll Brothers, Inc. | 0,01 | −11,26 | 0,99 | −34,13 | 0,2896 | −0,0723 | |||
| BYD / Boyd Gaming Corporation | 0,01 | −4,19 | 0,99 | −13,64 | 0,2896 | 0,0136 | |||
| MPWR / Monolithic Power Systems, Inc. | 0,00 | −10,82 | 0,99 | −16,99 | 0,2888 | 0,0022 | |||
| AVY / Avery Dennison Corporation | 0,01 | −8,78 | 0,99 | −16,02 | 0,2887 | 0,0058 | |||
| HIW / Highwoods Properties, Inc. | 0,03 | −14,20 | 0,99 | −18,08 | 0,2877 | −0,0016 | |||
| L / Loews Corporation | 0,01 | −12,67 | 0,99 | −11,25 | 0,2872 | 0,0206 | |||
| CRUS / Cirrus Logic, Inc. | 0,01 | −16,45 | 0,98 | −20,13 | 0,2866 | −0,0089 | |||
| CPB / The Campbell's Company | 0,03 | −16,81 | 0,98 | −21,74 | 0,2862 | −0,0151 | |||
| LECO / Lincoln Electric Holdings, Inc. | 0,01 | −10,98 | 0,98 | −21,10 | 0,2854 | −0,0125 | |||
| FLO / Flowers Foods, Inc. | 0,06 | −5,15 | 0,97 | −14,64 | 0,2836 | 0,0099 | |||
| CAG / Conagra Brands, Inc. | 0,04 | −19,13 | 0,97 | −22,83 | 0,2825 | −0,0189 | |||
| MEDP / Medpace Holdings, Inc. | 0,00 | −14,50 | 0,97 | −24,49 | 0,2810 | −0,0255 | |||
| IRDM / Iridium Communications Inc. | 0,04 | −10,72 | 0,95 | −25,08 | 0,2776 | −0,0275 | |||
| NTAP / NetApp, Inc. | 0,01 | −6,34 | 0,95 | −31,18 | 0,2765 | −0,0543 | |||
| DHI / D.R. Horton, Inc. | 0,01 | −16,86 | 0,95 | −25,94 | 0,2760 | −0,0311 | |||
| MAA / Mid-America Apartment Communities, Inc. | 0,01 | −12,04 | 0,95 | −7,98 | 0,2756 | 0,0290 | |||
| STAG / STAG Industrial, Inc. | 0,03 | −15,36 | 0,94 | −18,21 | 0,2734 | −0,0019 | |||
| VTRS / Viatris Inc. | 0,11 | −17,61 | 0,94 | −38,52 | 0,2730 | −0,0926 | |||
| AOS / A. O. Smith Corporation | 0,01 | −17,54 | 0,94 | −16,87 | 0,2726 | 0,0026 | |||
| R / Ryder System, Inc. | 0,01 | −5,06 | 0,93 | −18,00 | 0,2693 | −0,0012 | |||
| SAIC / Science Applications International Corporation | 0,01 | −21,89 | 0,92 | −12,63 | 0,2679 | 0,0152 | |||
| KRC / Kilroy Realty Corporation | 0,03 | −7,40 | 0,92 | −25,25 | 0,2666 | −0,0270 | |||
| HOLX / Hologic, Inc. | 0,02 | −14,63 | 0,91 | −31,17 | 0,2663 | −0,0522 | |||
| DECK / Deckers Outdoor Corporation | 0,01 | −5,02 | 0,91 | −40,65 | 0,2661 | −0,1031 | |||
| HST / Host Hotels & Resorts, Inc. | 0,06 | −14,22 | 0,91 | −27,57 | 0,2649 | −0,0361 | |||
| OVV / Ovintiv Inc. | 0,03 | −2,12 | 0,91 | −22,15 | 0,2640 | −0,0153 | |||
| DAR / Darling Ingredients Inc. | 0,03 | 20,76 | 0,90 | −10,24 | 0,2630 | −0,0182 | |||
| BBY / Best Buy Co., Inc. | 0,01 | −2,52 | 0,90 | −24,30 | 0,2612 | −0,0229 | |||
| 46645V642 / JPMorgan Securities Lending Money Market Fund, Class Agency SL Shares | 0,90 | 149,00 | 0,90 | 148,89 | 0,2611 | 0,1747 | |||
| SPB / Spectrum Brands Holdings, Inc. | 0,01 | −10,08 | 0,89 | −32,91 | 0,2594 | −0,0590 | |||
| BLDR / Builders FirstSource, Inc. | 0,01 | −10,17 | 0,89 | −35,79 | 0,2593 | −0,0731 | |||
| CUZ / Cousins Properties Incorporated | 0,03 | −9,92 | 0,89 | −18,77 | 0,2583 | −0,0035 | |||
| UAL / United Airlines Holdings, Inc. | 0,01 | 0,89 | 0,2581 | 0,2581 | |||||
| INCY / Incyte Corporation | 0,01 | −0,67 | 0,89 | −16,11 | 0,2578 | 0,0048 | |||
| EXE / Expand Energy Corporation | 0,01 | −42,62 | 0,88 | −41,33 | 0,2552 | −0,1030 | |||
| LYB / LyondellBasell Industries N.V. | 0,01 | −13,81 | 0,87 | −33,69 | 0,2533 | −0,0615 | |||
| MAS / Masco Corporation | 0,01 | −13,11 | 0,87 | −33,61 | 0,2520 | −0,0604 | |||
| A / Agilent Technologies, Inc. | 0,01 | −11,84 | 0,86 | −37,45 | 0,2506 | −0,0791 | |||
| AVT / Avnet, Inc. | 0,02 | 69,53 | 0,86 | 54,12 | 0,2505 | 0,1167 | |||
| QGEN / Qiagen N.V. | 0,02 | −16,08 | 0,86 | −19,59 | 0,2498 | −0,0062 | |||
| VEEV / Veeva Systems Inc. | 0,00 | −20,59 | 0,86 | −20,52 | 0,2494 | −0,0088 | |||
| DVN / Devon Energy Corporation | 0,03 | −9,18 | 0,85 | −18,98 | 0,2486 | −0,0042 | |||
| REYN / Reynolds Consumer Products Inc. | 0,04 | 3,18 | 0,85 | −14,04 | 0,2479 | 0,0104 | |||
| FTI / TechnipFMC plc | 0,03 | −4,08 | 0,85 | −10,04 | 0,2478 | 0,0208 | |||
| EIX / Edison International | 0,02 | −15,87 | 0,85 | −16,65 | 0,2478 | 0,0030 | |||
| WLK / Westlake Corporation | 0,01 | −13,23 | 0,85 | −29,87 | 0,2477 | −0,0430 | |||
| LEN / Lennar Corporation | 0,01 | −16,76 | 0,85 | −31,08 | 0,2460 | −0,0481 | |||
| MDU / MDU Resources Group, Inc. | 0,05 | 53,95 | 0,83 | 48,04 | 0,2424 | 0,1076 | |||
| NBIX / Neurocrine Biosciences, Inc. | 0,01 | −8,71 | 0,82 | −35,29 | 0,2377 | −0,0647 | |||
| EGP / EastGroup Properties, Inc. | 0,00 | −14,00 | 0,82 | −17,16 | 0,2376 | 0,0014 | |||
| STWD / Starwood Property Trust, Inc. | 0,04 | −14,20 | 0,81 | −14,94 | 0,2372 | 0,0076 | |||
| LPX / Louisiana-Pacific Corporation | 0,01 | −6,39 | 0,80 | −30,95 | 0,2339 | −0,0450 | |||
| PK / Park Hotels & Resorts Inc. | 0,08 | −14,07 | 0,80 | −36,69 | 0,2327 | −0,0700 | |||
| AA / Alcoa Corporation | 0,03 | 7,22 | 0,79 | −25,59 | 0,2314 | −0,0245 | |||
| NNN / NNN REIT, Inc. | 0,02 | −14,52 | 0,79 | −10,81 | 0,2308 | 0,0177 | |||
| FR / First Industrial Realty Trust, Inc. | 0,02 | −14,12 | 0,79 | −23,43 | 0,2303 | −0,0175 | |||
| SLM / SLM Corporation | 0,03 | −12,30 | 0,79 | −9,21 | 0,2298 | 0,0215 | |||
| MGM / MGM Resorts International | 0,02 | −4,66 | 0,79 | −12,96 | 0,2289 | 0,0122 | |||
| DLB / Dolby Laboratories, Inc. | 0,01 | −15,05 | 0,78 | −22,11 | 0,2278 | −0,0130 | |||
| LSTR / Landstar System, Inc. | 0,01 | −15,77 | 0,78 | −31,40 | 0,2277 | −0,0456 | |||
| FBHS / Fortune Brands Home & Security Inc | 0,01 | −11,85 | 0,78 | −33,79 | 0,2260 | −0,0552 | |||
| HPQ / HP Inc. | 0,03 | −11,84 | 0,77 | −30,63 | 0,2242 | −0,0420 | |||
| LBTYK / Liberty Global Ltd. | 0,07 | 0,36 | 0,77 | −2,91 | 0,2236 | 0,0338 | |||
| IQV / IQVIA Holdings Inc. | 0,00 | −13,93 | 0,76 | −33,77 | 0,2223 | −0,0539 | |||
| GNTX / Gentex Corporation | 0,03 | −16,90 | 0,76 | −30,24 | 0,2212 | −0,0397 | |||
| PRI / Primerica, Inc. | 0,00 | −10,23 | 0,75 | −18,93 | 0,2170 | −0,0034 | |||
| OMC / Omnicom Group Inc. | 0,01 | −15,69 | 0,74 | −26,03 | 0,2143 | −0,0243 | |||
| CROX / Crocs, Inc. | 0,01 | −13,37 | 0,72 | −18,14 | 0,2103 | −0,0013 | |||
| HAL / Halliburton Company | 0,04 | −8,14 | 0,72 | −30,04 | 0,2082 | −0,0369 | |||
| COO / The Cooper Companies, Inc. | 0,01 | −6,38 | 0,71 | −20,85 | 0,2057 | −0,0082 | |||
| FNF / Fidelity National Financial, Inc. | 0,01 | −10,84 | 0,71 | −1,81 | 0,2053 | 0,0331 | |||
| FOXA / Fox Corporation | 0,01 | 0,68 | 0,1992 | 0,1992 | |||||
| PEGA / Pegasystems Inc. | 0,01 | 12,90 | 0,68 | −3,98 | 0,1966 | 0,0279 | |||
| DFS / Discover Financial Services | 0,00 | 1,43 | 0,66 | −7,82 | 0,1923 | 0,0204 | |||
| GLW / Corning Incorporated | 0,01 | −4,37 | 0,66 | −18,46 | 0,1916 | −0,0020 | |||
| WST / West Pharmaceutical Services, Inc. | 0,00 | −13,21 | 0,65 | −46,34 | 0,1903 | −0,1016 | |||
| TER / Teradyne, Inc. | 0,01 | −12,00 | 0,65 | −43,66 | 0,1903 | −0,0876 | |||
| BRO / Brown & Brown, Inc. | 0,01 | −12,73 | 0,65 | −7,69 | 0,1887 | 0,0202 | |||
| HXL / Hexcel Corporation | 0,01 | 258,67 | 0,64 | 166,95 | 0,1860 | 0,1285 | |||
| AFG / American Financial Group, Inc. | 0,00 | −13,64 | 0,62 | −19,92 | 0,1793 | −0,0051 | |||
| BKR / Baker Hughes Company | 0,02 | −9,48 | 0,61 | −30,65 | 0,1781 | −0,0333 | |||
| EXP / Eagle Materials Inc. | 0,00 | −8,36 | 0,61 | −19,15 | 0,1771 | −0,0034 | |||
| MCHP / Microchip Technology Incorporated | 0,01 | −13,94 | 0,61 | −26,96 | 0,1768 | −0,0226 | |||
| SWKS / Skyworks Solutions, Inc. | 0,01 | −20,12 | 0,61 | −42,23 | 0,1767 | −0,0749 | |||
| OLN / Olin Corporation | 0,03 | −9,76 | 0,61 | −33,44 | 0,1763 | −0,0417 | |||
| AGO / Assured Guaranty Ltd. | 0,01 | −40,15 | 0,59 | −44,54 | 0,1731 | −0,0838 | |||
| FRT / Federal Realty Investment Trust | 0,01 | −9,88 | 0,59 | −22,05 | 0,1710 | −0,0096 | |||
| FITB / Fifth Third Bancorp | 0,02 | −4,63 | 0,58 | −22,64 | 0,1692 | −0,0109 | |||
| ON / ON Semiconductor Corporation | 0,01 | −9,66 | 0,58 | −31,47 | 0,1681 | −0,0340 | |||
| ITT / ITT Inc. | 0,00 | −11,23 | 0,57 | −19,40 | 0,1645 | −0,0037 | |||
| NVT / nVent Electric plc | 0,01 | −3,92 | 0,56 | −19,04 | 0,1624 | −0,0026 | |||
| REXR / Rexford Industrial Realty, Inc. | 0,02 | −11,25 | 0,56 | −27,83 | 0,1617 | −0,0226 | |||
| HUN / Huntsman Corporation | 0,04 | −15,18 | 0,53 | −33,00 | 0,1551 | −0,0353 | |||
| RF / Regions Financial Corporation | 0,03 | −6,27 | 0,53 | −22,27 | 0,1534 | −0,0093 | |||
| AEE / Ameren Corporation | 0,01 | 327,40 | 0,53 | 353,45 | 0,1532 | 0,1252 | |||
| SCI / Service Corporation International | 0,01 | −12,93 | 0,52 | −10,94 | 0,1518 | 0,0114 | |||
| VNOM / Viper Energy, Inc. | 0,01 | −2,13 | 0,51 | −15,82 | 0,1489 | 0,0032 | |||
| NSA / National Storage Affiliates Trust | 0,01 | −15,21 | 0,50 | −15,06 | 0,1463 | 0,0044 | |||
| CE / Celanese Corporation | 0,01 | −20,14 | 0,49 | −49,95 | 0,1424 | −0,0920 | |||
| GEHC / GE HealthCare Technologies Inc. | 0,01 | −11,16 | 0,47 | −29,20 | 0,1363 | −0,0224 | |||
| QRVO / Qorvo, Inc. | 0,01 | −17,59 | 0,46 | −28,92 | 0,1347 | −0,0212 | |||
| RYN / Rayonier Inc. | 0,02 | −19,30 | 0,45 | −24,49 | 0,1302 | −0,0118 | |||
| G / Genpact Limited | 0,01 | 0,43 | 0,1257 | 0,1257 | |||||
| OGN / Organon & Co. | 0,03 | −16,19 | 0,42 | −30,31 | 0,1232 | −0,0225 | |||
| PRGO / Perrigo Company plc | 0,02 | 0,41 | 0,1204 | 0,1204 | |||||
| TXT / Textron Inc. | 0,01 | −13,65 | 0,41 | −20,62 | 0,1191 | −0,0044 | |||
| SON / Sonoco Products Company | 0,01 | −13,13 | 0,41 | −25,27 | 0,1189 | −0,0121 | |||
| ELAN / Elanco Animal Health Incorporated | 0,04 | −12,92 | 0,41 | −31,37 | 0,1185 | −0,0237 | |||
| BWA / BorgWarner Inc. | 0,01 | −15,09 | 0,41 | −24,49 | 0,1185 | −0,0107 | |||
| APA / APA Corporation | 0,03 | −3,96 | 0,40 | −31,96 | 0,1153 | −0,0242 | |||
| VMI / Valmont Industries, Inc. | 0,00 | 0,39 | 0,1146 | 0,1146 | |||||
| THO / THOR Industries, Inc. | 0,01 | −0,71 | 0,39 | −30,12 | 0,1142 | −0,0203 | |||
| M / Macy's, Inc. | 0,03 | −11,40 | 0,38 | −35,10 | 0,1105 | −0,0296 | |||
| BAH / Booz Allen Hamilton Holding Corporation | 0,00 | −20,17 | 0,38 | −25,64 | 0,1098 | −0,0120 | |||
| ACGL / Arch Capital Group Ltd. | 0,00 | −9,92 | 0,38 | −12,15 | 0,1095 | 0,0067 | |||
| SLGN / Silgan Holdings Inc. | 0,01 | −11,03 | 0,36 | −16,51 | 0,1062 | 0,0015 | |||
| POOL / Pool Corporation | 0,00 | −18,43 | 0,36 | −30,53 | 0,1061 | −0,0197 | |||
| AKAM / Akamai Technologies, Inc. | 0,00 | −19,68 | 0,36 | −35,15 | 0,1037 | −0,0281 | |||
| CFG / Citizens Financial Group, Inc. | 0,01 | −3,20 | 0,36 | −24,95 | 0,1034 | −0,0100 | |||
| WEN / The Wendy's Company | 0,03 | −13,39 | 0,33 | −27,05 | 0,0959 | −0,0123 | |||
| CXT / Crane NXT, Co. | 0,01 | −10,60 | 0,32 | −34,58 | 0,0923 | −0,0236 | |||
| ASH / Ashland Inc. | 0,01 | −65,66 | 0,32 | −70,66 | 0,0922 | −0,1660 | |||
| KEY / KeyCorp | 0,02 | −2,68 | 0,32 | −19,64 | 0,0917 | −0,0023 | |||
| CLH / Clean Harbors, Inc. | 0,00 | −78,68 | 0,31 | −80,47 | 0,0917 | −0,2940 | |||
| LBRDK / Liberty Broadband Corporation | 0,00 | −18,97 | 0,30 | −4,42 | 0,0884 | 0,0122 | |||
| ZION / Zions Bancorporation, National Association | 0,01 | −6,19 | 0,29 | −27,25 | 0,0850 | −0,0110 | |||
| CNXC / Concentrix Corporation | 0,01 | −19,16 | 0,27 | −20,90 | 0,0772 | −0,0033 | |||
| AYI / Acuity Inc. | 0,00 | −6,91 | 0,26 | −31,84 | 0,0755 | −0,0156 | |||
| XRAY / DENTSPLY SIRONA Inc. | 0,02 | −13,29 | 0,26 | −39,15 | 0,0753 | −0,0264 | |||
| DOCU / DocuSign, Inc. | 0,00 | −5,94 | 0,24 | −20,61 | 0,0686 | −0,0025 | |||
| CMA / Comerica Incorporated | 0,00 | −6,35 | 0,23 | −25,16 | 0,0676 | −0,0069 | |||
| FNB / F.N.B. Corporation | 0,02 | −9,29 | 0,23 | −24,51 | 0,0674 | −0,0060 | |||
| TNL / Travel + Leisure Co. | 0,01 | −5,88 | 0,23 | −23,73 | 0,0655 | −0,0054 | |||
| TFX / Teleflex Incorporated | 0,00 | −16,70 | 0,22 | −36,75 | 0,0649 | −0,0195 | |||
| PB / Prosperity Bancshares, Inc. | 0,00 | −10,19 | 0,21 | −24,00 | 0,0611 | −0,0049 | |||
| CR / Crane Company | 0,00 | −12,24 | 0,20 | −16,88 | 0,0574 | 0,0004 | |||
| WTM / White Mountains Insurance Group, Ltd. | 0,00 | −64,97 | 0,18 | −67,96 | 0,0530 | −0,0832 | |||
| VIRT / Virtu Financial, Inc. | 0,00 | −17,36 | 0,18 | −19,28 | 0,0525 | −0,0010 | |||
| PFG / Principal Financial Group, Inc. | 0,00 | −6,30 | 0,18 | −15,79 | 0,0514 | 0,0012 | |||
| NVST / Envista Holdings Corporation | 0,01 | −6,29 | 0,16 | −26,64 | 0,0459 | −0,0056 | |||
| MANH / Manhattan Associates, Inc. | 0,00 | −83,68 | 0,15 | −86,13 | 0,0440 | −0,2171 | |||
| TECH / Bio-Techne Corporation | 0,00 | −18,65 | 0,14 | −44,40 | 0,0421 | −0,0202 | |||
| PAYC / Paycom Software, Inc. | 0,00 | −5,87 | 0,14 | 2,24 | 0,0401 | 0,0079 | |||
| IEX / IDEX Corporation | 0,00 | −4,83 | 0,14 | −25,95 | 0,0399 | −0,0046 | |||
| BIIB / Biogen Inc. | 0,00 | −20,33 | 0,12 | −32,75 | 0,0336 | −0,0077 | |||
| WU / The Western Union Company | 0,01 | −22,20 | 0,11 | −25,17 | 0,0321 | −0,0033 | |||
| MRP / Millrose Properties, Inc. | 0,00 | −6,31 | 0,11 | 151,16 | 0,0317 | 0,0214 | |||
| ADT / ADT Inc. | 0,01 | −16,82 | 0,10 | −13,04 | 0,0291 | 0,0015 | |||
| NLY / Annaly Capital Management, Inc. | 0,00 | −13,58 | 0,09 | −17,54 | 0,0276 | 0,0002 | |||
| CRI / Carter's, Inc. | 0,00 | −6,72 | 0,09 | −42,67 | 0,0251 | −0,0111 | |||
| IPG / The Interpublic Group of Companies, Inc. | 0,00 | −20,95 | 0,09 | −30,89 | 0,0249 | −0,0047 | |||
| LLYVA / Liberty Live Group | 0,00 | −5,76 | 0,08 | −7,87 | 0,0240 | 0,0024 | |||
| HOG / Harley-Davidson, Inc. | 0,00 | −6,20 | 0,05 | −21,54 | 0,0149 | −0,0009 | |||
| FTRE / Fortrea Holdings Inc. | 0,01 | 17,38 | 0,04 | −56,86 | 0,0130 | −0,0116 | |||
| ATR / AptarGroup, Inc. | 0,00 | −30,25 | 0,04 | −33,93 | 0,0109 | −0,0026 | |||
| CNA / CNA Financial Corporation | 0,00 | −1,75 | 0,01 | −9,09 | 0,0032 | 0,0005 | |||
| KSS / Kohl's Corporation | 0,00 | −5,85 | 0,01 | −55,00 | 0,0028 | −0,0020 | |||
| S&P MidCap 400 E-Mini Index / DE (N/A) | 0,00 | 0,0014 | 0,0014 | ||||||
| ALLY / Ally Financial Inc. | 0,00 | −100,00 | 0,00 | −100,00 | −0,1287 | ||||
| FRPT / Freshpet, Inc. | 0,00 | −100,00 | 0,00 | −100,00 | −0,3185 | ||||
| BRKR / Bruker Corporation | 0,00 | −100,00 | 0,00 | −100,00 | −0,2113 | ||||
| US361ESC0496 / ESC GCI LIBERTY INC SR | 0,01 | 0,00 | 0,00 | 0,0000 | 0,0000 | ||||
| ROKU / Roku, Inc. | 0,00 | −100,00 | 0,00 | −100,00 | −0,0922 |