Grundläggande statistik
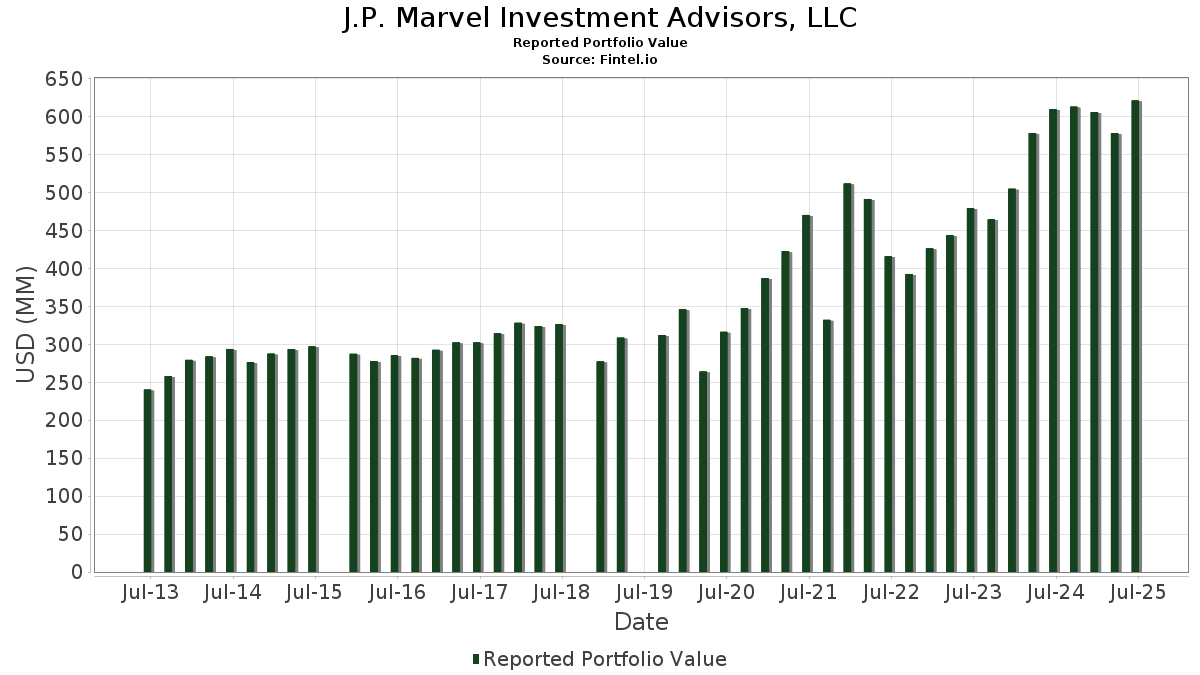
| Portföljvärde | $ 621 024 252 |
| Aktuella positioner | 64 |
Senaste innehav, resultat, förvaltat kapital (från 13F, 13D)
J.P. Marvel Investment Advisors, LLC har redovisat 64 totala innehav i sina senaste SEC-arkiveringar. Det senaste portföljvärdet beräknas vara $ 621 024 252 USD. Faktiskt förvaltade tillgångar (AUM) är detta värde plus likvida medel (som inte redovisas). J.P. Marvel Investment Advisors, LLCs största innehav är NVIDIA Corporation (US:NVDA) , Eli Lilly and Company (US:LLY) , Apple Inc. (US:AAPL) , JPMorgan Chase & Co. (US:JPM) , and Alphabet Inc. (US:GOOGL) . J.P. Marvel Investment Advisors, LLCs nya positioner inkluderar QUALCOMM Incorporated (US:QCOM) , .
Största ökningarna detta kvartal
Vi använder förändringen i portföljallokeringen eftersom det är det mest meningsfulla måttet. Förändringar kan bero på transaktioner eller förändringar i aktiekurser.
| Värdepapper | Aktier (MM) |
Värde (MM$) |
Portfölj % av | ΔPortfölj % av |
|---|---|---|---|---|
| 0,58 | 91,71 | 14,7674 | 3,8618 | |
| 0,04 | 21,65 | 3,4866 | 0,6584 | |
| 0,16 | 16,01 | 2,5787 | 0,5088 | |
| 0,11 | 32,04 | 5,1599 | 0,4912 | |
| 0,20 | 27,83 | 4,4814 | 0,4783 | |
| 0,01 | 9,09 | 1,4632 | 0,4705 | |
| 0,14 | 29,73 | 4,7867 | 0,3214 | |
| 0,18 | 31,24 | 5,0307 | 0,2738 | |
| 0,01 | 3,90 | 0,6278 | 0,2412 | |
| 0,03 | 8,06 | 1,2983 | 0,2135 |
Största minskningarna detta kvartal
Vi använder förändringen i portföljallokeringen eftersom det är det mest meningsfulla måttet. Förändringar kan bero på transaktioner eller förändringar i aktiepriser.
| Värdepapper | Aktier (MM) |
Värde (MM$) |
Portfölj % av | ΔPortfölj % av |
|---|---|---|---|---|
| 0,06 | 43,44 | 6,9948 | −1,0223 | |
| 0,19 | 38,06 | 6,1288 | −1,0079 | |
| 0,04 | 15,48 | 2,4928 | −0,8051 | |
| 0,08 | 15,77 | 2,5388 | −0,5421 | |
| 0,16 | 7,60 | 1,2241 | −0,5264 | |
| 0,07 | 10,24 | 1,6488 | −0,2745 | |
| 0,06 | 22,36 | 3,6002 | −0,2194 | |
| 0,07 | 8,46 | 1,3628 | −0,2092 | |
| 0,04 | 6,55 | 1,0551 | −0,1575 | |
| 0,05 | 6,28 | 1,0112 | −0,1432 |
13F- och fond arkiveringar
Denna blankett lämnades in den 2025-08-14 för rapporteringsperioden 2025-06-30. Klicka på länksymbolen för att se hela transaktionshistoriken.
Uppgradera för att låsa upp premiumdata och exportera till Excel![]() .
.
| Värdepapper | Typ | Genomsnittligt aktiepris | Aktier (MM) |
ΔAktier (%) |
ΔAktier (%) |
Värde ($MM) |
Portfölj (%) |
ΔPortfölj (%) |
|
|---|---|---|---|---|---|---|---|---|---|
| NVDA / NVIDIA Corporation | 0,58 | −0,20 | 91,71 | 45,49 | 14,7674 | 3,8618 | |||
| LLY / Eli Lilly and Company | 0,06 | −0,68 | 43,44 | −6,26 | 6,9948 | −1,0223 | |||
| AAPL / Apple Inc. | 0,19 | −0,11 | 38,06 | −7,73 | 6,1288 | −1,0079 | |||
| JPM / JPMorgan Chase & Co. | 0,11 | 0,47 | 32,04 | 18,75 | 5,1599 | 0,4912 | |||
| GOOGL / Alphabet Inc. | 0,18 | −0,29 | 31,24 | 13,63 | 5,0307 | 0,2738 | |||
| AMZN / Amazon.com, Inc. | 0,14 | −0,12 | 29,73 | 15,18 | 4,7867 | 0,3214 | |||
| MS / Morgan Stanley | 0,20 | −0,38 | 27,83 | 20,28 | 4,4814 | 0,4783 | |||
| V / Visa Inc. | 0,06 | −0,04 | 22,36 | 1,27 | 3,6002 | −0,2194 | |||
| MSFT / Microsoft Corporation | 0,04 | −0,04 | 21,65 | 32,45 | 3,4866 | 0,6584 | |||
| LRCX / Lam Research Corporation | 0,16 | −0,03 | 16,01 | 33,85 | 2,5787 | 0,5088 | |||
| ABBV / AbbVie Inc. | 0,08 | −0,06 | 15,77 | −11,46 | 2,5388 | −0,5421 | |||
| TMO / Thermo Fisher Scientific Inc. | 0,04 | −0,33 | 15,48 | −18,79 | 2,4928 | −0,8051 | |||
| DE / Deere & Company | 0,03 | 0,11 | 14,09 | 8,46 | 2,2689 | 0,0213 | |||
| GLW / Corning Incorporated | 0,26 | 1,42 | 13,90 | 16,50 | 2,2385 | 0,1741 | |||
| BAC / Bank of America Corporation | 0,29 | 0,00 | 13,83 | 13,40 | 2,2263 | 0,1169 | |||
| CSCO / Cisco Systems, Inc. | 0,19 | 2,48 | 13,25 | 15,21 | 2,1330 | 0,1439 | |||
| MMM / 3M Company | 0,07 | −0,23 | 10,64 | 3,42 | 1,7131 | −0,0665 | |||
| JNJ / Johnson & Johnson | 0,07 | 0,00 | 10,24 | −7,90 | 1,6488 | −0,2745 | |||
| ABT / Abbott Laboratories | 0,07 | 0,32 | 9,55 | 2,87 | 1,5372 | −0,0685 | |||
| SHW / The Sherwin-Williams Company | 0,03 | −0,15 | 9,30 | −1,82 | 1,4980 | −0,1412 | |||
| AXON / Axon Enterprise, Inc. | 0,01 | 0,61 | 9,09 | 58,38 | 1,4632 | 0,4705 | |||
| EOG / EOG Resources, Inc. | 0,07 | −0,13 | 8,46 | −6,86 | 1,3628 | −0,2092 | |||
| GE / General Electric Company | 0,03 | −0,01 | 8,06 | 28,60 | 1,2983 | 0,2135 | |||
| BMY / Bristol-Myers Squibb Company | 0,16 | −1,01 | 7,60 | −24,88 | 1,2241 | −0,5264 | |||
| IBM / International Business Machines Corporation | 0,02 | 1,70 | 6,81 | 20,57 | 1,0966 | 0,1194 | |||
| PG / The Procter & Gamble Company | 0,04 | 0,00 | 6,55 | −6,51 | 1,0551 | −0,1575 | |||
| AWK / American Water Works Company, Inc. | 0,05 | −0,20 | 6,28 | −5,89 | 1,0112 | −0,1432 | |||
| CRL / Charles River Laboratories International, Inc. | 0,04 | −0,99 | 5,62 | −0,20 | 0,9056 | −0,0693 | |||
| CLH / Clean Harbors, Inc. | 0,02 | −0,40 | 5,58 | 16,82 | 0,8992 | 0,0722 | |||
| DHR / Danaher Corporation | 0,03 | −0,18 | 5,57 | −3,82 | 0,8972 | −0,1049 | |||
| CARR / Carrier Global Corporation | 0,07 | −0,56 | 4,96 | 14,80 | 0,7984 | 0,0512 | |||
| MDT / Medtronic plc | 0,06 | −0,76 | 4,94 | −3,74 | 0,7948 | −0,0923 | |||
| KO / The Coca-Cola Company | 0,07 | 0,00 | 4,65 | −1,21 | 0,7485 | −0,0656 | |||
| CAT / Caterpillar Inc. | 0,01 | −0,65 | 4,53 | 16,96 | 0,7288 | 0,0592 | |||
| PYPL / PayPal Holdings, Inc. | 0,06 | −1,99 | 4,47 | 11,66 | 0,7203 | 0,0270 | |||
| XOM / Exxon Mobil Corporation | 0,04 | −0,24 | 4,45 | −9,57 | 0,7164 | −0,1348 | |||
| GEV / GE Vernova Inc. | 0,01 | 0,66 | 3,90 | 74,49 | 0,6278 | 0,2412 | |||
| VRTX / Vertex Pharmaceuticals Incorporated | 0,01 | −1,71 | 3,50 | −9,73 | 0,5631 | −0,1072 | |||
| MRK / Merck & Co., Inc. | 0,04 | 0,00 | 3,06 | −11,81 | 0,4929 | −0,1076 | |||
| HES / Hess Corporation | 0,02 | 0,00 | 2,86 | −13,24 | 0,4599 | −0,1098 | |||
| OTIS / Otis Worldwide Corporation | 0,03 | −6,17 | 2,50 | −9,96 | 0,4031 | −0,0780 | |||
| PFE / Pfizer Inc. | 0,09 | −2,61 | 2,30 | −6,86 | 0,3698 | −0,0567 | |||
| DELL / Dell Technologies Inc. | 0,02 | 69,03 | 2,24 | 127,51 | 0,3609 | 0,1904 | |||
| ALNY / Alnylam Pharmaceuticals, Inc. | 0,01 | 70,60 | 2,23 | 106,02 | 0,3583 | 0,1715 | |||
| SPY / SPDR S&P 500 ETF | 0,00 | 0,00 | 2,21 | 10,48 | 0,3564 | 0,0097 | |||
| TXN / Texas Instruments Incorporated | 0,01 | 0,00 | 2,11 | 15,56 | 0,3397 | 0,0238 | |||
| AVGO / Broadcom Inc. | 0,01 | 0,00 | 1,80 | 64,71 | 0,2894 | 0,1006 | |||
| CMCSA / Comcast Corporation | 0,05 | −1,46 | 1,73 | −4,68 | 0,2787 | −0,0355 | |||
| AEM / Agnico Eagle Mines Limited | 0,01 | 0,00 | 1,59 | 9,73 | 0,2560 | 0,0053 | |||
| MRNA / Moderna, Inc. | 0,05 | 6,53 | 1,35 | 3,69 | 0,2174 | −0,0079 | |||
| HSY / The Hershey Company | 0,01 | 0,00 | 1,33 | −3,00 | 0,2138 | −0,0229 | |||
| T / AT&T Inc. | 0,04 | 62,87 | 1,29 | 66,67 | 0,2078 | 0,0739 | |||
| GOOG / Alphabet Inc. | 0,01 | 0,00 | 1,16 | 13,57 | 0,1874 | 0,0101 | |||
| VLTO / Veralto Corporation | 0,01 | 0,00 | 0,95 | 3,60 | 0,1530 | −0,0057 | |||
| QCOM / QUALCOMM Incorporated | 0,01 | 0,91 | 0,1473 | 0,1473 | |||||
| GD / General Dynamics Corporation | 0,00 | 0,00 | 0,87 | 6,98 | 0,1409 | −0,0006 | |||
| SYY / Sysco Corporation | 0,01 | 0,00 | 0,72 | 0,99 | 0,1153 | −0,0074 | |||
| EPD / Enterprise Products Partners L.P. - Limited Partnership | 0,02 | 0,00 | 0,63 | −9,26 | 0,1011 | −0,0185 | |||
| VRT / Vertiv Holdings Co | 0,00 | 0,00 | 0,59 | 77,71 | 0,0951 | 0,0377 | |||
| IJH / iShares Trust - iShares Core S&P Mid-Cap ETF | 0,01 | 0,00 | 0,39 | 6,27 | 0,0629 | −0,0007 | |||
| MET / MetLife, Inc. | 0,00 | 0,00 | 0,32 | 0,00 | 0,0517 | −0,0038 | |||
| EFA / iShares Trust - iShares MSCI EAFE ETF | 0,00 | 0,00 | 0,27 | 9,60 | 0,0442 | 0,0008 | |||
| PEP / PepsiCo, Inc. | 0,00 | 0,00 | 0,25 | −12,15 | 0,0408 | −0,0090 | |||
| DUK / Duke Energy Corporation | 0,00 | 0,00 | 0,21 | −3,18 | 0,0344 | −0,0038 | |||
| INTC / Intel Corporation | 0,00 | −100,00 | 0,00 | −100,00 | −0,0708 | ||||
| CNC / Centene Corporation | 0,00 | −100,00 | 0,00 | 0,0000 | |||||
| SOLV / Solventum Corporation | 0,00 | −100,00 | 0,00 | 0,0000 | |||||
| AKAM / Akamai Technologies, Inc. | 0,00 | −100,00 | 0,00 | 0,0000 | |||||
| ITCI / Intra-Cellular Therapies, Inc. | 0,00 | −100,00 | 0,00 | 0,0000 | |||||
| DIS / The Walt Disney Company | 0,00 | −100,00 | 0,00 | 0,0000 |