Grundläggande statistik
| Portföljvärde | $ 3 858 327 680 |
| Aktuella positioner | 68 |
Senaste innehav, resultat, förvaltat kapital (från 13F, 13D)
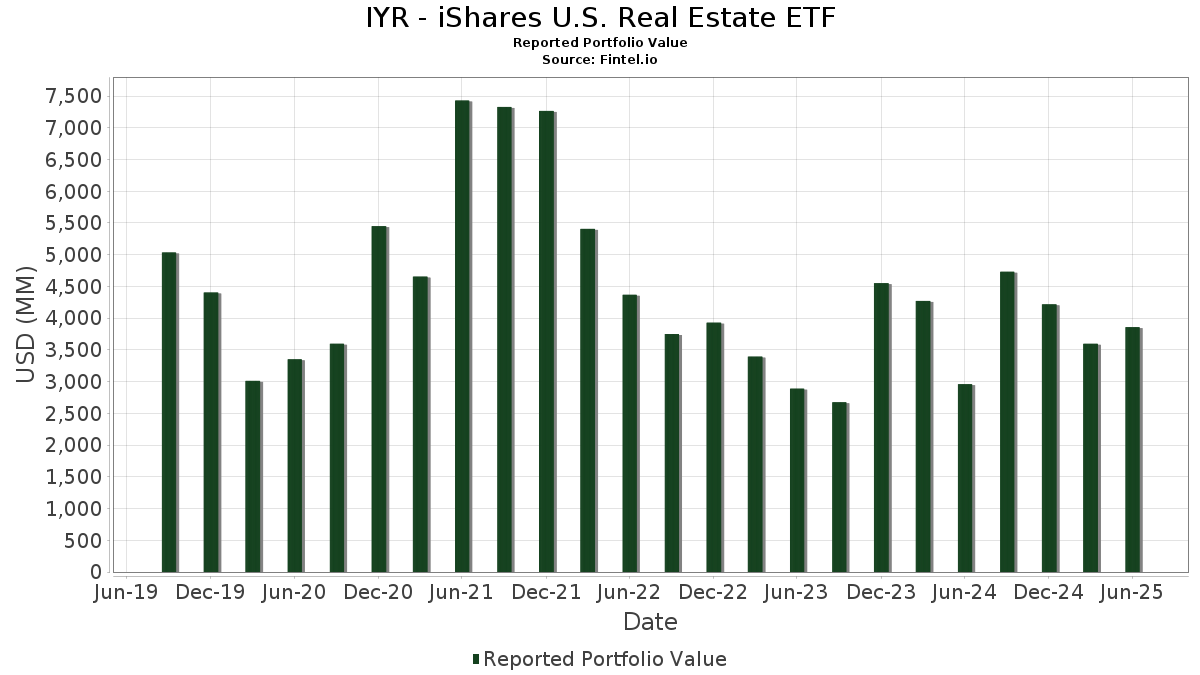
IYR - iShares U.S. Real Estate ETF har redovisat 68 totala innehav i sina senaste SEC-arkiveringar. Det senaste portföljvärdet beräknas vara $ 3 858 327 680 USD. Faktiskt förvaltade tillgångar (AUM) är detta värde plus likvida medel (som inte redovisas). IYR - iShares U.S. Real Estate ETFs största innehav är American Tower Corporation (US:AMT) , Prologis, Inc. (US:PLD) , Welltower Inc. (US:WELL) , Digital Realty Trust, Inc. (US:DLR) , and Equinix, Inc. (US:EQIX) .
Största ökningarna detta kvartal
Vi använder förändringen i portföljallokeringen eftersom det är det mest meningsfulla måttet. Förändringar kan bero på transaktioner eller förändringar i aktiekurser.
| Värdepapper | Aktier (MM) |
Värde (MM$) |
Portfölj % av | ΔPortfölj % av |
|---|---|---|---|---|
| 0,94 | 164,10 | 4,2442 | 0,7919 | |
| 0,88 | 89,98 | 2,3272 | 0,4030 | |
| 0,87 | 122,34 | 3,1642 | 0,2210 | |
| 1,80 | 276,16 | 7,1423 | 0,2076 | |
| 1,35 | 299,18 | 7,7378 | 0,1835 | |
| 0,32 | 75,03 | 1,9406 | 0,1395 | |
| 2,69 | 154,69 | 4,0009 | 0,1353 | |
| 3,03 | 27,88 | 0,7211 | 0,0666 | |
| 1,25 | 100,86 | 2,6085 | 0,0663 | |
| 2,06 | 31,68 | 0,8194 | 0,0631 |
Största minskningarna detta kvartal
Vi använder förändringen i portföljallokeringen eftersom det är det mest meningsfulla måttet. Förändringar kan bero på transaktioner eller förändringar i aktiepriser.
| Värdepapper | Aktier (MM) |
Värde (MM$) |
Portfölj % av | ΔPortfölj % av |
|---|---|---|---|---|
| 6,08 | 6,08 | 0,1572 | −0,8347 | |
| 2,68 | 282,05 | 7,2947 | −0,4031 | |
| 0,46 | 33,25 | 0,8599 | −0,2251 | |
| 0,20 | 155,17 | 4,0133 | −0,2133 | |
| 2,16 | 55,40 | 1,4329 | −0,1847 | |
| 0,35 | 51,52 | 1,3324 | −0,1592 | |
| 2,07 | 36,17 | 0,9355 | −0,1415 | |
| 1,34 | 84,74 | 2,1916 | −0,0969 | |
| 0,19 | 54,25 | 1,4032 | −0,0969 | |
| 0,42 | 86,04 | 2,2252 | −0,0963 |
13F- och fond arkiveringar
Denna blankett lämnades in den 2025-08-26 för rapporteringsperioden 2025-06-30. Klicka på länksymbolen för att se hela transaktionshistoriken.
Uppgradera för att låsa upp premiumdata och exportera till Excel![]() .
.
| Värdepapper | Typ | Genomsnittligt aktiepris | Aktier (MM) |
ΔAktier (%) |
ΔAktier (%) |
Värde ($MM) |
Portfölj (%) |
ΔPortfölj (%) |
|
|---|---|---|---|---|---|---|---|---|---|
| AMT / American Tower Corporation | 1,35 | 9,19 | 299,18 | 10,91 | 7,7378 | 0,1835 | |||
| PLD / Prologis, Inc. | 2,68 | 9,12 | 282,05 | 2,61 | 7,2947 | −0,4031 | |||
| WELL / Welltower Inc. | 1,80 | 11,14 | 276,16 | 11,52 | 7,1423 | 0,2076 | |||
| DLR / Digital Realty Trust, Inc. | 0,94 | 9,41 | 164,10 | 33,12 | 4,2442 | 0,7919 | |||
| EQIX / Equinix, Inc. | 0,20 | 5,38 | 155,17 | 2,81 | 4,0133 | −0,2133 | |||
| O / Realty Income Corporation | 2,69 | 12,85 | 154,69 | 12,07 | 4,0009 | 0,1353 | |||
| SPG / Simon Property Group, Inc. | 0,91 | 9,41 | 146,67 | 5,91 | 3,7933 | −0,0849 | |||
| PSA / Public Storage | 0,47 | 9,57 | 137,75 | 7,42 | 3,5627 | −0,0285 | |||
| CCI / Crown Castle Inc. | 1,29 | 9,58 | 133,01 | 8,00 | 3,4402 | −0,0087 | |||
| CBRE / CBRE Group, Inc. | 0,87 | 8,65 | 122,34 | 16,41 | 3,1642 | 0,2210 | |||
| VICI / VICI Properties Inc. | 3,14 | 9,63 | 102,43 | 9,56 | 2,6491 | 0,0310 | |||
| CSGP / CoStar Group, Inc. | 1,25 | 9,48 | 100,86 | 11,10 | 2,6085 | 0,0663 | |||
| EXR / Extra Space Storage Inc. | 0,63 | 9,48 | 93,03 | 8,71 | 2,4061 | 0,0095 | |||
| IRM / Iron Mountain Incorporated | 0,88 | 9,85 | 89,98 | 30,95 | 2,3272 | 0,4030 | |||
| AVB / AvalonBay Communities, Inc. | 0,42 | 9,46 | 86,04 | 3,79 | 2,2252 | −0,0963 | |||
| VTR / Ventas, Inc. | 1,34 | 12,91 | 84,74 | 3,69 | 2,1916 | −0,0969 | |||
| SBAC / SBA Communications Corporation | 0,32 | 9,29 | 75,03 | 16,66 | 1,9406 | 0,1395 | |||
| EQR / Equity Residential | 1,02 | 9,43 | 68,62 | 3,18 | 1,7748 | −0,0877 | |||
| INVH / Invitation Homes Inc. | 1,69 | 9,43 | 55,59 | 2,99 | 1,4379 | −0,0738 | |||
| WY / Weyerhaeuser Company | 2,16 | 9,32 | 55,40 | −4,08 | 1,4329 | −0,1847 | |||
| ESS / Essex Property Trust, Inc. | 0,19 | 9,57 | 54,25 | 1,29 | 1,4032 | −0,0969 | |||
| MAA / Mid-America Apartment Communities, Inc. | 0,35 | 9,51 | 51,52 | −3,28 | 1,3324 | −0,1592 | |||
| SUI / Sun Communities, Inc. | 0,36 | 9,58 | 45,13 | 7,75 | 1,1671 | −0,0057 | |||
| KIM / Kimco Realty Corporation | 2,01 | 8,88 | 42,28 | 7,75 | 1,0935 | −0,0053 | |||
| WPC / W. P. Carey Inc. | 0,65 | 9,43 | 40,62 | 8,16 | 1,0505 | −0,0011 | |||
| GLPI / Gaming and Leisure Properties, Inc. | 0,82 | 9,54 | 38,15 | 0,46 | 0,9866 | −0,0768 | |||
| UDR / UDR, Inc. | 0,90 | 9,51 | 36,60 | −1,01 | 0,9466 | −0,0888 | |||
| DOC / Healthpeak Properties, Inc. | 2,07 | 8,61 | 36,17 | −5,95 | 0,9355 | −0,1415 | |||
| JLL / Jones Lang LaSalle Incorporated | 0,14 | 9,43 | 36,11 | 12,91 | 0,9338 | 0,0383 | |||
| CPT / Camden Property Trust | 0,32 | 9,52 | 35,80 | 0,92 | 0,9258 | −0,0675 | |||
| ELS / Equity LifeStyle Properties, Inc. | 0,57 | 9,44 | 35,06 | 1,19 | 0,9067 | −0,0635 | |||
| REG / Regency Centers Corporation | 0,49 | 9,46 | 34,60 | 5,71 | 0,8949 | −0,0218 | |||
| AMH / American Homes 4 Rent | 0,94 | 9,56 | 34,08 | 4,52 | 0,8815 | −0,0317 | |||
| NLY / Annaly Capital Management, Inc. | 1,80 | 14,42 | 33,86 | 6,02 | 0,8757 | −0,0186 | |||
| Z / Zillow Group, Inc. | 0,48 | 10,17 | 33,61 | 12,57 | 0,8692 | 0,0331 | |||
| ARE / Alexandria Real Estate Equities, Inc. | 0,46 | 9,30 | 33,25 | −14,19 | 0,8599 | −0,2251 | |||
| LAMR / Lamar Advertising Company | 0,26 | 9,41 | 31,74 | 16,70 | 0,8210 | 0,0592 | |||
| HST / Host Hotels & Resorts, Inc. | 2,06 | 8,53 | 31,68 | 17,31 | 0,8194 | 0,0631 | |||
| OHI / Omega Healthcare Investors, Inc. | 0,86 | 12,30 | 31,54 | 8,08 | 0,8156 | −0,0015 | |||
| BXP / Boston Properties, Inc. | 0,43 | 9,47 | 29,22 | 9,92 | 0,7557 | 0,0113 | |||
| CUBE / CubeSmart | 0,68 | 10,23 | 28,81 | 9,70 | 0,7450 | 0,0096 | |||
| AGNC / AGNC Investment Corp. | 3,03 | 24,35 | 27,88 | 19,29 | 0,7211 | 0,0666 | |||
| EGP / EastGroup Properties, Inc. | 0,16 | 10,42 | 26,06 | 4,76 | 0,6740 | −0,0226 | |||
| REXR / Rexford Industrial Realty, Inc. | 0,70 | 13,49 | 24,97 | 3,11 | 0,6459 | −0,0324 | |||
| NNN / NNN REIT, Inc. | 0,56 | 9,60 | 24,13 | 10,96 | 0,6241 | 0,0151 | |||
| ADC / Agree Realty Corporation | 0,33 | 12,20 | 23,85 | 6,20 | 0,6169 | −0,0121 | |||
| BRX / Brixmor Property Group Inc. | 0,91 | 9,41 | 23,70 | 7,31 | 0,6129 | −0,0055 | |||
| FRT / Federal Realty Investment Trust | 0,23 | 10,10 | 21,93 | 6,92 | 0,5671 | −0,0072 | |||
| STAG / STAG Industrial, Inc. | 0,55 | 9,39 | 20,13 | 9,88 | 0,5207 | 0,0076 | |||
| STWD / Starwood Property Trust, Inc. | 0,96 | 10,11 | 19,24 | 11,78 | 0,4977 | 0,0156 | |||
| VNO / Vornado Realty Trust | 0,50 | 9,99 | 18,99 | 13,71 | 0,4911 | 0,0235 | |||
| FR / First Industrial Realty Trust, Inc. | 0,39 | 9,37 | 18,95 | −2,45 | 0,4900 | −0,0539 | |||
| RITM / Rithm Capital Corp. | 1,58 | 11,35 | 17,80 | 9,80 | 0,4603 | 0,0064 | |||
| HR / Healthcare Realty Trust Incorporated | 1,04 | 8,45 | 16,57 | 1,77 | 0,4286 | −0,0274 | |||
| CUZ / Cousins Properties Incorporated | 0,50 | 9,53 | 14,99 | 11,49 | 0,3878 | 0,0112 | |||
| SBRA / Sabra Health Care REIT, Inc. | 0,71 | 9,94 | 13,05 | 16,05 | 0,3374 | 0,0226 | |||
| COLD / Americold Realty Trust, Inc. | 0,78 | 9,44 | 12,94 | −15,19 | 0,3347 | −0,0926 | |||
| KRC / Kilroy Realty Corporation | 0,32 | 9,36 | 10,85 | 14,53 | 0,2807 | 0,0153 | |||
| ZG / Zillow Group, Inc. | 0,15 | 4,47 | 10,58 | 7,01 | 0,2735 | −0,0032 | |||
| MRP / Millrose Properties, Inc. | 0,36 | 9,71 | 10,20 | 17,99 | 0,2638 | 0,0217 | |||
| RYN / Rayonier Inc. | 0,42 | 9,24 | 9,26 | −13,09 | 0,2395 | −0,0589 | |||
| PCH / PotlatchDeltic Corporation | 0,21 | 9,11 | 8,14 | −7,22 | 0,2105 | −0,0351 | |||
| LINE / Lineage, Inc. | 0,18 | 9,21 | 7,68 | −18,93 | 0,1987 | −0,0667 | |||
| US0669224778 / BlackRock Cash Funds: Treasury, SL Agency Shares | 6,79 | 29,63 | 6,79 | 29,64 | 0,1756 | 0,0289 | |||
| HHH / Howard Hughes Holdings Inc. | 0,09 | 11,33 | 6,18 | 1,44 | 0,1599 | −0,0108 | |||
| US0669225197 / BlackRock Cash Funds: Institutional, SL Agency Shares | 6,08 | −82,84 | 6,08 | −82,84 | 0,1572 | −0,8347 | |||
| SEG / Seaport Entertainment Group Inc. | 0,02 | 9,28 | 0,46 | −4,54 | 0,0120 | −0,0016 | |||
| DJ US REAL ESTATE SEP25 / DE (N/A) | −0,01 | −0,0001 | −0,0001 |