Grundläggande statistik
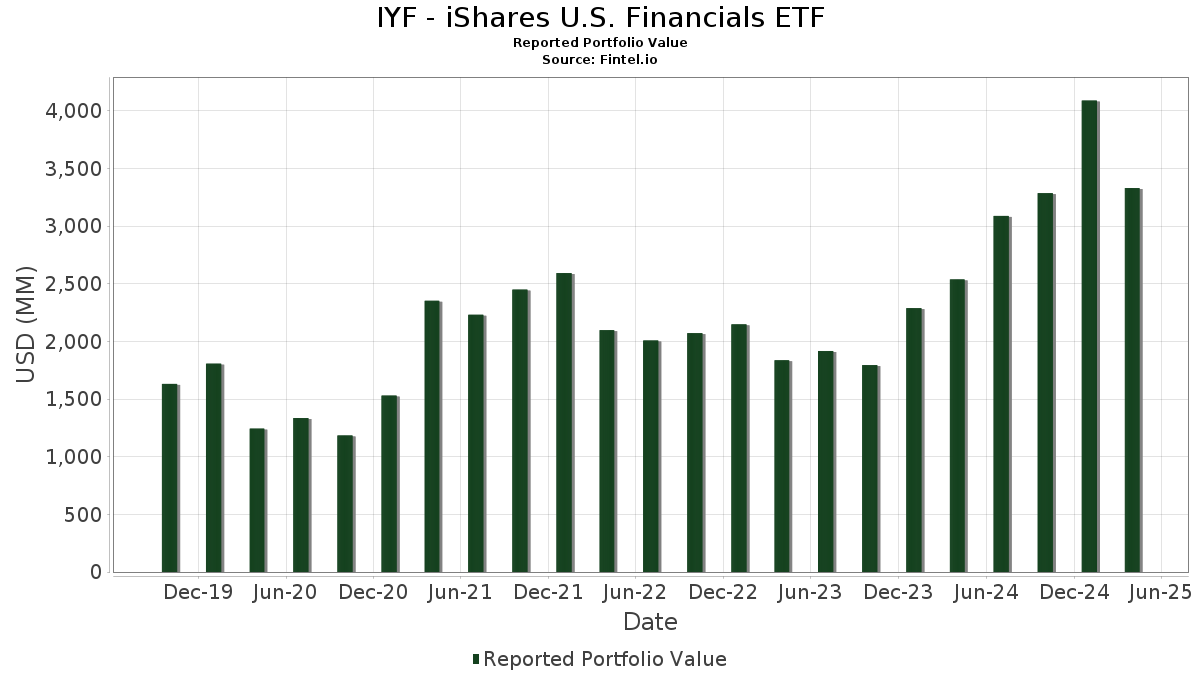
| Portföljvärde | $ 3 329 695 938 |
| Aktuella positioner | 141 |
Senaste innehav, resultat, förvaltat kapital (från 13F, 13D)
IYF - iShares U.S. Financials ETF har redovisat 141 totala innehav i sina senaste SEC-arkiveringar. Det senaste portföljvärdet beräknas vara $ 3 329 695 938 USD. Faktiskt förvaltade tillgångar (AUM) är detta värde plus likvida medel (som inte redovisas). IYF - iShares U.S. Financials ETFs största innehav är Berkshire Hathaway Inc. (US:BRK.B) , JPMorgan Chase & Co. (US:JPM) , Bank of America Corporation (US:BAC) , Wells Fargo & Company (US:WFC) , and The Goldman Sachs Group, Inc. (US:GS) .
Största ökningarna detta kvartal
Vi använder förändringen i portföljallokeringen eftersom det är det mest meningsfulla måttet. Förändringar kan bero på transaktioner eller förändringar i aktiekurser.
| Värdepapper | Aktier (MM) |
Värde (MM$) |
Portfölj % av | ΔPortfölj % av |
|---|---|---|---|---|
| 0,35 | 98,00 | 2,9494 | 0,6176 | |
| 0,78 | 418,43 | 12,5930 | 0,4211 | |
| 0,99 | 80,25 | 2,4153 | 0,4188 | |
| 0,21 | 59,26 | 1,7836 | 0,4075 | |
| 3,94 | 157,30 | 4,7341 | 0,3527 | |
| 0,24 | 68,88 | 2,0730 | 0,2923 | |
| 0,29 | 66,15 | 1,9908 | 0,2601 | |
| 0,34 | 56,78 | 1,7090 | 0,2391 | |
| 0,15 | 46,90 | 1,4116 | 0,2104 | |
| 0,19 | 93,13 | 2,8029 | 0,1617 |
Största minskningarna detta kvartal
Vi använder förändringen i portföljallokeringen eftersom det är det mest meningsfulla måttet. Förändringar kan bero på transaktioner eller förändringar i aktiepriser.
| Värdepapper | Aktier (MM) |
Värde (MM$) |
Portfölj % av | ΔPortfölj % av |
|---|---|---|---|---|
| 8,52 | 8,52 | 0,2565 | −2,9762 | |
| 1,26 | 308,30 | 9,2785 | −1,4998 | |
| 0,40 | 45,79 | 1,3780 | −0,4436 | |
| 0,43 | 56,56 | 1,7022 | −0,3662 | |
| 0,68 | 78,77 | 2,3706 | −0,2315 | |
| 0,18 | 98,29 | 2,9580 | −0,2234 | |
| 0,12 | 24,45 | 0,7357 | −0,2194 | |
| 1,13 | 77,01 | 2,3176 | −0,1774 | |
| 0,31 | 42,37 | 1,2751 | −0,1685 | |
| 0,09 | 80,33 | 2,4175 | −0,1525 |
13F- och fond arkiveringar
Denna blankett lämnades in den 2025-06-23 för rapporteringsperioden 2025-04-30. Klicka på länksymbolen för att se hela transaktionshistoriken.
Uppgradera för att låsa upp premiumdata och exportera till Excel![]() .
.
| Värdepapper | Typ | Genomsnittligt aktiepris | Aktier (MM) |
ΔAktier (%) |
ΔAktier (%) |
Värde ($MM) |
Portfölj (%) |
ΔPortfölj (%) |
|
|---|---|---|---|---|---|---|---|---|---|
| BRK.B / Berkshire Hathaway Inc. | 0,78 | −23,72 | 418,43 | −13,21 | 12,5930 | 0,4211 | |||
| JPM / JPMorgan Chase & Co. | 1,26 | −21,09 | 308,30 | −27,78 | 9,2785 | −1,4998 | |||
| BAC / Bank of America Corporation | 3,94 | 5,23 | 157,30 | −9,36 | 4,7341 | 0,3527 | |||
| WFC / Wells Fargo & Company | 1,96 | −6,25 | 138,98 | −15,52 | 4,1827 | 0,0293 | |||
| GS / The Goldman Sachs Group, Inc. | 0,18 | −8,78 | 98,29 | −22,00 | 2,9580 | −0,2234 | |||
| PGR / The Progressive Corporation | 0,35 | −7,19 | 98,00 | 6,11 | 2,9494 | 0,6176 | |||
| SPGI / S&P Global Inc. | 0,19 | −7,17 | 93,13 | −10,98 | 2,8029 | 0,1617 | |||
| BLK / BlackRock, Inc. | 0,09 | −7,17 | 80,33 | −21,09 | 2,4175 | −0,1525 | |||
| SCHW / The Charles Schwab Corporation | 0,99 | 3,13 | 80,25 | 1,49 | 2,4153 | 0,4188 | |||
| MS / Morgan Stanley | 0,68 | −8,34 | 78,77 | −23,57 | 2,3706 | −0,2315 | |||
| C / Citigroup Inc. | 1,13 | −7,21 | 77,01 | −22,08 | 2,3176 | −0,1774 | |||
| CB / Chubb Limited | 0,24 | −7,19 | 68,88 | −2,34 | 2,0730 | 0,2923 | |||
| MMC / Marsh & McLennan Companies, Inc. | 0,29 | −7,18 | 66,15 | −3,50 | 1,9908 | 0,2601 | |||
| CME / CME Group Inc. | 0,21 | −7,19 | 59,26 | 8,73 | 1,7836 | 0,4075 | |||
| ICE / Intercontinental Exchange, Inc. | 0,34 | −7,19 | 56,78 | −2,46 | 1,7090 | 0,2391 | |||
| BX / Blackstone Inc. | 0,43 | −7,17 | 56,56 | −30,96 | 1,7022 | −0,3662 | |||
| AJG / Arthur J. Gallagher & Co. | 0,15 | −7,22 | 46,90 | −1,42 | 1,4116 | 0,2104 | |||
| KKR / KKR & Co. Inc. | 0,40 | −7,22 | 45,79 | −36,54 | 1,3780 | −0,4436 | |||
| MCO / Moody's Corporation | 0,09 | −7,16 | 42,61 | −15,77 | 1,2825 | 0,0052 | |||
| APO / Apollo Global Management, Inc. | 0,31 | −7,18 | 42,37 | −25,90 | 1,2751 | −0,1685 | |||
| AON / Aon plc | 0,12 | −7,17 | 41,45 | −11,18 | 1,2474 | 0,0692 | |||
| PNC / The PNC Financial Services Group, Inc. | 0,24 | −7,18 | 37,96 | −25,78 | 1,1426 | −0,1488 | |||
| USB / U.S. Bancorp | 0,93 | −7,19 | 37,42 | −21,64 | 1,1262 | −0,0794 | |||
| AFL / Aflac Incorporated | 0,33 | −8,43 | 35,70 | −7,32 | 1,0743 | 0,1019 | |||
| TRV / The Travelers Companies, Inc. | 0,13 | −8,45 | 35,52 | −1,37 | 1,0691 | 0,1598 | |||
| BK / The Bank of New York Mellon Corporation | 0,43 | −9,95 | 34,38 | −15,74 | 1,0347 | 0,0046 | |||
| ALL / The Allstate Corporation | 0,16 | −7,52 | 31,00 | −4,60 | 0,9330 | 0,1126 | |||
| TFC / Truist Financial Corporation | 0,79 | −7,44 | 30,45 | −25,48 | 0,9163 | −0,1152 | |||
| AIG / American International Group, Inc. | 0,37 | −11,26 | 30,24 | −1,79 | 0,9102 | 0,1327 | |||
| DFS / Discover Financial Services | 0,15 | −7,26 | 27,17 | −15,76 | 0,8178 | 0,0034 | |||
| AMP / Ameriprise Financial, Inc. | 0,06 | −8,12 | 26,96 | −20,35 | 0,8114 | −0,0432 | |||
| MET / MetLife, Inc. | 0,34 | −9,04 | 25,95 | −20,76 | 0,7811 | −0,0458 | |||
| MSCI / MSCI Inc. | 0,05 | −7,12 | 24,66 | −15,16 | 0,7423 | 0,0083 | |||
| COIN / Coinbase Global, Inc. | 0,12 | −7,22 | 24,45 | −35,38 | 0,7357 | −0,2194 | |||
| NU / Nu Holdings Ltd. | 1,93 | −5,23 | 23,99 | −11,03 | 0,7220 | 0,0412 | |||
| PRU / Prudential Financial, Inc. | 0,21 | −7,60 | 21,96 | −21,41 | 0,6609 | −0,0445 | |||
| HIG / The Hartford Insurance Group, Inc. | 0,17 | −7,83 | 21,12 | 1,36 | 0,6357 | 0,1096 | |||
| HOOD / Robinhood Markets, Inc. | 0,40 | −7,38 | 19,63 | −12,45 | 0,5907 | 0,0248 | |||
| ACGL / Arch Capital Group Ltd. | 0,21 | −7,03 | 19,46 | −9,42 | 0,5856 | 0,0433 | |||
| NDAQ / Nasdaq, Inc. | 0,24 | −7,19 | 18,67 | −14,10 | 0,5619 | 0,0132 | |||
| WTW / Willis Towers Watson Public Limited Company | 0,06 | −7,45 | 18,43 | −13,57 | 0,5547 | 0,0163 | |||
| BR / Broadridge Financial Solutions, Inc. | 0,07 | −7,19 | 16,88 | −5,57 | 0,5080 | 0,0567 | |||
| ARES / Ares Management Corporation | 0,11 | −7,39 | 16,79 | −28,74 | 0,5052 | −0,0895 | |||
| MTB / M&T Bank Corporation | 0,10 | −7,29 | 16,78 | −21,79 | 0,5051 | −0,0367 | |||
| RJF / Raymond James Financial, Inc. | 0,12 | 2,12 | 16,52 | −16,94 | 0,4970 | −0,0050 | |||
| BRO / Brown & Brown, Inc. | 0,14 | −8,04 | 15,71 | −2,83 | 0,4729 | 0,0647 | |||
| STT / State Street Corporation | 0,17 | −7,36 | 15,34 | −19,68 | 0,4617 | −0,0205 | |||
| LPLA / LPL Financial Holdings Inc. | 0,05 | −1,32 | 15,05 | −13,99 | 0,4530 | 0,0112 | |||
| FITB / Fifth Third Bancorp | 0,40 | −7,59 | 14,44 | −25,04 | 0,4346 | −0,0518 | |||
| CBOE / Cboe Global Markets, Inc. | 0,06 | −7,15 | 13,92 | 0,78 | 0,4190 | 0,0702 | |||
| MKL / Markel Group Inc. | 0,01 | −7,61 | 13,67 | −8,13 | 0,4113 | 0,0358 | |||
| CINF / Cincinnati Financial Corporation | 0,09 | −8,05 | 12,68 | −6,60 | 0,3815 | 0,0388 | |||
| WRB / W. R. Berkley Corporation | 0,17 | −7,19 | 12,53 | 13,10 | 0,3771 | 0,0974 | |||
| HBAN / Huntington Bancshares Incorporated | 0,86 | −7,72 | 12,48 | −22,04 | 0,3755 | −0,0286 | |||
| FCNCA / First Citizens BancShares, Inc. | 0,01 | −10,57 | 12,21 | −27,83 | 0,3675 | −0,0597 | |||
| TROW / T. Rowe Price Group, Inc. | 0,14 | −2,83 | 12,09 | −26,41 | 0,3640 | −0,0509 | |||
| RF / Regions Financial Corporation | 0,54 | −9,12 | 11,03 | −24,72 | 0,3319 | −0,0380 | |||
| NTRS / Northern Trust Corporation | 0,12 | −8,25 | 10,83 | −23,21 | 0,3259 | −0,0301 | |||
| IBKR / Interactive Brokers Group, Inc. | 0,06 | −7,66 | 10,79 | −27,02 | 0,3248 | −0,0486 | |||
| PFG / Principal Financial Group, Inc. | 0,13 | −7,20 | 10,01 | −16,54 | 0,3011 | −0,0016 | |||
| FNF / Fidelity National Financial, Inc. | 0,15 | −8,08 | 9,88 | 1,22 | 0,2975 | 0,0509 | |||
| FDS / FactSet Research Systems Inc. | 0,02 | −7,25 | 9,77 | −15,50 | 0,2940 | 0,0021 | |||
| CFG / Citizens Financial Group, Inc. | 0,26 | −8,77 | 9,76 | −29,25 | 0,2937 | −0,0545 | |||
| TW / Tradeweb Markets Inc. | 0,07 | −5,98 | 9,67 | 2,47 | 0,2911 | 0,0528 | |||
| L / Loews Corporation | 0,11 | −6,52 | 9,37 | −5,00 | 0,2819 | 0,0330 | |||
| EG / Everest Group, Ltd. | 0,03 | −7,25 | 9,18 | −4,23 | 0,2762 | 0,0343 | |||
| US0669225197 / BlackRock Cash Funds: Institutional, SL Agency Shares | 8,52 | −93,34 | 8,52 | −93,34 | 0,2565 | −2,9762 | |||
| UNM / Unum Group | 0,11 | 4,55 | 8,38 | 6,48 | 0,2524 | 0,0536 | |||
| KEY / KeyCorp | 0,56 | −6,83 | 8,29 | −23,10 | 0,2495 | −0,0227 | |||
| SOFI / SoFi Technologies, Inc. | 0,65 | −5,00 | 8,08 | −24,69 | 0,2432 | −0,0277 | |||
| EQH / Equitable Holdings, Inc. | 0,16 | 0,00 | 7,77 | −9,13 | 0,2339 | 0,0180 | |||
| RNR / RenaissanceRe Holdings Ltd. | 0,03 | −5,82 | 7,49 | −2,03 | 0,2254 | 0,0324 | |||
| RGA / Reinsurance Group of America, Incorporated | 0,04 | −7,41 | 7,44 | −23,88 | 0,2239 | −0,0229 | |||
| EWBC / East West Bancorp, Inc. | 0,08 | −5,95 | 7,15 | −21,86 | 0,2153 | −0,0158 | |||
| NLY / Annaly Capital Management, Inc. | 0,34 | −5,49 | 6,65 | −9,24 | 0,2002 | 0,0151 | |||
| US0669224778 / BlackRock Cash Funds: Treasury, SL Agency Shares | 6,32 | −45,78 | 6,32 | −45,77 | 0,1901 | −0,1040 | |||
| GL / Globe Life Inc. | 0,05 | −14,03 | 6,20 | −13,15 | 0,1866 | 0,0064 | |||
| AIZ / Assurant, Inc. | 0,03 | −9,03 | 5,98 | −18,52 | 0,1800 | −0,0053 | |||
| OWL / Blue Owl Capital Inc. | 0,32 | −4,46 | 5,90 | −31,95 | 0,1776 | −0,0413 | |||
| KNSL / Kinsale Capital Group, Inc. | 0,01 | −5,66 | 5,81 | −7,08 | 0,1749 | 0,0170 | |||
| FHN / First Horizon Corporation | 0,32 | −8,74 | 5,72 | −24,62 | 0,1721 | −0,0194 | |||
| AFG / American Financial Group, Inc. | 0,04 | −7,46 | 5,52 | −14,17 | 0,1661 | 0,0038 | |||
| ALLY / Ally Financial Inc. | 0,16 | −7,57 | 5,33 | −22,54 | 0,1604 | −0,0133 | |||
| ORI / Old Republic International Corporation | 0,14 | −9,87 | 5,29 | −7,35 | 0,1593 | 0,0150 | |||
| PRI / Primerica, Inc. | 0,02 | −9,14 | 5,29 | −17,94 | 0,1592 | −0,0035 | |||
| HLI / Houlihan Lokey, Inc. | 0,03 | −3,83 | 5,24 | −14,22 | 0,1576 | 0,0035 | |||
| SF / Stifel Financial Corp. | 0,06 | −5,69 | 5,17 | −30,25 | 0,1556 | −0,0315 | |||
| CG / The Carlyle Group Inc. | 0,13 | −5,91 | 5,15 | −35,26 | 0,1551 | −0,0459 | |||
| MKTX / MarketAxess Holdings Inc. | 0,02 | −4,86 | 4,99 | −4,44 | 0,1502 | 0,0183 | |||
| JEF / Jefferies Financial Group Inc. | 0,11 | −6,74 | 4,97 | −43,32 | 0,1495 | −0,0718 | |||
| WBS / Webster Financial Corporation | 0,10 | −6,81 | 4,93 | −26,83 | 0,1483 | −0,0217 | |||
| AGNC / AGNC Investment Corp. | 0,53 | 1,34 | 4,66 | −10,24 | 0,1404 | 0,0092 | |||
| SEIC / SEI Investments Company | 0,06 | −7,19 | 4,65 | −16,08 | 0,1400 | 0,0001 | |||
| MORN / Morningstar, Inc. | 0,02 | −4,71 | 4,64 | −17,44 | 0,1396 | −0,0023 | |||
| PNFP / Pinnacle Financial Partners, Inc. | 0,05 | −6,54 | 4,64 | −24,91 | 0,1395 | −0,0164 | |||
| CBSH / Commerce Bancshares, Inc. | 0,08 | −4,63 | 4,58 | −13,28 | 0,1378 | 0,0045 | |||
| WAL / Western Alliance Bancorporation | 0,07 | −6,75 | 4,57 | −26,03 | 0,1376 | −0,0184 | |||
| AXS / AXIS Capital Holdings Limited | 0,05 | −8,35 | 4,51 | −3,01 | 0,1357 | 0,0183 | |||
| WTFC / Wintrust Financial Corporation | 0,04 | −5,41 | 4,41 | −19,62 | 0,1328 | −0,0058 | |||
| CMA / Comerica Incorporated | 0,08 | −3,64 | 4,36 | −23,07 | 0,1311 | −0,0118 | |||
| EVR / Evercore Inc. | 0,02 | −9,53 | 4,33 | −36,24 | 0,1303 | −0,0411 | |||
| CFR / Cullen/Frost Bankers, Inc. | 0,04 | −4,41 | 4,20 | −20,13 | 0,1263 | −0,0064 | |||
| RYAN / Ryan Specialty Holdings, Inc. | 0,06 | −8,13 | 4,09 | −9,60 | 0,1231 | 0,0089 | |||
| BPOP / Popular, Inc. | 0,04 | −6,92 | 4,06 | −13,71 | 0,1221 | 0,0034 | |||
| XP / XP Inc. | 0,25 | −7,16 | 4,04 | 9,48 | 0,1217 | 0,0285 | |||
| ZION / Zions Bancorporation, National Association | 0,09 | −8,43 | 3,87 | −28,84 | 0,1164 | −0,0208 | |||
| MTG / MGIC Investment Corporation | 0,15 | −6,47 | 3,84 | −8,77 | 0,1156 | 0,0093 | |||
| SNV / Synovus Financial Corp. | 0,09 | −8,68 | 3,78 | −29,87 | 0,1136 | −0,0223 | |||
| RLI / RLI Corp. | 0,05 | −3,38 | 3,76 | −2,52 | 0,1131 | 0,0158 | |||
| STWD / Starwood Property Trust, Inc. | 0,20 | −3,74 | 3,75 | −4,53 | 0,1129 | 0,0137 | |||
| PB / Prosperity Bancshares, Inc. | 0,05 | −4,35 | 3,73 | −18,81 | 0,1124 | −0,0037 | |||
| THG / The Hanover Insurance Group, Inc. | 0,02 | −5,83 | 3,65 | 2,19 | 0,1097 | 0,0196 | |||
| SLM / SLM Corporation | 0,13 | −8,51 | 3,62 | −5,23 | 0,1091 | 0,0125 | |||
| FAF / First American Financial Corporation | 0,06 | −10,43 | 3,58 | −13,83 | 0,1078 | 0,0028 | |||
| BEN / Franklin Resources, Inc. | 0,19 | 1,93 | 3,58 | −14,02 | 0,1076 | 0,0026 | |||
| RITM / Rithm Capital Corp. | 0,32 | −8,15 | 3,57 | −10,78 | 0,1074 | 0,0064 | |||
| VOYA / Voya Financial, Inc. | 0,06 | −6,23 | 3,50 | −21,82 | 0,1055 | −0,0077 | |||
| OMF / OneMain Holdings, Inc. | 0,07 | −8,01 | 3,28 | −22,04 | 0,0986 | −0,0075 | |||
| AMG / Affiliated Managers Group, Inc. | 0,02 | −2,37 | 3,04 | −13,98 | 0,0915 | 0,0023 | |||
| IVZ / Invesco Ltd. | 0,22 | −10,43 | 3,03 | −35,13 | 0,0912 | −0,0267 | |||
| COLB / Columbia Banking System, Inc. | 0,13 | −4,72 | 2,90 | −23,43 | 0,0873 | −0,0083 | |||
| FNB / F.N.B. Corporation | 0,22 | −6,96 | 2,89 | −22,38 | 0,0871 | −0,0070 | |||
| AGO / Assured Guaranty Ltd. | 0,03 | −8,91 | 2,73 | −15,51 | 0,0823 | 0,0006 | |||
| OZK / Bank OZK | 0,06 | −7,16 | 2,69 | −22,13 | 0,0810 | −0,0063 | |||
| WTM / White Mountains Insurance Group, Ltd. | 0,00 | −6,29 | 2,66 | −14,29 | 0,0800 | 0,0017 | |||
| LAZ / Lazard, Inc. | 0,07 | −6,54 | 2,65 | −33,14 | 0,0799 | −0,0203 | |||
| JHG / Janus Henderson Group plc | 0,08 | −5,75 | 2,64 | −30,34 | 0,0794 | −0,0162 | |||
| LNC / Lincoln National Corporation | 0,08 | 0,00 | 2,47 | −9,38 | 0,0745 | 0,0056 | |||
| TPG / TPG Inc. | 0,05 | −5,91 | 2,47 | −35,00 | 0,0743 | −0,0216 | |||
| KMPR / Kemper Corporation | 0,04 | −6,23 | 2,26 | −17,48 | 0,0681 | −0,0011 | |||
| BHF / Brighthouse Financial, Inc. | 0,04 | −10,43 | 2,20 | −15,53 | 0,0663 | 0,0005 | |||
| VIRT / Virtu Financial, Inc. | 0,05 | −7,10 | 2,00 | −9,19 | 0,0601 | 0,0046 | |||
| CACC / Credit Acceptance Corporation | 0,00 | −2,96 | 1,90 | −6,87 | 0,0572 | 0,0057 | |||
| FHB / First Hawaiian, Inc. | 0,08 | −0,71 | 1,85 | −17,80 | 0,0557 | −0,0012 | |||
| BOKF / BOK Financial Corporation | 0,01 | −1,47 | 1,37 | −16,86 | 0,0413 | −0,0004 | |||
| RKT / Rocket Companies, Inc. | 0,09 | −3,12 | 1,18 | −0,76 | 0,0355 | 0,0055 | |||
| CNA / CNA Financial Corporation | 0,02 | −12,14 | 0,74 | −13,69 | 0,0224 | 0,0006 | |||
| TFSL / TFS Financial Corporation | 0,04 | 21,60 | 0,52 | 14,96 | 0,0155 | 0,0042 | |||
| UWMC / UWM Holdings Corporation | 0,08 | 3,51 | 0,38 | −19,20 | 0,0115 | −0,0005 | |||
| XAF FINANCIAL JUN25 / DE (N/A) | 0,21 | 0,0063 | 0,0063 | ||||||
| S P MID 400 EMINI JUN25 / DE (N/A) | 0,04 | 0,0012 | 0,0012 |