Grundläggande statistik
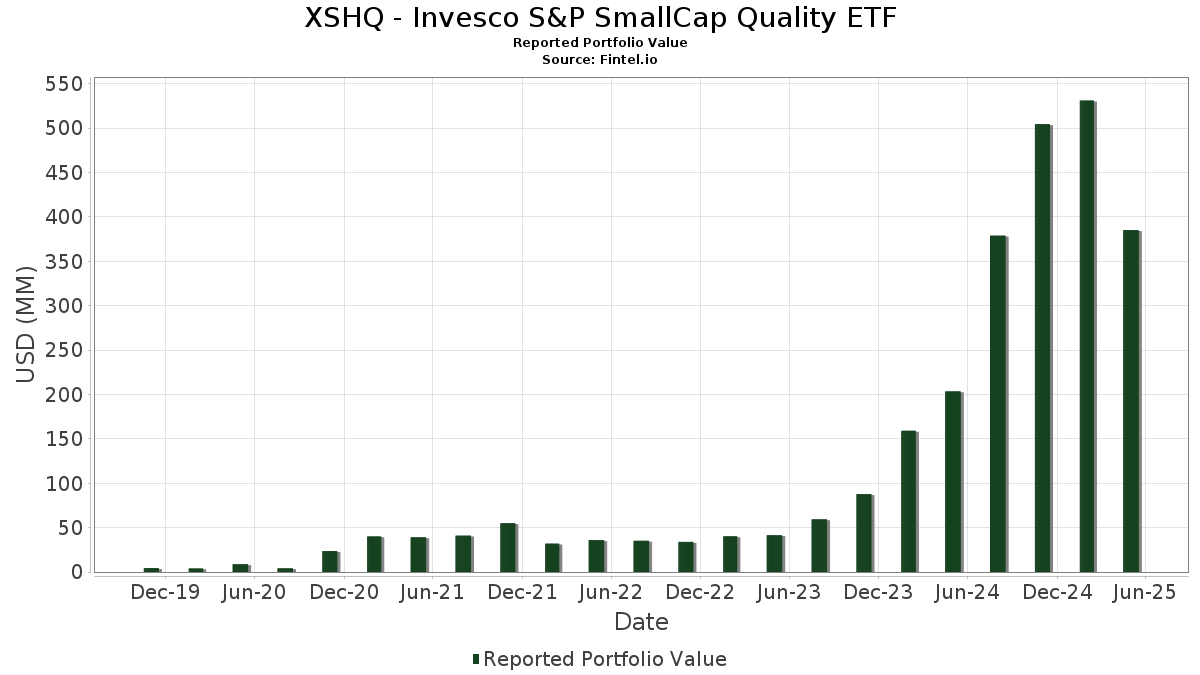
| Portföljvärde | $ 385 099 588 |
| Aktuella positioner | 119 |
Senaste innehav, resultat, förvaltat kapital (från 13F, 13D)
XSHQ - Invesco S&P SmallCap Quality ETF har redovisat 119 totala innehav i sina senaste SEC-arkiveringar. Det senaste portföljvärdet beräknas vara $ 385 099 588 USD. Faktiskt förvaltade tillgångar (AUM) är detta värde plus likvida medel (som inte redovisas). XSHQ - Invesco S&P SmallCap Quality ETFs största innehav är Corcept Therapeutics Incorporated (US:CORT) , Armstrong World Industries, Inc. (US:AWI) , Badger Meter, Inc. (US:BMI) , PJT Partners Inc. (US:PJT) , and InterDigital, Inc. (US:IDCC) .
Största ökningarna detta kvartal
Vi använder förändringen i portföljallokeringen eftersom det är det mest meningsfulla måttet. Förändringar kan bero på transaktioner eller förändringar i aktiekurser.
| Värdepapper | Aktier (MM) |
Värde (MM$) |
Portfölj % av | ΔPortfölj % av |
|---|---|---|---|---|
| 47,63 | 47,63 | 14,8524 | 14,8524 | |
| 18,16 | 18,16 | 5,6646 | 5,6646 | |
| 0,12 | 9,46 | 2,9515 | 0,7442 | |
| 0,09 | 5,07 | 1,5812 | 0,4936 | |
| 0,03 | 4,80 | 1,4982 | 0,4222 | |
| 0,12 | 6,46 | 2,0146 | 0,4201 | |
| 0,03 | 7,12 | 2,2211 | 0,4187 | |
| 0,30 | 5,87 | 1,8316 | 0,3831 | |
| 0,06 | 5,66 | 1,7662 | 0,3056 | |
| 0,06 | 3,69 | 1,1497 | 0,2849 |
Största minskningarna detta kvartal
Vi använder förändringen i portföljallokeringen eftersom det är det mest meningsfulla måttet. Förändringar kan bero på transaktioner eller förändringar i aktiepriser.
| Värdepapper | Aktier (MM) |
Värde (MM$) |
Portfölj % av | ΔPortfölj % av |
|---|---|---|---|---|
| 0,11 | 5,20 | 1,6214 | −0,3814 | |
| 0,12 | 2,72 | 0,8480 | −0,2853 | |
| 0,03 | 3,93 | 1,2245 | −0,2728 | |
| 0,01 | 3,70 | 1,1534 | −0,1833 | |
| 0,03 | 1,80 | 0,5610 | −0,1595 | |
| 0,07 | 1,76 | 0,5492 | −0,1503 | |
| 0,04 | 3,29 | 1,0247 | −0,1455 | |
| 0,04 | 3,39 | 1,0562 | −0,1389 | |
| 0,06 | 2,65 | 0,8274 | −0,1323 | |
| 0,19 | 5,76 | 1,7955 | −0,1322 |
13F- och fond arkiveringar
Denna blankett lämnades in den 2025-07-28 för rapporteringsperioden 2025-05-31. Klicka på länksymbolen för att se hela transaktionshistoriken.
Uppgradera för att låsa upp premiumdata och exportera till Excel![]() .
.
| Värdepapper | Typ | Genomsnittligt aktiepris | Aktier (MM) |
ΔAktier (%) |
ΔAktier (%) |
Värde ($MM) |
Portfölj (%) |
ΔPortfölj (%) |
|
|---|---|---|---|---|---|---|---|---|---|
| Invesco Private Prime Fund / STIV (N/A) | 47,63 | 47,63 | 14,8524 | 14,8524 | |||||
| Invesco Private Government Fund / STIV (N/A) | 18,16 | 18,16 | 5,6646 | 5,6646 | |||||
| CORT / Corcept Therapeutics Incorporated | 0,12 | −25,17 | 9,46 | −4,19 | 2,9515 | 0,7442 | |||
| AWI / Armstrong World Industries, Inc. | 0,06 | −25,18 | 9,02 | −24,22 | 2,8114 | 0,1531 | |||
| BMI / Badger Meter, Inc. | 0,03 | −25,18 | 7,12 | −11,70 | 2,2211 | 0,4187 | |||
| PJT / PJT Partners Inc. | 0,05 | −25,21 | 6,97 | −29,26 | 2,1732 | −0,0278 | |||
| IDCC / InterDigital, Inc. | 0,03 | −25,19 | 6,75 | −23,92 | 2,1065 | 0,1227 | |||
| FTDR / Frontdoor, Inc. | 0,12 | −25,15 | 6,46 | −9,46 | 2,0146 | 0,4201 | |||
| APAM / Artisan Partners Asset Management Inc. | 0,15 | −25,16 | 6,20 | −28,57 | 1,9347 | −0,0058 | |||
| ADMA / ADMA Biologics, Inc. | 0,30 | −25,15 | 5,87 | −9,40 | 1,8316 | 0,3831 | |||
| KTB / Kontoor Brands, Inc. | 0,08 | −25,17 | 5,81 | −21,08 | 1,8134 | 0,1672 | |||
| ALKS / Alkermes plc | 0,19 | −25,15 | 5,76 | −33,26 | 1,7955 | −0,1322 | |||
| FSS / Federal Signal Corporation | 0,06 | −25,14 | 5,66 | −13,36 | 1,7662 | 0,3056 | |||
| IBP / Installed Building Products, Inc. | 0,03 | −25,14 | 5,25 | −30,35 | 1,6375 | −0,0470 | |||
| RHI / Robert Half Inc. | 0,11 | −25,14 | 5,20 | −41,99 | 1,6214 | −0,3814 | |||
| CSW / CSW Industrials, Inc. | 0,02 | −25,17 | 5,19 | −25,24 | 1,6186 | 0,0672 | |||
| ECG / Everus Construction Group, Inc. | 0,09 | −25,17 | 5,07 | 4,17 | 1,5812 | 0,4936 | |||
| BCPC / Balchem Corporation | 0,03 | −25,17 | 4,88 | −28,32 | 1,5217 | 0,0006 | |||
| PLMR / Palomar Holdings, Inc. | 0,03 | −25,14 | 4,80 | −0,23 | 1,4982 | 0,4222 | |||
| RDN / Radian Group Inc. | 0,14 | −25,16 | 4,72 | −22,34 | 1,4705 | 0,1138 | |||
| AX / Axos Financial, Inc. | 0,06 | −25,13 | 4,51 | −22,05 | 1,4077 | 0,1137 | |||
| WDFC / WD-40 Company | 0,02 | −25,10 | 4,50 | −23,53 | 1,4030 | 0,0885 | |||
| YOU / Clear Secure, Inc. | 0,18 | −25,16 | 4,47 | −21,88 | 1,3945 | 0,1156 | |||
| SKYW / SkyWest, Inc. | 0,04 | −25,14 | 4,08 | −23,23 | 1,2722 | 0,0850 | |||
| CRVL / CorVel Corporation | 0,04 | −25,13 | 3,94 | −24,44 | 1,2291 | 0,0634 | |||
| MATX / Matson, Inc. | 0,03 | −25,19 | 3,93 | −41,40 | 1,2245 | −0,2728 | |||
| PI / Impinj, Inc. | 0,03 | −25,17 | 3,83 | −11,68 | 1,1952 | 0,2256 | |||
| MDU / MDU Resources Group, Inc. | 0,22 | −25,16 | 3,79 | −25,43 | 1,1806 | 0,0463 | |||
| AGO / Assured Guaranty Ltd. | 0,04 | −25,18 | 3,76 | −27,56 | 1,1735 | 0,0127 | |||
| CVCO / Cavco Industries, Inc. | 0,01 | −25,21 | 3,70 | −38,18 | 1,1534 | −0,1833 | |||
| SIG / Signet Jewelers Limited | 0,06 | −25,14 | 3,69 | −4,75 | 1,1497 | 0,2849 | |||
| JBTM / JBT Marel Corporation | 0,03 | −25,19 | 3,62 | −34,94 | 1,1303 | −0,1144 | |||
| FBP / First BanCorp. | 0,18 | −25,15 | 3,53 | −23,18 | 1,1018 | 0,0740 | |||
| NMIH / NMI Holdings, Inc. | 0,09 | −25,15 | 3,39 | −18,41 | 1,0587 | 0,1290 | |||
| FELE / Franklin Electric Co., Inc. | 0,04 | −25,12 | 3,39 | −36,69 | 1,0562 | −0,1389 | |||
| DORM / Dorman Products, Inc. | 0,03 | −25,23 | 3,37 | −26,46 | 1,0515 | 0,0271 | |||
| NCR / NCR Corp. | 0,30 | −25,15 | 3,36 | −26,41 | 1,0480 | 0,0275 | |||
| TBBK / The Bancorp, Inc. | 0,07 | −25,15 | 3,33 | −31,49 | 1,0377 | −0,0474 | |||
| BCC / Boise Cascade Company | 0,04 | −25,14 | 3,29 | −37,27 | 1,0247 | −0,1455 | |||
| MHO / M/I Homes, Inc. | 0,03 | −25,19 | 3,28 | −31,91 | 1,0236 | −0,0535 | |||
| PINC / Premier, Inc. | 0,14 | −25,15 | 3,16 | −5,39 | 0,9855 | 0,2392 | |||
| CRC / California Resources Corporation | 0,07 | −25,14 | 3,12 | −25,91 | 0,9739 | 0,0322 | |||
| BRC / Brady Corporation | 0,04 | −25,15 | 3,07 | −27,94 | 0,9587 | 0,0054 | |||
| CNS / Cohen & Steers, Inc. | 0,04 | −25,15 | 3,07 | −34,20 | 0,9576 | −0,0850 | |||
| OTTR / Otter Tail Corporation | 0,04 | −25,15 | 2,98 | −27,55 | 0,9285 | 0,0104 | |||
| PTGX / Protagonist Therapeutics, Inc. | 0,06 | −25,17 | 2,91 | −5,50 | 0,9064 | 0,2191 | |||
| GSHD / Goosehead Insurance, Inc | 0,03 | −25,12 | 2,87 | −34,20 | 0,8952 | −0,0797 | |||
| GFF / Griffon Corporation | 0,04 | −25,11 | 2,86 | −28,82 | 0,8926 | −0,0060 | |||
| MCY / Mercury General Corporation | 0,04 | −25,13 | 2,81 | −10,49 | 0,8754 | 0,1747 | |||
| SM / SM Energy Company | 0,12 | −25,12 | 2,72 | −46,39 | 0,8480 | −0,2853 | |||
| ASO / Academy Sports and Outdoors, Inc. | 0,06 | −25,12 | 2,65 | −38,22 | 0,8274 | −0,1323 | |||
| PATK / Patrick Industries, Inc. | 0,03 | −25,11 | 2,63 | −29,03 | 0,8204 | −0,0079 | |||
| POWL / Powell Industries, Inc. | 0,02 | −25,11 | 2,62 | −25,18 | 0,8185 | 0,0349 | |||
| CNR / Core Natural Resources, Inc. | 0,04 | −25,12 | 2,52 | −30,11 | 0,7847 | −0,0198 | |||
| CASH / Pathward Financial, Inc. | 0,03 | −25,14 | 2,51 | −24,64 | 0,7824 | 0,0388 | |||
| YELP / Yelp Inc. | 0,06 | −25,17 | 2,43 | −16,75 | 0,7579 | 0,1056 | |||
| AGYS / Agilysys, Inc. | 0,02 | −25,24 | 2,42 | −2,22 | 0,7555 | 0,2018 | |||
| UE / Urban Edge Properties | 0,13 | −25,15 | 2,38 | −34,02 | 0,7429 | −0,0638 | |||
| EPAC / Enerpac Tool Group Corp. | 0,05 | −25,12 | 2,35 | −30,59 | 0,7317 | −0,0238 | |||
| BANF / BancFirst Corporation | 0,02 | −25,14 | 2,31 | −22,42 | 0,7189 | 0,0550 | |||
| LCII / LCI Industries | 0,03 | −25,07 | 2,26 | −37,11 | 0,7040 | −0,0981 | |||
| HWKN / Hawkins, Inc. | 0,02 | −25,08 | 2,25 | −4,78 | 0,7029 | 0,1742 | |||
| IPAR / Interparfums, Inc. | 0,02 | −25,27 | 2,23 | −26,73 | 0,6969 | 0,0155 | |||
| AEO / American Eagle Outfitters, Inc. | 0,20 | −25,15 | 2,20 | −37,33 | 0,6865 | −0,0983 | |||
| SUPN / Supernus Pharmaceuticals, Inc. | 0,07 | −25,11 | 2,13 | −25,97 | 0,6651 | 0,0215 | |||
| HCI / HCI Group, Inc. | 0,01 | −25,19 | 2,12 | −4,11 | 0,6616 | 0,1672 | |||
| WOR / Worthington Enterprises, Inc. | 0,04 | −25,25 | 2,11 | 4,88 | 0,6575 | 0,2083 | |||
| GRBK / Green Brick Partners, Inc. | 0,03 | −25,16 | 2,00 | −26,75 | 0,6225 | 0,0135 | |||
| PAYO / Payoneer Global Inc. | 0,29 | −25,15 | 1,98 | −40,37 | 0,6162 | −0,1244 | |||
| FIZZ / National Beverage Corp. | 0,04 | −25,10 | 1,96 | −14,96 | 0,6103 | 0,0962 | |||
| BKE / The Buckle, Inc. | 0,05 | −25,21 | 1,94 | −20,42 | 0,6041 | 0,0601 | |||
| OFG / OFG Bancorp | 0,05 | −25,21 | 1,94 | −27,57 | 0,6038 | 0,0064 | |||
| PLUS / ePlus inc. | 0,03 | −25,06 | 1,89 | −16,92 | 0,5898 | 0,0811 | |||
| ROCK / Gibraltar Industries, Inc. | 0,03 | −25,35 | 1,86 | −33,46 | 0,5799 | −0,0444 | |||
| SLVM / Sylvamo Corporation | 0,03 | −25,11 | 1,80 | −44,23 | 0,5610 | −0,1595 | |||
| CSGS / CSG Systems International, Inc. | 0,03 | −25,18 | 1,77 | −23,14 | 0,5522 | 0,0375 | |||
| SHOO / Steven Madden, Ltd. | 0,07 | −25,16 | 1,76 | −43,74 | 0,5492 | −0,1503 | |||
| DFIN / Donnelley Financial Solutions, Inc. | 0,03 | −25,30 | 1,69 | −17,93 | 0,5269 | 0,0671 | |||
| CHCO / City Holding Company | 0,01 | −25,14 | 1,62 | −25,84 | 0,5068 | 0,0172 | |||
| HRMY / Harmony Biosciences Holdings, Inc. | 0,05 | −25,03 | 1,55 | −23,62 | 0,4843 | 0,0301 | |||
| CENTA / Central Garden & Pet Company | 0,05 | −25,10 | 1,54 | −23,95 | 0,4795 | 0,0278 | |||
| CENX / Century Aluminum Company | 0,10 | −25,15 | 1,54 | −38,83 | 0,4792 | −0,0820 | |||
| TNC / Tennant Company | 0,02 | −25,16 | 1,53 | −35,65 | 0,4769 | −0,0542 | |||
| LKFN / Lakeland Financial Corporation | 0,03 | −25,21 | 1,51 | −32,57 | 0,4713 | −0,0296 | |||
| ARCB / ArcBest Corporation | 0,02 | −25,41 | 1,49 | −40,64 | 0,4639 | −0,0960 | |||
| LNN / Lindsay Corporation | 0,01 | −25,10 | 1,48 | −20,98 | 0,4617 | 0,0431 | |||
| PRG / PROG Holdings, Inc. | 0,05 | −25,11 | 1,44 | −23,90 | 0,4490 | 0,0263 | |||
| ATEN / A10 Networks, Inc. | 0,08 | −25,15 | 1,42 | −37,88 | 0,4437 | −0,0679 | |||
| WABC / Westamerica Bancorporation | 0,03 | −25,09 | 1,36 | −30,95 | 0,4239 | −0,0159 | |||
| ANDE / The Andersons, Inc. | 0,04 | −25,17 | 1,35 | −37,90 | 0,4203 | −0,0646 | |||
| AMR / Alpha Metallurgical Resources, Inc. | 0,01 | −25,22 | 1,34 | −39,10 | 0,4165 | −0,0733 | |||
| NHC / National HealthCare Corporation | 0,01 | −25,19 | 1,31 | −16,34 | 0,4088 | 0,0585 | |||
| MBC / MasterBrand, Inc. | 0,12 | −25,15 | 1,25 | −45,43 | 0,3894 | −0,1218 | |||
| TILE / Interface, Inc. | 0,06 | −25,17 | 1,20 | −25,70 | 0,3735 | 0,0134 | |||
| PFBC / Preferred Bank | 0,01 | −25,22 | 1,18 | −29,55 | 0,3681 | −0,0063 | |||
| AMSF / AMERISAFE, Inc. | 0,02 | −25,12 | 1,18 | −30,95 | 0,3675 | −0,0137 | |||
| MCRI / Monarch Casino & Resort, Inc. | 0,01 | −25,08 | 1,16 | −31,48 | 0,3619 | −0,0166 | |||
| EIG / Employers Holdings, Inc. | 0,02 | −25,21 | 1,15 | −29,75 | 0,3589 | −0,0070 | |||
| GIII / G-III Apparel Group, Ltd. | 0,04 | −25,18 | 1,13 | −19,76 | 0,3523 | 0,0379 | |||
| APOG / Apogee Enterprises, Inc. | 0,03 | −25,17 | 1,10 | −39,68 | 0,3429 | −0,0644 | |||
| ASTH / Astrana Health, Inc. | 0,04 | −25,18 | 1,06 | −26,97 | 0,3305 | 0,0065 | |||
| VRTS / Virtus Investment Partners, Inc. | 0,01 | −25,25 | 1,04 | −32,09 | 0,3243 | −0,0176 | |||
| SCSC / ScanSource, Inc. | 0,03 | −25,20 | 1,02 | −17,54 | 0,3183 | 0,0418 | |||
| COLL / Collegium Pharmaceutical, Inc. | 0,03 | −25,16 | 1,01 | −24,93 | 0,3148 | 0,0144 | |||
| KLG / WK Kellogg Co | 0,06 | −25,15 | 0,98 | −36,10 | 0,3069 | −0,0373 | |||
| STAA / STAAR Surgical Company | 0,05 | −25,19 | 0,96 | −23,85 | 0,3008 | 0,0177 | |||
| PLAB / Photronics, Inc. | 0,05 | −25,17 | 0,88 | −40,03 | 0,2749 | −0,0534 | |||
| INVX / Innovex International, Inc. | 0,06 | −25,11 | 0,87 | −43,54 | 0,2727 | −0,0734 | |||
| LPG / Dorian LPG Ltd. | 0,04 | −25,16 | 0,87 | −21,36 | 0,2713 | 0,0243 | |||
| REX / REX American Resources Corporation | 0,02 | −25,21 | 0,83 | −18,46 | 0,2578 | 0,0315 | |||
| DFH / Dream Finders Homes, Inc. | 0,03 | −25,16 | 0,69 | −34,75 | 0,2157 | −0,0210 | |||
| SXC / SunCoke Energy, Inc. | 0,08 | −25,04 | 0,67 | −32,73 | 0,2085 | −0,0136 | |||
| SITC / SITE Centers Corp. | 0,05 | −19,87 | 0,65 | −31,84 | 0,2038 | −0,0104 | |||
| CAL / Caleres, Inc. | 0,05 | −25,02 | 0,63 | −37,66 | 0,1965 | −0,0291 | |||
| GDEN / Golden Entertainment, Inc. | 0,02 | −25,19 | 0,55 | −31,32 | 0,1704 | −0,0074 | |||
| LQDT / Liquidity Services, Inc. | 0,02 | −24,96 | 0,51 | −47,68 | 0,1587 | −0,0584 | |||
| US8252528851 / Invesco Government & Agency Portfolio, Institutional Class | 0,36 | −26,37 | 0,36 | −26,39 | 0,1116 | 0,0030 | |||
| NPK / National Presto Industries, Inc. | 0,00 | −25,13 | 0,35 | −37,12 | 0,1091 | −0,0149 | |||
| GES / Guess?, Inc. | 0,03 | −24,81 | 0,30 | −22,51 | 0,0925 | 0,0070 |