Grundläggande statistik
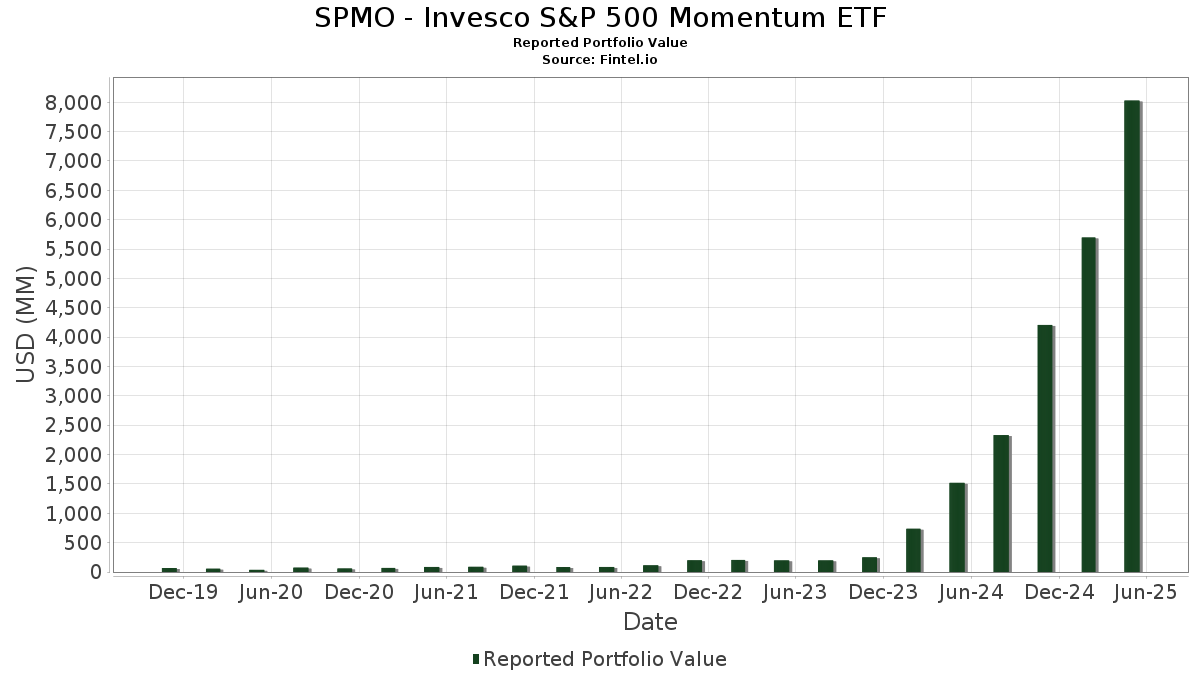
| Portföljvärde | $ 8 028 562 585 |
| Aktuella positioner | 101 |
Senaste innehav, resultat, förvaltat kapital (från 13F, 13D)
SPMO - Invesco S&P 500 Momentum ETF har redovisat 101 totala innehav i sina senaste SEC-arkiveringar. Det senaste portföljvärdet beräknas vara $ 8 028 562 585 USD. Faktiskt förvaltade tillgångar (AUM) är detta värde plus likvida medel (som inte redovisas). SPMO - Invesco S&P 500 Momentum ETFs största innehav är NVIDIA Corporation (US:NVDA) , Meta Platforms, Inc. (US:META) , Amazon.com, Inc. (US:AMZN) , Broadcom Inc. (US:AVGO) , and Tesla, Inc. (US:TSLA) . SPMO - Invesco S&P 500 Momentum ETFs nya positioner inkluderar Palantir Technologies Inc. (US:PLTR) , GE Vernova Inc. (US:GEV) , BlackRock, Inc. (US:BLK) , 3M Company (US:MMM) , and Altria Group, Inc. (US:MO) .
Största ökningarna detta kvartal
Vi använder förändringen i portföljallokeringen eftersom det är det mest meningsfulla måttet. Förändringar kan bero på transaktioner eller förändringar i aktiekurser.
| Värdepapper | Aktier (MM) |
Värde (MM$) |
Portfölj % av | ΔPortfölj % av |
|---|---|---|---|---|
| 1,19 | 412,59 | 5,1909 | 5,1909 | |
| 1,82 | 239,21 | 3,0096 | 3,0096 | |
| 0,24 | 289,64 | 3,6440 | 2,3645 | |
| 3,84 | 379,42 | 4,7736 | 2,1394 | |
| 1,02 | 663,07 | 8,3423 | 1,2680 | |
| 0,67 | 85,68 | 1,0780 | 1,0780 | |
| 77,71 | 77,71 | 0,9777 | 0,9777 | |
| 0,16 | 77,52 | 0,9753 | 0,9753 | |
| 0,07 | 72,22 | 0,9086 | 0,9086 | |
| 5,48 | 740,56 | 9,3172 | 0,8821 |
Största minskningarna detta kvartal
Vi använder förändringen i portföljallokeringen eftersom det är det mest meningsfulla måttet. Förändringar kan bero på transaktioner eller förändringar i aktiepriser.
| Värdepapper | Aktier (MM) |
Värde (MM$) |
Portfölj % av | ΔPortfölj % av |
|---|---|---|---|---|
| 0,16 | 29,74 | 0,3742 | −1,3466 | |
| 3,23 | 661,16 | 8,3183 | −1,2680 | |
| 2,73 | 120,47 | 1,5157 | −1,2433 | |
| 0,22 | 229,80 | 2,8912 | −1,2247 | |
| 1,78 | 430,04 | 5,4104 | −0,8025 | |
| 0,27 | 76,88 | 0,9673 | −0,7003 | |
| 1,59 | 118,65 | 1,4928 | −0,6512 | |
| 1,51 | 399,64 | 5,0280 | −0,4304 | |
| 0,41 | 35,10 | 0,4416 | −0,4173 | |
| 0,43 | 51,89 | 0,6528 | −0,3956 |
13F- och fond arkiveringar
Denna blankett lämnades in den 2025-07-28 för rapporteringsperioden 2025-05-31. Klicka på länksymbolen för att se hela transaktionshistoriken.
Uppgradera för att låsa upp premiumdata och exportera till Excel![]() .
.
| Värdepapper | Typ | Genomsnittligt aktiepris | Aktier (MM) |
ΔAktier (%) |
ΔAktier (%) |
Värde ($MM) |
Portfölj (%) |
ΔPortfölj (%) |
|
|---|---|---|---|---|---|---|---|---|---|
| NVDA / NVIDIA Corporation | 5,48 | 43,20 | 740,56 | 54,90 | 9,3172 | 0,8821 | |||
| META / Meta Platforms, Inc. | 1,02 | 70,66 | 663,07 | 65,37 | 8,3423 | 1,2680 | |||
| AMZN / Amazon.com, Inc. | 3,23 | 26,00 | 661,16 | 21,69 | 8,3183 | −1,2680 | |||
| AVGO / Broadcom Inc. | 1,78 | 0,61 | 430,04 | 22,12 | 5,4104 | −0,8025 | |||
| TSLA / Tesla, Inc. | 1,19 | 412,59 | 5,1909 | 5,1909 | |||||
| JPM / JPMorgan Chase & Co. | 1,51 | 29,50 | 399,64 | 29,18 | 5,0280 | −0,4304 | |||
| WMT / Walmart Inc. | 3,84 | 153,85 | 379,42 | 154,14 | 4,7736 | 2,1394 | |||
| NFLX / Netflix, Inc. | 0,24 | 459,38 | 289,64 | 862,89 | 3,6440 | 2,3645 | |||
| PLTR / Palantir Technologies Inc. | 1,82 | 239,21 | 3,0096 | 3,0096 | |||||
| COST / Costco Wholesale Corporation | 0,22 | −0,69 | 229,80 | −1,49 | 2,8912 | −1,2247 | |||
| GE / General Electric Company | 0,71 | 11,87 | 173,44 | 32,91 | 2,1821 | −0,1203 | |||
| PM / Philip Morris International Inc. | 0,86 | 4 651,55 | 154,60 | 8 888,37 | 1,9451 | 0,4356 | |||
| BSX / Boston Scientific Corporation | 1,15 | 92,12 | 120,93 | 94,85 | 1,5215 | 0,4264 | |||
| BAC / Bank of America Corporation | 2,73 | 2 817,88 | 120,47 | 3 731,87 | 1,5157 | −1,2433 | |||
| WFC / Wells Fargo & Company | 1,59 | 2 738,28 | 118,65 | 4 756,90 | 1,4928 | −0,6512 | |||
| GS / The Goldman Sachs Group, Inc. | 0,19 | 40,90 | 111,59 | 35,96 | 1,4040 | −0,0442 | |||
| RTX / RTX Corporation | 0,74 | 62,00 | 100,54 | 66,26 | 1,2649 | 0,1980 | |||
| IBM / International Business Machines Corporation | 0,39 | 16,64 | 100,08 | 19,70 | 1,2591 | −0,2160 | |||
| T / AT&T Inc. | 3,41 | 26,83 | 94,90 | 28,64 | 1,1939 | −0,1077 | |||
| AXP / American Express Company | 0,32 | 21,73 | 92,76 | 18,94 | 1,1670 | −0,2090 | |||
| ISRG / Intuitive Surgical, Inc. | 0,16 | 313,18 | 88,77 | 363,28 | 1,1168 | 0,3018 | |||
| MS / Morgan Stanley | 0,67 | 85,68 | 1,0780 | 1,0780 | |||||
| Invesco Private Prime Fund / STIV (N/A) | 77,71 | 77,71 | 0,9777 | 0,9777 | |||||
| GEV / GE Vernova Inc. | 0,16 | 77,52 | 0,9753 | 0,9753 | |||||
| PGR / The Progressive Corporation | 0,27 | −19,49 | 76,88 | −18,66 | 0,9673 | −0,7003 | |||
| BLK / BlackRock, Inc. | 0,07 | 72,22 | 0,9086 | 0,9086 | |||||
| WELL / Welltower Inc. | 0,43 | 93,02 | 66,15 | 93,99 | 0,8323 | 0,2306 | |||
| TJX / The TJX Companies, Inc. | 0,51 | 15,50 | 64,72 | 17,49 | 0,8142 | −0,1577 | |||
| TMUS / T-Mobile US, Inc. | 0,26 | 18,53 | 64,06 | 6,45 | 0,8059 | −0,2558 | |||
| C / Citigroup Inc. | 0,83 | 19,99 | 62,23 | 13,04 | 0,7829 | −0,1884 | |||
| FI / Fiserv, Inc. | 0,36 | 82,43 | 58,59 | 26,00 | 0,7372 | −0,0833 | |||
| MMM / 3M Company | 0,37 | 55,38 | 0,6967 | 0,6967 | |||||
| HWM / Howmet Aerospace Inc. | 0,32 | 50,01 | 53,80 | 86,57 | 0,6769 | 0,1681 | |||
| MO / Altria Group, Inc. | 0,87 | 52,97 | 0,6664 | 0,6664 | |||||
| KKR / KKR & Co. Inc. | 0,43 | −2,52 | 51,89 | −12,68 | 0,6528 | −0,3956 | |||
| CEG / Constellation Energy Corporation | 0,16 | 18,51 | 50,03 | 44,82 | 0,6295 | 0,0199 | |||
| WMB / The Williams Companies, Inc. | 0,81 | 90,29 | 49,17 | 97,91 | 0,6186 | 0,1803 | |||
| VST / Vistra Corp. | 0,30 | 35,17 | 48,38 | 62,39 | 0,6086 | 0,0830 | |||
| RCL / Royal Caribbean Cruises Ltd. | 0,17 | 162,89 | 43,82 | 174,51 | 0,5513 | 0,2696 | |||
| MSI / Motorola Solutions, Inc. | 0,10 | 40,48 | 42,89 | 32,56 | 0,5396 | −0,0313 | |||
| BK / The Bank of New York Mellon Corporation | 0,48 | 31,91 | 42,71 | 31,41 | 0,5373 | −0,0361 | |||
| AXON / Axon Enterprise, Inc. | 0,06 | 108,04 | 41,40 | 195,40 | 0,5209 | 0,2736 | |||
| TT / Trane Technologies plc | 0,10 | −13,86 | 41,38 | 4,79 | 0,5206 | −0,1761 | |||
| PH / Parker-Hannifin Corporation | 0,06 | 51,45 | 39,93 | 50,59 | 0,5023 | 0,0345 | |||
| ICE / Intercontinental Exchange, Inc. | 0,22 | −1,43 | 39,51 | 2,31 | 0,4971 | −0,1843 | |||
| KMI / Kinder Morgan, Inc. | 1,36 | 117,57 | 38,14 | 125,12 | 0,4798 | 0,1809 | |||
| AJG / Arthur J. Gallagher & Co. | 0,11 | 33,63 | 36,58 | 37,47 | 0,4603 | −0,0093 | |||
| ANET / Arista Networks Inc | 0,41 | −22,56 | 35,10 | −27,90 | 0,4416 | −0,4173 | |||
| JCI / Johnson Controls International plc | 0,32 | 707,08 | 32,05 | 1 280,87 | 0,4032 | 0,0803 | |||
| TRGP / Targa Resources Corp. | 0,19 | 53,01 | 30,60 | 19,80 | 0,3850 | −0,0657 | |||
| COF / Capital One Financial Corporation | 0,16 | 1 541,74 | 29,74 | 1 926,09 | 0,3742 | −1,3466 | |||
| APO / Apollo Global Management, Inc. | 0,23 | 29,72 | 0,3740 | 0,3740 | |||||
| Invesco Private Government Fund / STIV (N/A) | 28,94 | 28,94 | 0,3641 | 0,3641 | |||||
| HLT / Hilton Worldwide Holdings Inc. | 0,10 | 11,44 | 25,74 | 4,49 | 0,3239 | −0,1108 | |||
| OKE / ONEOK, Inc. | 0,31 | 66,45 | 25,01 | 34,03 | 0,3146 | −0,0146 | |||
| GDDY / GoDaddy Inc. | 0,13 | 37,92 | 22,91 | 39,95 | 0,2883 | −0,0006 | |||
| RSG / Republic Services, Inc. | 0,09 | 4,77 | 22,83 | 13,73 | 0,2872 | −0,0669 | |||
| ETR / Entergy Corporation | 0,27 | 22,42 | 0,2820 | 0,2820 | |||||
| AMP / Ameriprise Financial, Inc. | 0,04 | 676,92 | 22,11 | 871,53 | 0,2782 | −0,0384 | |||
| CMI / Cummins Inc. | 0,07 | 902,01 | 21,63 | 1 099,50 | 0,2721 | 0,0213 | |||
| PEG / Public Service Enterprise Group Incorporated | 0,27 | 62,35 | 21,55 | 62,12 | 0,2711 | 0,0366 | |||
| WAB / Westinghouse Air Brake Technologies Corporation | 0,11 | 73,55 | 21,38 | 89,43 | 0,2690 | 0,0699 | |||
| UAL / United Airlines Holdings, Inc. | 0,26 | 1 161,06 | 20,42 | 2 103,13 | 0,2570 | 0,1280 | |||
| CBRE / CBRE Group, Inc. | 0,16 | 3 408,11 | 20,00 | 5 455,28 | 0,2516 | −0,0643 | |||
| BKR / Baker Hughes Company | 0,54 | 791,18 | 20,00 | 1 015,96 | 0,2516 | 0,0024 | |||
| GLW / Corning Incorporated | 0,40 | 19,79 | 0,2490 | 0,2490 | |||||
| EBAY / eBay Inc. | 0,27 | 19,45 | 0,2447 | 0,2447 | |||||
| NDAQ / Nasdaq, Inc. | 0,22 | 56,09 | 18,68 | 57,53 | 0,2350 | 0,0258 | |||
| NRG / NRG Energy, Inc. | 0,11 | −15,39 | 17,24 | 24,79 | 0,2169 | −0,0269 | |||
| GRMN / Garmin Ltd. | 0,08 | 13,72 | 17,18 | 0,83 | 0,2161 | −0,0845 | |||
| FICO / Fair Isaac Corporation | 0,01 | −26,21 | 16,77 | −32,47 | 0,2110 | −0,2272 | |||
| TPL / Texas Pacific Land Corporation | 0,01 | 16,48 | 0,2074 | 0,2074 | |||||
| DAL / Delta Air Lines, Inc. | 0,34 | 683,77 | 16,24 | 797,46 | 0,2044 | −0,0474 | |||
| WTW / Willis Towers Watson Public Limited Company | 0,05 | 31,07 | 14,40 | 22,15 | 0,1811 | −0,0268 | |||
| RJF / Raymond James Financial, Inc. | 0,10 | 13,98 | 0,1758 | 0,1758 | |||||
| AEE / Ameren Corporation | 0,14 | 13,39 | 0,1685 | 0,1685 | |||||
| MTB / M&T Bank Corporation | 0,07 | 13,34 | 0,1678 | 0,1678 | |||||
| IRM / Iron Mountain Incorporated | 0,13 | −23,59 | 12,78 | −19,05 | 0,1608 | −0,1178 | |||
| BRO / Brown & Brown, Inc. | 0,11 | 10,97 | 12,67 | 5,69 | 0,1594 | −0,0521 | |||
| STT / State Street Corporation | 0,13 | 12,46 | 0,1568 | 0,1568 | |||||
| NI / NiSource Inc. | 0,31 | 12,24 | 0,1540 | 0,1540 | |||||
| SYF / Synchrony Financial | 0,20 | 50,40 | 11,76 | 42,88 | 0,1479 | 0,0027 | |||
| PPL / PPL Corporation | 0,34 | 11,75 | 0,1479 | 0,1479 | |||||
| LYV / Live Nation Entertainment, Inc. | 0,08 | 11,50 | 0,1447 | 0,1447 | |||||
| IP / International Paper Company | 0,24 | 5 113,69 | 11,47 | 5 635,50 | 0,1443 | −0,0905 | |||
| VLTO / Veralto Corporation | 0,11 | −1,28 | 10,80 | −0,03 | 0,1359 | −0,0547 | |||
| ATO / Atmos Energy Corporation | 0,07 | 10,47 | 0,1317 | 0,1317 | |||||
| DOV / Dover Corporation | 0,06 | 2 942,28 | 10,33 | 4 242,02 | 0,1300 | −0,0795 | |||
| TYL / Tyler Technologies, Inc. | 0,02 | 26,10 | 10,00 | 19,59 | 0,1258 | −0,0217 | |||
| TPR / Tapestry, Inc. | 0,13 | 9,85 | 0,1240 | 0,1240 | |||||
| US8252528851 / Invesco Government & Agency Portfolio, Institutional Class | 9,74 | 139,33 | 9,74 | 139,37 | 0,1225 | 0,0507 | |||
| NTRS / Northern Trust Corporation | 0,09 | 9,45 | 0,1189 | 0,1189 | |||||
| FFIV / F5, Inc. | 0,03 | 5 185,56 | 8,25 | 7 332,43 | 0,1038 | −0,0225 | |||
| FOX / Fox Corporation | 0,14 | 7,71 | 0,0970 | 0,0970 | |||||
| EVRG / Evergy, Inc. | 0,11 | 7,15 | 0,0900 | 0,0900 | |||||
| ZBRA / Zebra Technologies Corporation | 0,02 | 2 989,80 | 7,11 | 2 067,07 | 0,0894 | −0,2953 | |||
| PNR / Pentair plc | 0,07 | 350,66 | 6,75 | 404,26 | 0,0849 | 0,0279 | |||
| PKG / Packaging Corporation of America | 0,03 | −0,49 | 6,19 | −9,79 | 0,0779 | −0,0432 | |||
| RL / Ralph Lauren Corporation | 0,02 | 876,74 | 5,90 | 1 354,19 | 0,0743 | 0,0178 | |||
| FOXA / Fox Corporation | 0,09 | 4,57 | 0,0575 | 0,0575 | |||||
| DVA / DaVita Inc. | 0,02 | 2,97 | 0,0373 | 0,0373 | |||||
| NWSA / News Corporation | 0,00 | −100,00 | 0,00 | −100,00 | −0,0689 |