Grundläggande statistik
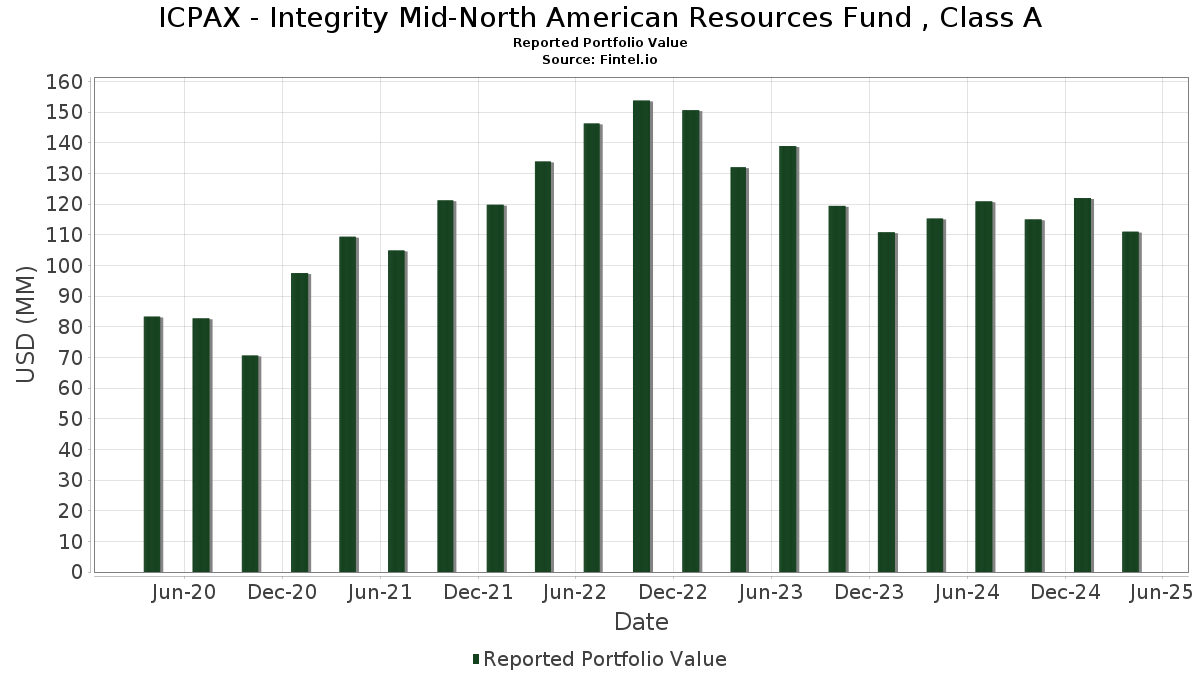
| Portföljvärde | $ 110 979 814 |
| Aktuella positioner | 45 |
Senaste innehav, resultat, förvaltat kapital (från 13F, 13D)
ICPAX - Integrity Mid-North American Resources Fund , Class A har redovisat 45 totala innehav i sina senaste SEC-arkiveringar. Det senaste portföljvärdet beräknas vara $ 110 979 814 USD. Faktiskt förvaltade tillgångar (AUM) är detta värde plus likvida medel (som inte redovisas). ICPAX - Integrity Mid-North American Resources Fund , Class As största innehav är Cheniere Energy, Inc. (US:LNG) , Exxon Mobil Corporation (US:XOM) , Antero Resources Corporation (US:AR) , Permian Resources Corporation (US:PR) , and Baker Hughes Company (US:BKR) . ICPAX - Integrity Mid-North American Resources Fund , Class As nya positioner inkluderar GE Vernova Inc. (US:GEV) , Modine Manufacturing Company (US:MOD) , Expand Energy Corporation (US:EXE) , Primoris Services Corporation (US:PRIM) , and .
Största ökningarna detta kvartal
Vi använder förändringen i portföljallokeringen eftersom det är det mest meningsfulla måttet. Förändringar kan bero på transaktioner eller förändringar i aktiekurser.
| Värdepapper | Aktier (MM) |
Värde (MM$) |
Portfölj % av | ΔPortfölj % av |
|---|---|---|---|---|
| 0,09 | 2,12 | 1,8300 | 1,8300 | |
| 0,03 | 2,01 | 1,7400 | 1,7400 | |
| 0,01 | 2,00 | 1,7300 | 1,7300 | |
| 0,04 | 3,42 | 2,9600 | 1,4000 | |
| 0,04 | 1,13 | 0,9800 | 0,9800 | |
| 0,01 | 1,06 | 0,9200 | 0,9200 | |
| 0,01 | 1,04 | 0,9000 | 0,9000 | |
| 0,03 | 3,89 | 3,3700 | 0,8700 | |
| 0,02 | 0,96 | 0,8300 | 0,8300 | |
| 0,02 | 4,14 | 3,5800 | 0,7800 |
Största minskningarna detta kvartal
Vi använder förändringen i portföljallokeringen eftersom det är det mest meningsfulla måttet. Förändringar kan bero på transaktioner eller förändringar i aktiepriser.
| Värdepapper | Aktier (MM) |
Värde (MM$) |
Portfölj % av | ΔPortfölj % av |
|---|---|---|---|---|
| 0,04 | 1,98 | 1,7100 | −2,7000 | |
| 0,03 | 0,83 | 0,7200 | −1,0500 | |
| 0,02 | 2,11 | 1,8300 | −0,7500 | |
| 0,13 | 4,67 | 4,0500 | −0,7300 | |
| 0,10 | 0,56 | 0,4900 | −0,6500 | |
| 0,03 | 0,25 | 0,2100 | −0,5800 | |
| 0,41 | 4,84 | 4,1900 | −0,5200 | |
| 0,15 | 3,68 | 3,1900 | −0,5100 | |
| 0,05 | 5,28 | 4,5700 | −0,4600 | |
| 0,07 | 2,52 | 2,1800 | −0,3900 |
13F- och fond arkiveringar
Denna blankett lämnades in den 2025-06-25 för rapporteringsperioden 2025-04-30. Klicka på länksymbolen för att se hela transaktionshistoriken.
Uppgradera för att låsa upp premiumdata och exportera till Excel![]() .
.
| Värdepapper | Typ | Genomsnittligt aktiepris | Aktier (MM) |
ΔAktier (%) |
ΔAktier (%) |
Värde ($MM) |
Portfölj (%) |
ΔPortfölj (%) |
|
|---|---|---|---|---|---|---|---|---|---|
| LNG / Cheniere Energy, Inc. | 0,04 | −10,26 | 8,09 | −7,27 | 7,0000 | 0,1600 | |||
| XOM / Exxon Mobil Corporation | 0,05 | −16,67 | 5,28 | −17,60 | 4,5700 | −0,4600 | |||
| AR / Antero Resources Corporation | 0,14 | 0,00 | 4,88 | −6,66 | 4,2200 | 0,1200 | |||
| PR / Permian Resources Corporation | 0,41 | 0,00 | 4,84 | −19,45 | 4,1900 | −0,5200 | |||
| BKR / Baker Hughes Company | 0,13 | 0,00 | 4,67 | −23,35 | 4,0500 | −0,7300 | |||
| TRGP / Targa Resources Corp. | 0,03 | 3,85 | 4,61 | −9,81 | 4,0000 | −0,0100 | |||
| TRP / TC Energy Corporation | 0,09 | 0,00 | 4,54 | 11,89 | 3,9300 | 0,7500 | |||
| PSX / Phillips 66 | 0,04 | 0,00 | 4,37 | −11,72 | 3,7800 | −0,1000 | |||
| GPOR / Gulfport Energy Corporation | 0,02 | 20,00 | 4,14 | 15,97 | 3,5800 | 0,7800 | |||
| VST / Vistra Corp. | 0,03 | 57,89 | 3,89 | 21,80 | 3,3700 | 0,8700 | |||
| VLO / Valero Energy Corporation | 0,03 | 0,00 | 3,71 | −12,73 | 3,2200 | −0,1200 | |||
| COG / Cabot Oil & Gas Corp. | 0,15 | −11,76 | 3,68 | −21,82 | 3,1900 | −0,5100 | |||
| NRG / NRG Energy, Inc. | 0,03 | 10,00 | 3,62 | 17,67 | 3,1300 | 0,7200 | |||
| ETR / Entergy Corporation | 0,04 | −19,23 | 3,49 | −17,15 | 3,0200 | −0,2900 | |||
| VRT / Vertiv Holdings Co | 0,04 | 135,29 | 3,42 | 71,69 | 2,9600 | 1,4000 | |||
| FSLR / First Solar, Inc. | 0,02 | 41,18 | 3,02 | 6,04 | 2,6100 | 0,3800 | |||
| PBA / Pembina Pipeline Corporation | 0,07 | −22,22 | 2,67 | −17,70 | 2,3200 | −0,2300 | |||
| SLB / Schlumberger Limited | 0,08 | 0,00 | 2,66 | −17,44 | 2,3000 | −0,2300 | |||
| KGS / Kodiak Gas Services, Inc. | 0,07 | 5,71 | 2,52 | −23,15 | 2,1800 | −0,3900 | |||
| EE / Excelerate Energy, Inc. | 0,09 | −10,00 | 2,30 | −22,93 | 1,9900 | −0,3500 | |||
| COP / ConocoPhillips | 0,02 | 20,00 | 2,14 | 8,20 | 1,8500 | 0,3000 | |||
| XEL / Xcel Energy Inc. | 0,03 | 0,00 | 2,12 | 5,21 | 1,8400 | 0,2600 | |||
| AROC / Archrock, Inc. | 0,09 | 2,12 | 1,8300 | 1,8300 | |||||
| FANG / Diamondback Energy, Inc. | 0,02 | −20,00 | 2,11 | −35,75 | 1,8300 | −0,7500 | |||
| NEE / NextEra Energy, Inc. | 0,03 | 2,01 | 1,7400 | 1,7400 | |||||
| GEV / GE Vernova Inc. | 0,01 | 2,00 | 1,7300 | 1,7300 | |||||
| EQT / EQT Corporation | 0,04 | −63,64 | 1,98 | −64,84 | 1,7100 | −2,7000 | |||
| GTLS / Chart Industries, Inc. | 0,01 | 10,00 | 1,48 | −29,83 | 1,2900 | −0,3700 | |||
| US4039491000 / HF Sinclair Corp. | 0,04 | 0,00 | 1,20 | −16,70 | 1,0400 | −0,0900 | |||
| TSLA / Tesla, Inc. | 0,00 | 33,33 | 1,13 | −7,01 | 0,9800 | 0,0300 | |||
| FTI / TechnipFMC plc | 0,04 | 1,13 | 0,9800 | 0,9800 | |||||
| NXT / Nextracker Inc. | 0,03 | −15,62 | 1,10 | −32,05 | 0,9500 | −0,3200 | |||
| PARR / Par Pacific Holdings, Inc. | 0,07 | 0,00 | 1,07 | −14,35 | 0,9300 | −0,0500 | |||
| MOD / Modine Manufacturing Company | 0,01 | 1,06 | 0,9200 | 0,9200 | |||||
| EXE / Expand Energy Corporation | 0,01 | 1,04 | 0,9000 | 0,9000 | |||||
| TPL / Texas Pacific Land Corporation | 0,00 | −20,00 | 1,03 | −20,51 | 0,8900 | −0,1300 | |||
| PRIM / Primoris Services Corporation | 0,02 | 0,96 | 0,8300 | 0,8300 | |||||
| PWR / Quanta Services, Inc. | 0,00 | 0,88 | 0,7600 | 0,7600 | |||||
| TS / Tenaris S.A. - Depositary Receipt (Common Stock) | 0,03 | −58,33 | 0,83 | −63,19 | 0,7200 | −1,0500 | |||
| SHLS / Shoals Technologies Group, Inc. | 0,21 | 0,00 | 0,78 | −24,44 | 0,6700 | −0,1400 | |||
| HAL / Halliburton Company | 0,03 | 0,00 | 0,59 | −23,85 | 0,5100 | −0,1000 | |||
| GNRC / Generac Holdings Inc. | 0,01 | 0,00 | 0,57 | −23,46 | 0,5000 | −0,0900 | |||
| PTEN / Patterson-UTI Energy, Inc. | 0,10 | −44,44 | 0,56 | −61,16 | 0,4900 | −0,6500 | |||
| ARRY / Array Technologies, Inc. | 0,09 | 0,00 | 0,43 | −34,75 | 0,3700 | −0,1500 | |||
| XPRO / Expro Group Holdings N.V. | 0,03 | −62,50 | 0,25 | −75,45 | 0,2100 | −0,5800 |