Grundläggande statistik
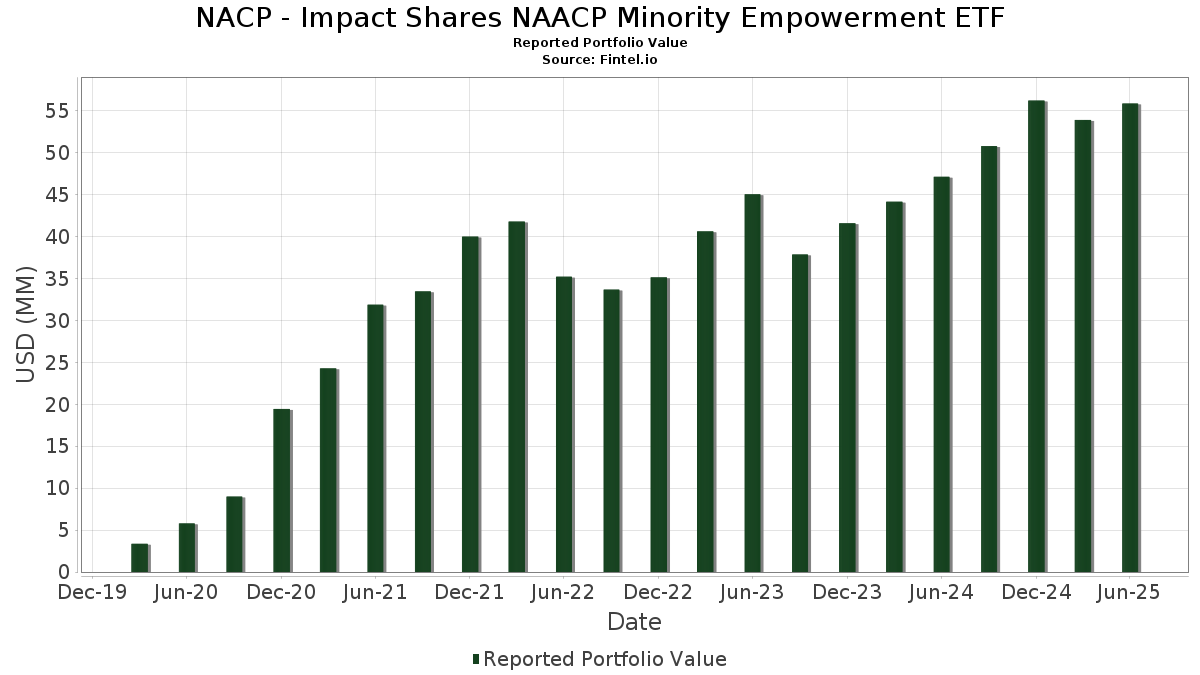
| Portföljvärde | $ 55 853 090 |
| Aktuella positioner | 202 |
Senaste innehav, resultat, förvaltat kapital (från 13F, 13D)
NACP - Impact Shares NAACP Minority Empowerment ETF har redovisat 202 totala innehav i sina senaste SEC-arkiveringar. Det senaste portföljvärdet beräknas vara $ 55 853 090 USD. Faktiskt förvaltade tillgångar (AUM) är detta värde plus likvida medel (som inte redovisas). NACP - Impact Shares NAACP Minority Empowerment ETFs största innehav är NVIDIA Corporation (US:NVDA) , Microsoft Corporation (US:MSFT) , Amazon.com, Inc. (US:AMZN) , Apple Inc. (US:AAPL) , and International Business Machines Corporation (US:IBM) . NACP - Impact Shares NAACP Minority Empowerment ETFs nya positioner inkluderar Amentum Holdings, Inc. (US:AMTM) , .
Största ökningarna detta kvartal
Vi använder förändringen i portföljallokeringen eftersom det är det mest meningsfulla måttet. Förändringar kan bero på transaktioner eller förändringar i aktiekurser.
| Värdepapper | Aktier (MM) |
Värde (MM$) |
Portfölj % av | ΔPortfölj % av |
|---|---|---|---|---|
| 0,02 | 2,96 | 5,3071 | 0,8254 | |
| 0,01 | 2,49 | 4,4736 | 0,5458 | |
| 0,02 | 1,82 | 3,2650 | 0,5038 | |
| 0,01 | 2,85 | 5,1099 | 0,4210 | |
| 0,01 | 1,12 | 2,0038 | 0,4120 | |
| 0,01 | 2,11 | 3,7958 | 0,4020 | |
| 0,00 | 2,31 | 4,1435 | 0,3387 | |
| 0,01 | 1,27 | 2,2844 | 0,2838 | |
| 0,01 | 1,44 | 2,5796 | 0,1392 | |
| 0,01 | 2,73 | 4,8974 | 0,1335 |
Största minskningarna detta kvartal
Vi använder förändringen i portföljallokeringen eftersom det är det mest meningsfulla måttet. Förändringar kan bero på transaktioner eller förändringar i aktiepriser.
| Värdepapper | Aktier (MM) |
Värde (MM$) |
Portfölj % av | ΔPortfölj % av |
|---|---|---|---|---|
| 0,00 | 0,49 | 0,8813 | −0,6181 | |
| 0,01 | 1,79 | 3,2185 | −0,3169 | |
| 0,04 | 0,90 | 1,6121 | −0,2866 | |
| 0,01 | 2,69 | 4,8289 | −0,2695 | |
| 0,01 | 0,79 | 1,4207 | −0,2383 | |
| 0,00 | 0,39 | 0,7005 | −0,1972 | |
| 0,00 | 1,06 | 1,9014 | −0,1748 | |
| 0,00 | 0,26 | 0,4614 | −0,1588 | |
| 0,00 | 0,56 | 1,0057 | −0,1444 | |
| 0,00 | 0,64 | 1,1470 | −0,1292 |
13F- och fond arkiveringar
Denna blankett lämnades in den 2025-08-28 för rapporteringsperioden 2025-06-30. Klicka på länksymbolen för att se hela transaktionshistoriken.
Uppgradera för att låsa upp premiumdata och exportera till Excel![]() .
.
| Värdepapper | Typ | Genomsnittligt aktiepris | Aktier (MM) |
ΔAktier (%) |
ΔAktier (%) |
Värde ($MM) |
Portfölj (%) |
ΔPortfölj (%) |
|
|---|---|---|---|---|---|---|---|---|---|
| NVDA / NVIDIA Corporation | 0,02 | −15,81 | 2,96 | 22,75 | 5,3071 | 0,8254 | |||
| MSFT / Microsoft Corporation | 0,01 | −14,76 | 2,85 | 12,98 | 5,1099 | 0,4210 | |||
| AMZN / Amazon.com, Inc. | 0,01 | −7,60 | 2,73 | 6,52 | 4,8974 | 0,1335 | |||
| AAPL / Apple Inc. | 0,01 | 6,28 | 2,69 | −1,82 | 4,8289 | −0,2695 | |||
| IBM / International Business Machines Corporation | 0,01 | −0,42 | 2,49 | 18,05 | 4,4736 | 0,5458 | |||
| META / Meta Platforms, Inc. | 0,00 | −11,86 | 2,31 | 12,86 | 4,1435 | 0,3387 | |||
| TSLA / Tesla, Inc. | 0,01 | −5,43 | 2,11 | 15,90 | 3,7958 | 0,4020 | |||
| UBER / Uber Technologies, Inc. | 0,02 | −4,29 | 1,82 | 22,57 | 3,2650 | 0,5038 | |||
| ACN / Accenture plc | 0,01 | −1,49 | 1,79 | −5,63 | 3,2185 | −0,3169 | |||
| QCOM / QUALCOMM Incorporated | 0,01 | −3,93 | 1,58 | −0,38 | 2,8368 | −0,1151 | |||
| GOOGL / Alphabet Inc. | 0,01 | −3,87 | 1,44 | 9,61 | 2,5796 | 0,1392 | |||
| JPM / JPMorgan Chase & Co. | 0,00 | −12,87 | 1,39 | 2,97 | 2,4938 | −0,0162 | |||
| PANW / Palo Alto Networks, Inc. | 0,01 | −1,32 | 1,27 | 18,33 | 2,2844 | 0,2838 | |||
| GOOG / Alphabet Inc. | 0,01 | −4,33 | 1,26 | 8,59 | 2,2696 | 0,1040 | |||
| MU / Micron Technology, Inc. | 0,01 | −8,02 | 1,12 | 30,53 | 2,0038 | 0,4120 | |||
| V / Visa Inc. | 0,00 | −6,31 | 1,06 | −5,11 | 1,9014 | −0,1748 | |||
| INTC / Intel Corporation | 0,04 | −10,78 | 0,90 | −11,96 | 1,6121 | −0,2866 | |||
| T / AT&T Inc. | 0,03 | −1,03 | 0,81 | 1,37 | 1,4592 | −0,0341 | |||
| MA / Mastercard Incorporated | 0,00 | −5,37 | 0,80 | −3,03 | 1,4392 | −0,0983 | |||
| XOM / Exxon Mobil Corporation | 0,01 | −2,08 | 0,79 | −11,22 | 1,4207 | −0,2383 | |||
| WMT / Walmart Inc. | 0,01 | −10,28 | 0,75 | −0,13 | 1,3379 | −0,0498 | |||
| VZ / Verizon Communications Inc. | 0,02 | 4,91 | 0,72 | 0,00 | 1,2901 | −0,0460 | |||
| JNJ / Johnson & Johnson | 0,00 | 1,14 | 0,64 | −6,85 | 1,1470 | −0,1292 | |||
| ABBV / AbbVie Inc. | 0,00 | 2,30 | 0,56 | −9,39 | 1,0057 | −0,1444 | |||
| BAC / Bank of America Corporation | 0,01 | −12,72 | 0,55 | −1,08 | 0,9923 | −0,0469 | |||
| UNH / UnitedHealth Group Incorporated | 0,00 | 2,27 | 0,49 | −39,08 | 0,8813 | −0,6181 | |||
| KO / The Coca-Cola Company | 0,01 | 1,14 | 0,48 | −0,21 | 0,8664 | −0,0324 | |||
| GE / General Electric Company | 0,00 | −5,43 | 0,47 | 21,76 | 0,8444 | 0,1248 | |||
| ABT / Abbott Laboratories | 0,00 | −3,08 | 0,41 | −0,73 | 0,7369 | −0,0317 | |||
| CVX / Chevron Corporation | 0,00 | −5,51 | 0,39 | −19,09 | 0,7005 | −0,1972 | |||
| MRK / Merck & Co., Inc. | 0,00 | 0,47 | 0,34 | −11,55 | 0,6061 | −0,1029 | |||
| PEP / PepsiCo, Inc. | 0,00 | −0,17 | 0,32 | −12,12 | 0,5728 | −0,1025 | |||
| AXP / American Express Company | 0,00 | −13,60 | 0,30 | 2,41 | 0,5347 | −0,0063 | |||
| MS / Morgan Stanley | 0,00 | −15,03 | 0,30 | 2,43 | 0,5304 | −0,0054 | |||
| BSX / Boston Scientific Corporation | 0,00 | 2,28 | 0,29 | 9,06 | 0,5191 | 0,0251 | |||
| SPGI / S&P Global Inc. | 0,00 | −8,42 | 0,28 | −4,75 | 0,5044 | −0,0457 | |||
| SCHW / The Charles Schwab Corporation | 0,00 | 3,46 | 0,27 | 20,54 | 0,4852 | 0,0682 | |||
| C / Citigroup Inc. | 0,00 | −16,28 | 0,27 | 0,37 | 0,4817 | −0,0156 | |||
| LOW / Lowe's Companies, Inc. | 0,00 | −8,06 | 0,27 | −12,54 | 0,4770 | −0,0883 | |||
| HON / Honeywell International Inc. | 0,00 | −2,28 | 0,26 | 7,47 | 0,4664 | 0,0166 | |||
| BA / The Boeing Company | 0,00 | −11,39 | 0,26 | 8,82 | 0,4652 | 0,0223 | |||
| TMO / Thermo Fisher Scientific Inc. | 0,00 | −5,37 | 0,26 | −22,82 | 0,4614 | −0,1588 | |||
| FGXXX / First American Funds Inc - First American Government Obligations Fund Class X | 0,25 | 21,36 | 0,25 | 21,63 | 0,4549 | 0,0664 | |||
| SYK / Stryker Corporation | 0,00 | −5,52 | 0,24 | 0,41 | 0,4374 | −0,0141 | |||
| NEE / NextEra Energy, Inc. | 0,00 | 4,38 | 0,24 | 2,11 | 0,4361 | −0,0061 | |||
| ETN / Eaton Corporation plc | 0,00 | 0,00 | 0,24 | 31,15 | 0,4325 | 0,0912 | |||
| PFE / Pfizer Inc. | 0,01 | −2,54 | 0,23 | −6,80 | 0,4199 | −0,0469 | |||
| GILD / Gilead Sciences, Inc. | 0,00 | −0,71 | 0,23 | −2,10 | 0,4198 | −0,0231 | |||
| UNP / Union Pacific Corporation | 0,00 | −5,33 | 0,23 | −7,54 | 0,4183 | −0,0519 | |||
| DE / Deere & Company | 0,00 | −2,77 | 0,21 | 5,42 | 0,3842 | 0,0062 | |||
| DHR / Danaher Corporation | 0,00 | −5,31 | 0,21 | −8,66 | 0,3790 | −0,0515 | |||
| COP / ConocoPhillips | 0,00 | −5,47 | 0,19 | −19,57 | 0,3337 | −0,0945 | |||
| MDT / Medtronic plc | 0,00 | −3,56 | 0,18 | −6,60 | 0,3309 | −0,0357 | |||
| SO / The Southern Company | 0,00 | 2,66 | 0,18 | 2,91 | 0,3178 | −0,0035 | |||
| NKE / NIKE, Inc. | 0,00 | −10,05 | 0,17 | 0,59 | 0,3080 | −0,0091 | |||
| TT / Trane Technologies plc | 0,00 | −2,26 | 0,17 | 26,87 | 0,3062 | 0,0561 | |||
| PLD / Prologis, Inc. | 0,00 | −5,53 | 0,17 | −11,17 | 0,2998 | −0,0500 | |||
| BMY / Bristol-Myers Squibb Company | 0,00 | 1,04 | 0,16 | −23,33 | 0,2895 | −0,1018 | |||
| DUK / Duke Energy Corporation | 0,00 | 3,48 | 0,16 | 0,00 | 0,2893 | −0,0102 | |||
| PGR / The Progressive Corporation | 0,00 | 5,75 | 0,16 | 0,00 | 0,2821 | −0,0111 | |||
| RCL / Royal Caribbean Cruises Ltd. | 0,00 | −20,32 | 0,16 | 21,09 | 0,2799 | 0,0410 | |||
| CI / The Cigna Group | 0,00 | 1,30 | 0,15 | 1,99 | 0,2771 | −0,0051 | |||
| MDLZ / Mondelez International, Inc. | 0,00 | 1,11 | 0,15 | 0,66 | 0,2758 | −0,0086 | |||
| CVS / CVS Health Corporation | 0,00 | 1,16 | 0,15 | 2,74 | 0,2706 | −0,0017 | |||
| ELV / Elevance Health, Inc. | 0,00 | 1,31 | 0,15 | −9,09 | 0,2695 | −0,0388 | |||
| MMM / 3M Company | 0,00 | 0,63 | 0,15 | 4,29 | 0,2628 | 0,0017 | |||
| AON / Aon plc | 0,00 | 4,49 | 0,14 | −6,62 | 0,2536 | −0,0278 | |||
| WMB / The Williams Companies, Inc. | 0,00 | 0,33 | 0,13 | 5,51 | 0,2413 | 0,0041 | |||
| MCO / Moody's Corporation | 0,00 | −5,34 | 0,13 | 2,31 | 0,2395 | −0,0040 | |||
| MAR / Marriott International, Inc. | 0,00 | −14,18 | 0,13 | −1,52 | 0,2344 | −0,0124 | |||
| EQIX / Equinix, Inc. | 0,00 | −5,20 | 0,13 | −7,80 | 0,2341 | −0,0282 | |||
| HLT / Hilton Worldwide Holdings Inc. | 0,00 | −17,57 | 0,13 | −3,73 | 0,2333 | −0,0173 | |||
| WELL / Welltower Inc. | 0,00 | 2,94 | 0,13 | 3,20 | 0,2318 | −0,0008 | |||
| PNC / The PNC Financial Services Group, Inc. | 0,00 | −10,43 | 0,12 | −5,34 | 0,2242 | −0,0204 | |||
| EMR / Emerson Electric Co. | 0,00 | −12,34 | 0,12 | 6,90 | 0,2228 | 0,0062 | |||
| NOC / Northrop Grumman Corporation | 0,00 | 3,77 | 0,12 | 0,82 | 0,2225 | −0,0051 | |||
| HWM / Howmet Aerospace Inc. | 0,00 | −8,95 | 0,12 | 30,85 | 0,2208 | 0,0456 | |||
| ITW / Illinois Tool Works Inc. | 0,00 | −5,15 | 0,12 | −5,43 | 0,2205 | −0,0212 | |||
| UPS / United Parcel Service, Inc. | 0,00 | −5,39 | 0,12 | −12,86 | 0,2196 | −0,0425 | |||
| PYPL / PayPal Holdings, Inc. | 0,00 | −8,22 | 0,12 | 4,35 | 0,2158 | 0,0018 | |||
| TYIA / Johnson Controls International plc | 0,00 | −8,35 | 0,12 | 21,65 | 0,2123 | 0,0302 | |||
| ZTS / Zoetis Inc. | 0,00 | −5,30 | 0,12 | −10,00 | 0,2102 | −0,0327 | |||
| ECL / Ecolab Inc. | 0,00 | −5,29 | 0,12 | 0,00 | 0,2079 | −0,0062 | |||
| TRV / The Travelers Companies, Inc. | 0,00 | 2,51 | 0,11 | 3,81 | 0,1959 | 0,0001 | |||
| VST / Vistra Corp. | 0,00 | −11,76 | 0,11 | 46,58 | 0,1930 | 0,0556 | |||
| BK / The Bank of New York Mellon Corporation | 0,00 | −11,50 | 0,11 | −3,60 | 0,1926 | −0,0150 | |||
| CSX / CSX Corporation | 0,00 | −9,43 | 0,10 | 0,00 | 0,1884 | −0,0061 | |||
| NEM / Newmont Corporation | 0,00 | −5,53 | 0,10 | 14,29 | 0,1876 | 0,0170 | |||
| CRH / CRH plc | 0,00 | −5,49 | 0,10 | −0,95 | 0,1873 | −0,0095 | |||
| CARR / Carrier Global Corporation | 0,00 | 2,56 | 0,10 | 18,60 | 0,1840 | 0,0229 | |||
| GM / General Motors Company | 0,00 | −5,51 | 0,10 | −0,98 | 0,1818 | −0,0088 | |||
| NSC / Norfolk Southern Corporation | 0,00 | −5,13 | 0,10 | 3,13 | 0,1782 | −0,0019 | |||
| FCX / Freeport-McMoRan Inc. | 0,00 | −9,85 | 0,10 | 3,26 | 0,1716 | −0,0007 | |||
| TFC / Truist Financial Corporation | 0,00 | −11,22 | 0,09 | −7,84 | 0,1704 | −0,0200 | |||
| AEP / American Electric Power Company, Inc. | 0,00 | −1,93 | 0,09 | −6,93 | 0,1702 | −0,0192 | |||
| KMI / Kinder Morgan, Inc. | 0,00 | −5,54 | 0,09 | −3,09 | 0,1702 | −0,0110 | |||
| LNG / Cheniere Energy, Inc. | 0,00 | −5,21 | 0,09 | 0,00 | 0,1670 | −0,0065 | |||
| MPC / Marathon Petroleum Corporation | 0,00 | −5,10 | 0,09 | 8,24 | 0,1664 | 0,0070 | |||
| SRE / Sempra | 0,00 | 7,29 | 0,09 | 13,92 | 0,1621 | 0,0146 | |||
| FDX / FedEx Corporation | 0,00 | −5,17 | 0,09 | −11,22 | 0,1571 | −0,0270 | |||
| OKE / ONEOK, Inc. | 0,00 | −5,32 | 0,09 | −21,62 | 0,1565 | −0,0517 | |||
| F / Ford Motor Company | 0,01 | −5,53 | 0,09 | 2,41 | 0,1537 | −0,0022 | |||
| D / Dominion Energy, Inc. | 0,00 | 0,53 | 0,09 | 1,19 | 0,1530 | −0,0035 | |||
| URI / United Rentals, Inc. | 0,00 | −5,13 | 0,08 | 13,70 | 0,1501 | 0,0137 | |||
| PSX / Phillips 66 | 0,00 | −5,32 | 0,08 | −8,89 | 0,1486 | −0,0198 | |||
| LHX / L3Harris Technologies, Inc. | 0,00 | 1,89 | 0,08 | 22,73 | 0,1454 | 0,0220 | |||
| BDX / Becton, Dickinson and Company | 0,00 | −5,44 | 0,08 | −29,20 | 0,1450 | −0,0663 | |||
| CMI / Cummins Inc. | 0,00 | −4,67 | 0,08 | 0,00 | 0,1440 | −0,0058 | |||
| MET / MetLife, Inc. | 0,00 | −9,02 | 0,08 | −9,30 | 0,1412 | −0,0194 | |||
| KR / The Kroger Co. | 0,00 | −5,50 | 0,08 | 0,00 | 0,1394 | −0,0049 | |||
| EW / Edwards Lifesciences Corporation | 0,00 | −5,48 | 0,08 | 1,33 | 0,1380 | −0,0022 | |||
| VRSK / Verisk Analytics, Inc. | 0,00 | −4,80 | 0,07 | 0,00 | 0,1331 | −0,0053 | |||
| PEG / Public Service Enterprise Group Incorporated | 0,00 | 1,97 | 0,07 | 4,23 | 0,1329 | 0,0008 | |||
| VLO / Valero Energy Corporation | 0,00 | −1,44 | 0,07 | 0,00 | 0,1324 | −0,0044 | |||
| AME / AMETEK, Inc. | 0,00 | −4,98 | 0,07 | 0,00 | 0,1302 | −0,0049 | |||
| EXC / Exelon Corporation | 0,00 | −5,47 | 0,07 | −10,00 | 0,1294 | −0,0212 | |||
| XEL / Xcel Energy Inc. | 0,00 | 0,10 | 0,07 | −4,17 | 0,1250 | −0,0095 | |||
| OTIS / Otis Worldwide Corporation | 0,00 | −0,15 | 0,07 | −4,29 | 0,1219 | −0,0100 | |||
| EBAY / eBay Inc. | 0,00 | −9,63 | 0,07 | −1,47 | 0,1216 | −0,0053 | |||
| RMD / ResMed Inc. | 0,00 | −4,53 | 0,07 | 10,17 | 0,1171 | 0,0068 | |||
| ETR / Entergy Corporation | 0,00 | 2,77 | 0,06 | 0,00 | 0,1161 | −0,0043 | |||
| ROK / Rockwell Automation, Inc. | 0,00 | −4,46 | 0,06 | 23,08 | 0,1151 | 0,0180 | |||
| BKR / Baker Hughes Company | 0,00 | −5,44 | 0,06 | −16,88 | 0,1149 | −0,0295 | |||
| HES / Hess Corporation | 0,00 | −5,52 | 0,06 | −17,95 | 0,1149 | −0,0304 | |||
| ED / Consolidated Edison, Inc. | 0,00 | 9,12 | 0,06 | −1,56 | 0,1142 | −0,0053 | |||
| PCG / PG&E Corporation | 0,00 | 17,49 | 0,06 | −4,69 | 0,1102 | −0,0096 | |||
| VMC / Vulcan Materials Company | 0,00 | −4,94 | 0,06 | 7,14 | 0,1081 | 0,0027 | |||
| NDAQ / Nasdaq, Inc. | 0,00 | −5,52 | 0,06 | 11,32 | 0,1070 | 0,0074 | |||
| A / Agilent Technologies, Inc. | 0,00 | −5,22 | 0,06 | −5,00 | 0,1038 | −0,0087 | |||
| MTB / M&T Bank Corporation | 0,00 | −4,79 | 0,06 | 3,64 | 0,1038 | −0,0003 | |||
| NRG / NRG Energy, Inc. | 0,00 | −5,53 | 0,06 | 58,33 | 0,1035 | 0,0360 | |||
| WEC / WEC Energy Group, Inc. | 0,00 | 0,37 | 0,06 | −3,39 | 0,1025 | −0,0082 | |||
| MLM / Martin Marietta Materials, Inc. | 0,00 | −5,50 | 0,06 | 7,69 | 0,1015 | 0,0045 | |||
| IR / Ingersoll Rand Inc. | 0,00 | −5,47 | 0,06 | −1,75 | 0,1006 | −0,0055 | |||
| XYL / Xylem Inc. | 0,00 | −5,50 | 0,05 | 1,92 | 0,0957 | −0,0012 | |||
| LPLA / LPL Financial Holdings Inc. | 0,00 | 8,46 | 0,05 | 23,81 | 0,0949 | 0,0158 | |||
| DAL / Delta Air Lines, Inc. | 0,00 | −26,17 | 0,05 | −17,46 | 0,0944 | −0,0231 | |||
| AVB / AvalonBay Communities, Inc. | 0,00 | −4,60 | 0,05 | −10,71 | 0,0909 | −0,0133 | |||
| DD / DuPont de Nemours, Inc. | 0,00 | −5,46 | 0,05 | −14,04 | 0,0895 | −0,0173 | |||
| EA / Electronic Arts Inc. | 0,00 | −4,73 | 0,05 | 6,67 | 0,0866 | 0,0013 | |||
| FITB / Fifth Third Bancorp | 0,00 | −14,52 | 0,05 | −11,76 | 0,0822 | −0,0128 | |||
| SBAC / SBA Communications Corporation | 0,00 | 4,89 | 0,05 | 12,50 | 0,0813 | 0,0060 | |||
| DTE / DTE Energy Company | 0,00 | −5,04 | 0,04 | −10,20 | 0,0806 | −0,0112 | |||
| UAL / United Airlines Holdings, Inc. | 0,00 | −24,90 | 0,04 | −12,24 | 0,0772 | −0,0152 | |||
| PPG / PPG Industries, Inc. | 0,00 | −5,40 | 0,04 | −2,38 | 0,0751 | −0,0040 | |||
| SYF / Synchrony Financial | 0,00 | −16,56 | 0,04 | 5,13 | 0,0749 | 0,0011 | |||
| ADM / Archer-Daniels-Midland Company | 0,00 | −5,54 | 0,04 | 5,26 | 0,0727 | 0,0001 | |||
| HBAN / Huntington Bancshares Incorporated | 0,00 | −13,26 | 0,04 | −2,44 | 0,0724 | −0,0051 | |||
| PPL / PPL Corporation | 0,00 | −5,48 | 0,04 | −11,11 | 0,0723 | −0,0122 | |||
| HSY / The Hershey Company | 0,00 | −4,74 | 0,04 | −9,30 | 0,0718 | −0,0087 | |||
| ES / Eversource Energy | 0,00 | −5,45 | 0,04 | −4,88 | 0,0714 | −0,0050 | |||
| EIX / Edison International | 0,00 | 17,71 | 0,04 | 2,70 | 0,0695 | −0,0004 | |||
| HUBB / Hubbell Incorporated | 0,00 | −3,09 | 0,04 | 18,75 | 0,0689 | 0,0092 | |||
| LH / Labcorp Holdings Inc. | 0,00 | −3,95 | 0,04 | 8,57 | 0,0688 | 0,0030 | |||
| K / Kellanova | 0,00 | 6,22 | 0,04 | 2,70 | 0,0682 | −0,0008 | |||
| FE / FirstEnergy Corp. | 0,00 | 7,76 | 0,04 | 8,57 | 0,0682 | 0,0023 | |||
| TROW / T. Rowe Price Group, Inc. | 0,00 | −5,11 | 0,04 | 0,00 | 0,0675 | −0,0027 | |||
| CMS / CMS Energy Corporation | 0,00 | −5,19 | 0,03 | −12,82 | 0,0613 | −0,0114 | |||
| RF / Regions Financial Corporation | 0,00 | −19,61 | 0,03 | −15,38 | 0,0609 | −0,0116 | |||
| DGX / Quest Diagnostics Incorporated | 0,00 | −4,62 | 0,03 | 3,13 | 0,0600 | −0,0014 | |||
| PFG / Principal Financial Group, Inc. | 0,00 | −5,12 | 0,03 | −11,11 | 0,0582 | −0,0093 | |||
| NI / NiSource Inc. | 0,00 | −5,44 | 0,03 | −6,06 | 0,0566 | −0,0051 | |||
| DVN / Devon Energy Corporation | 0,00 | −15,40 | 0,03 | −27,91 | 0,0561 | −0,0247 | |||
| IFF / International Flavors & Fragrances Inc. | 0,00 | −5,39 | 0,03 | −11,76 | 0,0556 | −0,0087 | |||
| LII / Lennox International Inc. | 0,00 | −5,26 | 0,03 | −3,23 | 0,0556 | −0,0039 | |||
| HAL / Halliburton Company | 0,00 | −5,42 | 0,03 | −25,00 | 0,0555 | −0,0202 | |||
| WY / Weyerhaeuser Company | 0,00 | −5,43 | 0,03 | −18,92 | 0,0554 | −0,0138 | |||
| Aptiv PLC / EC (JE00BTDN8H13) | 0,00 | −5,04 | 0,03 | 7,14 | 0,0553 | 0,0027 | |||
| USFD / US Foods Holding Corp. | 0,00 | −5,05 | 0,03 | 11,11 | 0,0546 | 0,0039 | |||
| FDS / FactSet Research Systems Inc. | 0,00 | −4,35 | 0,03 | −6,45 | 0,0530 | −0,0054 | |||
| BIIB / Biogen Inc. | 0,00 | −4,86 | 0,03 | −12,12 | 0,0530 | −0,0099 | |||
| LUV / Southwest Airlines Co. | 0,00 | −15,16 | 0,03 | −17,65 | 0,0515 | −0,0136 | |||
| J / Jacobs Solutions Inc. | 0,00 | −5,33 | 0,03 | 0,00 | 0,0502 | −0,0003 | |||
| TW / Tradeweb Markets Inc. | 0,00 | −4,50 | 0,03 | −6,90 | 0,0502 | −0,0050 | |||
| CF / CF Industries Holdings, Inc. | 0,00 | −4,79 | 0,03 | 12,50 | 0,0492 | 0,0037 | |||
| ACM / AECOM | 0,00 | −4,92 | 0,03 | 18,18 | 0,0470 | 0,0049 | |||
| CLX / The Clorox Company | 0,00 | −5,24 | 0,03 | −21,21 | 0,0468 | −0,0160 | |||
| EXPD / Expeditors International of Washington, Inc. | 0,00 | −5,04 | 0,03 | −10,71 | 0,0463 | −0,0069 | |||
| LNT / Alliant Energy Corporation | 0,00 | −5,35 | 0,03 | −10,71 | 0,0461 | −0,0076 | |||
| TSN / Tyson Foods, Inc. | 0,00 | −5,56 | 0,03 | −19,35 | 0,0461 | −0,0116 | |||
| ILMN / Illumina, Inc. | 0,00 | −5,32 | 0,03 | 13,64 | 0,0457 | 0,0041 | |||
| TXT / Textron Inc. | 0,00 | −5,42 | 0,03 | 8,70 | 0,0452 | 0,0006 | |||
| BAX / Baxter International Inc. | 0,00 | −5,56 | 0,02 | −17,24 | 0,0443 | −0,0107 | |||
| NVT / nVent Electric plc | 0,00 | −4,81 | 0,02 | 31,25 | 0,0390 | 0,0086 | |||
| OC / Owens Corning | 0,00 | −5,52 | 0,02 | −8,70 | 0,0380 | −0,0053 | |||
| REG / Regency Centers Corporation | 0,00 | −4,85 | 0,02 | −9,09 | 0,0376 | −0,0048 | |||
| BAH / Booz Allen Hamilton Holding Corporation | 0,00 | −4,35 | 0,02 | −4,76 | 0,0370 | −0,0033 | |||
| JBHT / J.B. Hunt Transport Services, Inc. | 0,00 | −4,05 | 0,02 | −4,76 | 0,0366 | −0,0041 | |||
| AMH / American Homes 4 Rent | 0,00 | −5,22 | 0,02 | −9,52 | 0,0353 | −0,0052 | |||
| SWK / Stanley Black & Decker, Inc. | 0,00 | −5,05 | 0,02 | −13,64 | 0,0343 | −0,0082 | |||
| CNH / CNH Industrial N.V. | 0,00 | −5,40 | 0,02 | 0,00 | 0,0342 | −0,0013 | |||
| NDSN / Nordson Corporation | 0,00 | −3,37 | 0,02 | 5,88 | 0,0331 | −0,0003 | |||
| SJM / The J. M. Smucker Company | 0,00 | −5,03 | 0,02 | −23,81 | 0,0300 | −0,0095 | |||
| EMN / Eastman Chemical Company | 0,00 | −4,23 | 0,02 | −16,67 | 0,0273 | −0,0076 | |||
| SCCO / Southern Copper Corporation | 0,00 | −3,27 | 0,02 | 7,14 | 0,0270 | 0,0003 | |||
| HRL / Hormel Foods Corporation | 0,00 | −4,99 | 0,01 | −7,14 | 0,0248 | −0,0029 | |||
| ALB / Albemarle Corporation | 0,00 | −4,27 | 0,01 | −20,00 | 0,0227 | −0,0055 | |||
| AES / The AES Corporation | 0,00 | −5,56 | 0,01 | −20,00 | 0,0221 | −0,0065 | |||
| DVA / DaVita Inc. | 0,00 | −3,85 | 0,01 | −9,09 | 0,0192 | −0,0030 | |||
| CPB / The Campbell's Company | 0,00 | −5,13 | 0,01 | −28,57 | 0,0183 | −0,0077 | |||
| DKS / DICK'S Sporting Goods, Inc. | 0,00 | 0,00 | 0,00 | 0,00 | 0,0043 | −0,0002 | |||
| AMTM / Amentum Holdings, Inc. | 0,00 | 0,00 | 0,0000 | 0,0000 |