Grundläggande statistik
| Portföljvärde | $ 383 720 545 |
| Aktuella positioner | 70 |
Senaste innehav, resultat, förvaltat kapital (från 13F, 13D)
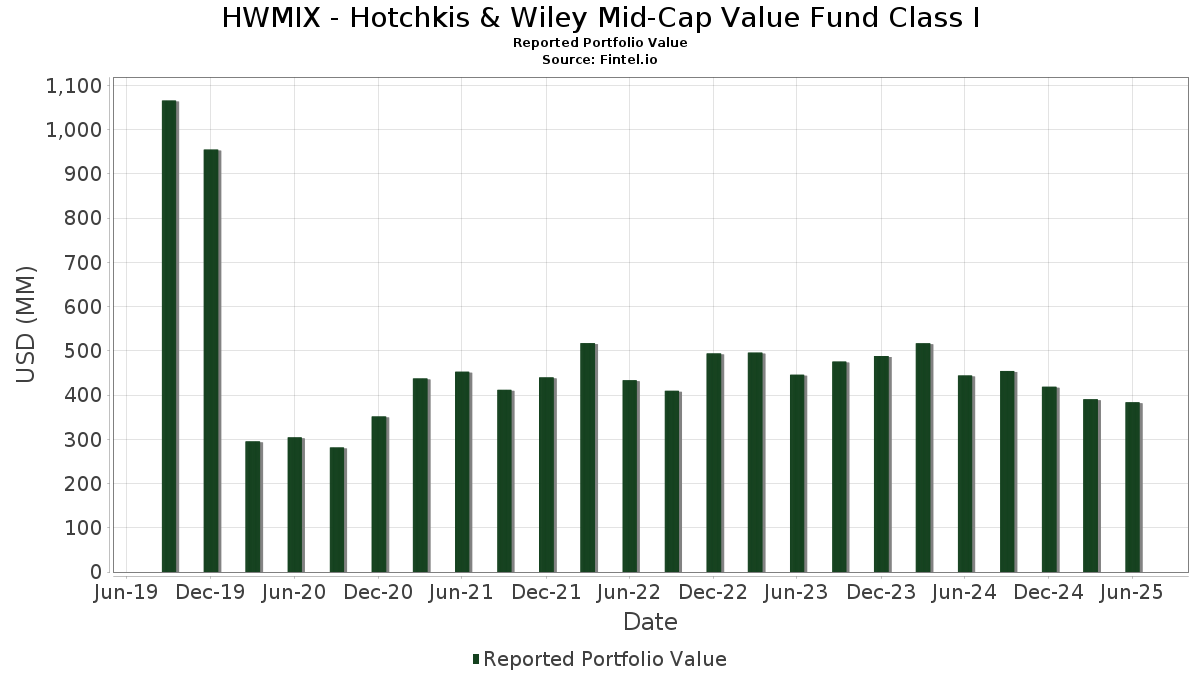
HWMIX - Hotchkis & Wiley Mid-Cap Value Fund Class I har redovisat 70 totala innehav i sina senaste SEC-arkiveringar. Det senaste portföljvärdet beräknas vara $ 383 720 545 USD. Faktiskt förvaltade tillgångar (AUM) är detta värde plus likvida medel (som inte redovisas). HWMIX - Hotchkis & Wiley Mid-Cap Value Fund Class Is största innehav är Popular, Inc. (US:BPOP) , F5, Inc. (US:FFIV) , Citizens Financial Group, Inc. (US:CFG) , Telefonaktiebolaget LM Ericsson (publ) - Depositary Receipt (Common Stock) (US:ERIC) , and Fluor Corporation (US:FLR) .
Största ökningarna detta kvartal
Vi använder förändringen i portföljallokeringen eftersom det är det mest meningsfulla måttet. Förändringar kan bero på transaktioner eller förändringar i aktiekurser.
| Värdepapper | Aktier (MM) |
Värde (MM$) |
Portfölj % av | ΔPortfölj % av |
|---|---|---|---|---|
| 19,81 | 5,2242 | 5,2242 | ||
| 0,07 | 4,90 | 1,2930 | 1,2930 | |
| 0,28 | 14,15 | 3,7313 | 0,8243 | |
| 0,34 | 15,18 | 4,0038 | 0,6745 | |
| 0,54 | 10,56 | 2,7853 | 0,5349 | |
| 0,10 | 10,25 | 2,7031 | 0,4319 | |
| 0,03 | 4,18 | 1,1033 | 0,2466 | |
| 0,03 | 5,09 | 1,3430 | 0,2191 | |
| 1,76 | 14,90 | 3,9283 | 0,2016 | |
| 0,01 | 2,74 | 0,7214 | 0,1825 |
Största minskningarna detta kvartal
Vi använder förändringen i portföljallokeringen eftersom det är det mest meningsfulla måttet. Förändringar kan bero på transaktioner eller förändringar i aktiepriser.
| Värdepapper | Aktier (MM) |
Värde (MM$) |
Portfölj % av | ΔPortfölj % av |
|---|---|---|---|---|
| 4,42 | 4,42 | 1,1667 | −1,6329 | |
| 0,28 | 3,52 | 0,9292 | −1,2071 | |
| 0,76 | 13,88 | 3,6594 | −0,7418 | |
| 4,80 | 8,25 | 2,1748 | −0,7022 | |
| 0,12 | 10,20 | 2,6902 | −0,5905 | |
| 0,04 | 6,68 | 1,7626 | −0,4674 | |
| 0,12 | 6,37 | 1,6803 | −0,4524 | |
| 0,40 | 8,05 | 2,1238 | −0,4335 | |
| 0,09 | 3,62 | 0,9556 | −0,4107 | |
| 0,09 | 1,90 | 0,5020 | −0,3823 |
13F- och fond arkiveringar
Denna blankett lämnades in den 2025-08-19 för rapporteringsperioden 2025-06-30. Klicka på länksymbolen för att se hela transaktionshistoriken.
Uppgradera för att låsa upp premiumdata och exportera till Excel![]() .
.
| Värdepapper | Typ | Genomsnittligt aktiepris | Aktier (MM) |
ΔAktier (%) |
ΔAktier (%) |
Värde ($MM) |
Portfölj (%) |
ΔPortfölj (%) |
|
|---|---|---|---|---|---|---|---|---|---|
| JPMorgan Chase and Company / STIV (N/A) | 19,81 | 5,2242 | 5,2242 | ||||||
| BPOP / Popular, Inc. | 0,14 | −13,03 | 15,67 | 3,77 | 4,1325 | 0,1582 | |||
| FFIV / F5, Inc. | 0,05 | −10,09 | 15,22 | −0,61 | 4,0124 | −0,0166 | |||
| CFG / Citizens Financial Group, Inc. | 0,34 | 9,88 | 15,18 | 20,01 | 4,0038 | 0,6745 | |||
| ERIC / Telefonaktiebolaget LM Ericsson (publ) - Depositary Receipt (Common Stock) | 1,76 | −3,74 | 14,90 | 5,19 | 3,9283 | 0,2016 | |||
| FLR / Fluor Corporation | 0,28 | −10,51 | 14,15 | 28,10 | 3,7313 | 0,8243 | |||
| APA / APA Corporation | 0,76 | −4,64 | 13,88 | −17,02 | 3,6594 | −0,7418 | |||
| ADNT / Adient plc | 0,54 | −18,38 | 10,56 | 23,52 | 2,7853 | 0,5349 | |||
| STT / State Street Corporation | 0,10 | 0,00 | 10,25 | 18,78 | 2,7031 | 0,4319 | |||
| AIG / American International Group, Inc. | 0,12 | −16,88 | 10,20 | −18,17 | 2,6902 | −0,5905 | |||
| MGA / Magna International Inc. | 0,25 | −7,72 | 9,79 | 4,82 | 2,5809 | 0,1238 | |||
| KOS / Kosmos Energy Ltd. | 4,80 | 0,00 | 8,25 | −24,56 | 2,1748 | −0,7022 | |||
| OLN / Olin Corporation | 0,40 | 0,00 | 8,05 | −17,11 | 2,1238 | −0,4335 | |||
| ALLY / Ally Financial Inc. | 0,18 | 0,00 | 7,19 | 6,80 | 1,8970 | 0,1244 | |||
| D / Dominion Energy, Inc. | 0,12 | −9,96 | 7,05 | −9,24 | 1,8600 | −0,1851 | |||
| WBD / Warner Bros. Discovery, Inc. | 0,60 | 0,00 | 6,93 | 6,80 | 1,8270 | 0,1199 | |||
| CNH / CNH Industrial N.V. | 0,52 | 0,00 | 6,74 | 5,53 | 1,7764 | 0,0966 | |||
| UHS / Universal Health Services, Inc. | 0,04 | −18,18 | 6,68 | −21,12 | 1,7626 | −0,4674 | |||
| HUM / Humana Inc. | 0,03 | 1,13 | 6,58 | −6,56 | 1,7341 | −0,1180 | |||
| CNC / Centene Corporation | 0,12 | −12,06 | 6,37 | −21,37 | 1,6803 | −0,4524 | |||
| BCO / The Brink's Company | 0,07 | −17,65 | 6,08 | −14,67 | 1,6034 | −0,2717 | |||
| OVV / Ovintiv Inc. | 0,16 | −7,50 | 5,91 | −17,77 | 1,5582 | −0,3329 | |||
| HII / Huntington Ingalls Industries, Inc. | 0,02 | −4,80 | 5,75 | 12,64 | 1,5153 | 0,1730 | |||
| UHALB / U-Haul Holding Company - Series N | 0,10 | 0,00 | 5,49 | −8,13 | 1,4480 | −0,1249 | |||
| WHR / Whirlpool Corporation | 0,05 | 0,00 | 5,35 | 12,53 | 1,4120 | 0,1597 | |||
| SWK / Stanley Black & Decker, Inc. | 0,08 | 0,00 | 5,20 | −11,87 | 1,3720 | −0,1817 | |||
| WCC / WESCO International, Inc. | 0,03 | 0,00 | 5,09 | 19,27 | 1,3430 | 0,2191 | |||
| VAC / Marriott Vacations Worldwide Corporation | 0,07 | 0,00 | 4,92 | 12,57 | 1,2966 | 0,1470 | |||
| CRGY / Crescent Energy Company | 0,57 | 14,07 | 4,91 | −12,73 | 1,2944 | −0,1857 | |||
| GEHC / GE HealthCare Technologies Inc. | 0,07 | 4,90 | 1,2930 | 1,2930 | |||||
| AVT / Avnet, Inc. | 0,09 | 0,00 | 4,54 | 10,39 | 1,1967 | 0,1147 | |||
| WPP / WPP plc - Depositary Receipt (Common Stock) | 0,13 | 6,02 | 4,44 | −2,22 | 1,1715 | −0,0242 | |||
| US8252528851 / Invesco Government & Agency Portfolio, Institutional Class | 4,42 | −58,41 | 4,42 | −58,41 | 1,1667 | −1,6329 | |||
| LAD / Lithia Motors, Inc. | 0,01 | 0,00 | 4,39 | 15,07 | 1,1580 | 0,1538 | |||
| NTRS / Northern Trust Corporation | 0,03 | 0,00 | 4,18 | 28,54 | 1,1033 | 0,2466 | |||
| Aptiv PLC / EC (JE00BTDN8H13) | 0,06 | 0,00 | 4,02 | 14,67 | 1,0595 | 0,1373 | |||
| FHN / First Horizon Corporation | 0,19 | 0,00 | 3,99 | 9,17 | 1,0515 | 0,0902 | |||
| CMA / Comerica Incorporated | 0,07 | 0,00 | 3,89 | 1,01 | 1,0255 | 0,0122 | |||
| SOLV / Solventum Corporation | 0,05 | 0,00 | 3,88 | −0,26 | 1,0219 | −0,0006 | |||
| LEA / Lear Corporation | 0,04 | −11,19 | 3,77 | −4,39 | 0,9943 | −0,0434 | |||
| BWA / BorgWarner Inc. | 0,11 | −12,84 | 3,73 | 1,86 | 0,9826 | 0,0198 | |||
| CRC / California Resources Corporation | 0,08 | 0,00 | 3,72 | 3,88 | 0,9815 | 0,0385 | |||
| HLF / Herbalife Ltd. | 0,42 | 0,00 | 3,64 | −0,14 | 0,9606 | 0,0008 | |||
| MAN / ManpowerGroup Inc. | 0,09 | 0,00 | 3,62 | −30,21 | 0,9556 | −0,4107 | |||
| NOV / NOV Inc. | 0,28 | −46,85 | 3,52 | −56,60 | 0,9292 | −1,2071 | |||
| BTE / Baytex Energy Corp. | 1,95 | 0,00 | 3,49 | −19,73 | 0,9203 | −0,2239 | |||
| PPL / PPL Corporation | 0,09 | −14,17 | 3,20 | −19,45 | 0,8445 | −0,2017 | |||
| SLM / SLM Corporation | 0,10 | 0,00 | 3,19 | 11,64 | 0,8422 | 0,0894 | |||
| JAZZ / Jazz Pharmaceuticals plc | 0,03 | 0,00 | 3,14 | −14,51 | 0,8283 | −0,1388 | |||
| PARA / Paramount Global | 0,24 | 0,00 | 3,05 | 7,84 | 0,8055 | 0,0602 | |||
| KHC / The Kraft Heinz Company | 0,11 | −20,80 | 2,87 | −32,79 | 0,7571 | −0,3672 | |||
| NRG / NRG Energy, Inc. | 0,02 | −35,06 | 2,83 | 9,28 | 0,7452 | 0,0645 | |||
| WDAY / Workday, Inc. | 0,01 | 31,03 | 2,74 | 21,93 | 0,7214 | 0,1825 | |||
| ODP / The ODP Corporation | 0,15 | 0,00 | 2,64 | 26,50 | 0,6963 | 0,1471 | |||
| AGCO / AGCO Corporation | 0,02 | 0,00 | 2,35 | 11,47 | 0,6202 | 0,0648 | |||
| KEY / KeyCorp | 0,13 | 0,00 | 2,23 | 8,96 | 0,5870 | 0,0493 | |||
| LH / Labcorp Holdings Inc. | 0,01 | 0,00 | 2,15 | 12,79 | 0,5676 | 0,0654 | |||
| FCNCA / First Citizens BancShares, Inc. | 0,00 | 0,00 | 2,13 | 5,51 | 0,5608 | 0,0304 | |||
| JLL / Jones Lang LaSalle Incorporated | 0,01 | −8,24 | 2,00 | −5,32 | 0,5261 | −0,0284 | |||
| GT / The Goodyear Tire & Rubber Company | 0,19 | 0,00 | 1,97 | 12,24 | 0,5198 | 0,0576 | |||
| FDX / FedEx Corporation | 0,01 | 0,00 | 1,93 | −6,76 | 0,5095 | −0,0358 | |||
| HUN / Huntsman Corporation | 0,18 | 0,00 | 1,90 | −34,03 | 0,5023 | −0,2573 | |||
| CAG / Conagra Brands, Inc. | 0,09 | −26,19 | 1,90 | −43,36 | 0,5020 | −0,3823 | |||
| CPRI / Capri Holdings Limited | 0,10 | 0,00 | 1,75 | −10,31 | 0,4611 | −0,0518 | |||
| HAL / Halliburton Company | 0,09 | 0,00 | 1,73 | −19,65 | 0,4573 | −0,1108 | |||
| MUR / Murphy Oil Corporation | 0,08 | 0,00 | 1,73 | −20,75 | 0,4562 | −0,1185 | |||
| OMC / Omnicom Group Inc. | 0,02 | 0,00 | 1,71 | −13,23 | 0,4515 | −0,0678 | |||
| EEFT / Euronet Worldwide, Inc. | 0,02 | 0,00 | 1,63 | −5,12 | 0,4304 | −0,0223 | |||
| PEB / Pebblebrook Hotel Trust | 0,16 | 0,00 | 1,61 | −1,41 | 0,4257 | −0,0051 | |||
| XPRO / Expro Group Holdings N.V. | 0,12 | 0,00 | 1,00 | −13,55 | 0,2625 | −0,0406 | |||
| Brown Brothers Harriman and Co. / STIV (N/A) | 0,00 | 0,0000 | 0,0000 |