Grundläggande statistik
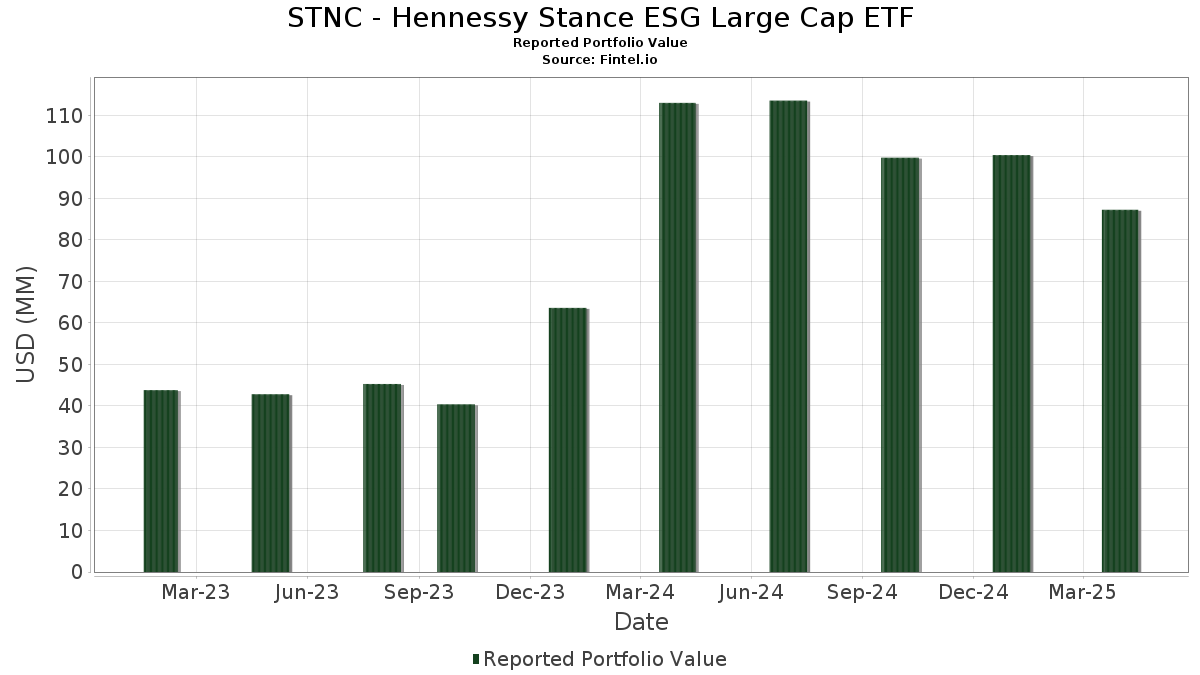
| Portföljvärde | $ 87 259 910 |
| Aktuella positioner | 53 |
Senaste innehav, resultat, förvaltat kapital (från 13F, 13D)
STNC - Hennessy Stance ESG Large Cap ETF har redovisat 53 totala innehav i sina senaste SEC-arkiveringar. Det senaste portföljvärdet beräknas vara $ 87 259 910 USD. Faktiskt förvaltade tillgångar (AUM) är detta värde plus likvida medel (som inte redovisas). STNC - Hennessy Stance ESG Large Cap ETFs största innehav är Netflix, Inc. (US:NFLX) , Hubbell Incorporated (US:HUBB) , Ulta Beauty, Inc. (US:ULTA) , Ross Stores, Inc. (US:ROST) , and NetApp, Inc. (US:NTAP) . STNC - Hennessy Stance ESG Large Cap ETFs nya positioner inkluderar Hubbell Incorporated (US:HUBB) , Ross Stores, Inc. (US:ROST) , NetApp, Inc. (US:NTAP) , JPMorgan Chase & Co. (US:JPM) , and Motorola Solutions, Inc. (US:MSI) .
Största ökningarna detta kvartal
Vi använder förändringen i portföljallokeringen eftersom det är det mest meningsfulla måttet. Förändringar kan bero på transaktioner eller förändringar i aktiekurser.
| Värdepapper | Aktier (MM) |
Värde (MM$) |
Portfölj % av | ΔPortfölj % av |
|---|---|---|---|---|
| 0,00 | 2,34 | 2,6832 | 2,6832 | |
| 0,01 | 2,22 | 2,5399 | 2,5399 | |
| 0,02 | 2,12 | 2,4330 | 2,4330 | |
| 0,02 | 2,09 | 2,3962 | 2,3962 | |
| 0,01 | 2,08 | 2,3773 | 2,3773 | |
| 0,00 | 2,04 | 2,3339 | 2,3339 | |
| 0,01 | 2,02 | 2,3137 | 2,3137 | |
| 0,01 | 2,00 | 2,2871 | 2,2871 | |
| 0,01 | 2,00 | 2,2857 | 2,2857 | |
| 0,01 | 1,98 | 2,2686 | 2,2686 |
Största minskningarna detta kvartal
Vi använder förändringen i portföljallokeringen eftersom det är det mest meningsfulla måttet. Förändringar kan bero på transaktioner eller förändringar i aktiepriser.
| Värdepapper | Aktier (MM) |
Värde (MM$) |
Portfölj % av | ΔPortfölj % av |
|---|---|---|---|---|
| 0,00 | 0,00 | −3,7492 | ||
| 0,00 | 0,00 | −3,5957 | ||
| 0,00 | 0,00 | −3,4500 | ||
| 0,00 | 0,00 | −3,3816 | ||
| 0,00 | 0,57 | 0,6570 | −2,8566 | |
| 0,00 | 0,00 | −2,8025 | ||
| 0,00 | 0,00 | −2,6103 | ||
| 0,00 | 0,00 | −2,4721 | ||
| 0,00 | 0,44 | 0,5074 | −1,9030 | |
| 0,02 | 1,72 | 1,9648 | −1,6916 |
13F- och fond arkiveringar
Denna blankett lämnades in den 2025-06-26 för rapporteringsperioden 2025-04-30. Klicka på länksymbolen för att se hela transaktionshistoriken.
Uppgradera för att låsa upp premiumdata och exportera till Excel![]() .
.
| Värdepapper | Typ | Genomsnittligt aktiepris | Aktier (MM) |
ΔAktier (%) |
ΔAktier (%) |
Värde ($MM) |
Portfölj (%) |
ΔPortfölj (%) |
|
|---|---|---|---|---|---|---|---|---|---|
| NFLX / Netflix, Inc. | 0,00 | 2,34 | 2,6832 | 2,6832 | |||||
| HUBB / Hubbell Incorporated | 0,01 | 2,22 | 2,5399 | 2,5399 | |||||
| ULTA / Ulta Beauty, Inc. | 0,01 | 61,04 | 2,15 | 53,57 | 2,4629 | −0,6288 | |||
| ROST / Ross Stores, Inc. | 0,02 | 2,12 | 2,4330 | 2,4330 | |||||
| NTAP / NetApp, Inc. | 0,02 | 2,09 | 2,3962 | 2,3962 | |||||
| JPM / JPMorgan Chase & Co. | 0,01 | 2,08 | 2,3773 | 2,3773 | |||||
| TJX / The TJX Companies, Inc. | 0,02 | −41,73 | 2,05 | −33,69 | 2,3502 | −0,7485 | |||
| MSI / Motorola Solutions, Inc. | 0,00 | 2,04 | 2,3339 | 2,3339 | |||||
| DHI / D.R. Horton, Inc. | 0,02 | −33,28 | 2,02 | −40,61 | 2,3144 | −1,0743 | |||
| CHTR / Charter Communications, Inc. | 0,01 | 2,02 | 2,3137 | 2,3137 | |||||
| CAH / Cardinal Health, Inc. | 0,01 | −48,95 | 2,02 | −41,67 | 2,3104 | −1,1350 | |||
| MCD / McDonald's Corporation | 0,01 | 2,00 | 2,2871 | 2,2871 | |||||
| SYK / Stryker Corporation | 0,01 | 2,00 | 2,2857 | 2,2857 | |||||
| WAB / Westinghouse Air Brake Technologies Corporation | 0,01 | −46,77 | 2,00 | −38,97 | 2,2852 | −0,5936 | |||
| GRMN / Garmin Ltd. | 0,01 | 1,98 | 2,2686 | 2,2686 | |||||
| ROK / Rockwell Automation, Inc. | 0,01 | 1,98 | 2,2647 | 2,2647 | |||||
| EXC / Exelon Corporation | 0,04 | 7,89 | 1,98 | 26,12 | 2,2625 | −1,1944 | |||
| K / Kellanova | 0,02 | 1,97 | 2,2549 | 2,2549 | |||||
| MA / Mastercard Incorporated | 0,00 | −44,16 | 1,97 | −44,90 | 2,2536 | −1,3036 | |||
| CVS / CVS Health Corporation | 0,03 | 1,96 | 2,2501 | 2,2501 | |||||
| WELL / Welltower Inc. | 0,01 | 36,43 | 1,96 | 52,53 | 2,2458 | 0,9652 | |||
| VTRS / Viatris Inc. | 0,23 | −9,03 | 1,96 | −32,11 | 2,2409 | −0,6294 | |||
| IR / Ingersoll Rand Inc. | 0,03 | −6,33 | 1,94 | −24,67 | 2,2211 | −0,3435 | |||
| CSCO / Cisco Systems, Inc. | 0,03 | 1,94 | 2,2175 | 2,2175 | |||||
| MMM / 3M Company | 0,01 | −43,48 | 1,91 | −38,87 | 2,1924 | −0,9450 | |||
| WBA / Walgreens Boots Alliance, Inc. | 0,17 | 1,91 | 2,1906 | 2,1906 | |||||
| CLX / The Clorox Company | 0,01 | 1,88 | 2,1565 | 2,1565 | |||||
| T / AT&T Inc. | 0,07 | −55,11 | 1,88 | −44,84 | 2,1485 | −1,2574 | |||
| MTD / Mettler-Toledo International Inc. | 0,00 | 105,65 | 1,87 | 81,46 | 2,1409 | −0,1330 | |||
| GIS / General Mills, Inc. | 0,03 | 1,84 | 2,1121 | 2,1121 | |||||
| RJF / Raymond James Financial, Inc. | 0,01 | 1,84 | 2,1067 | 2,1067 | |||||
| IP / International Paper Company | 0,04 | −37,40 | 1,80 | −48,60 | 2,0583 | −1,4244 | |||
| MAA / Mid-America Apartment Communities, Inc. | 0,01 | 73,74 | 1,78 | 81,73 | 2,0409 | 1,0645 | |||
| EIX / Edison International | 0,03 | 1,77 | 2,0329 | 2,0329 | |||||
| SBUX / Starbucks Corporation | 0,02 | −37,13 | 1,72 | −53,27 | 1,9648 | −1,6916 | |||
| BMY / Bristol-Myers Squibb Company | 0,03 | −3,94 | 1,68 | −18,17 | 1,9244 | −0,1216 | |||
| PLTR / Palantir Technologies Inc. | 0,01 | 1,68 | 1,9223 | 1,9223 | |||||
| GPC / Genuine Parts Company | 0,01 | 1,62 | 1,8567 | 1,8567 | |||||
| GL / Globe Life Inc. | 0,01 | 1,62 | 1,8511 | 1,8511 | |||||
| SHW / The Sherwin-Williams Company | 0,00 | 1,55 | 1,7749 | 1,7749 | |||||
| GOOGL / Alphabet Inc. | 0,01 | 49,59 | 1,54 | 38,50 | 1,7601 | 0,7831 | |||
| AAPL / Apple Inc. | 0,01 | 1,40 | 1,5979 | 1,5979 | |||||
| HD / The Home Depot, Inc. | 0,00 | 526,33 | 1,15 | 449,76 | 1,3163 | 1,1074 | |||
| EMN / Eastman Chemical Company | 0,01 | 1,00 | 1,1502 | 1,1502 | |||||
| POOL / Pool Corporation | 0,00 | 0,97 | 1,1124 | 1,1124 | |||||
| BAC / Bank of America Corporation | 0,02 | 0,69 | 0,7872 | 0,7872 | |||||
| LEN / Lennar Corporation | 0,01 | 0,69 | 0,7858 | 0,7858 | |||||
| LOW / Lowe's Companies, Inc. | 0,00 | −81,08 | 0,57 | −83,75 | 0,6570 | −2,8566 | |||
| RCL / Royal Caribbean Cruises Ltd. | 0,00 | 0,49 | 0,5666 | 0,5666 | |||||
| FGXXX / First American Funds Inc - First American Government Obligations Fund Class X | 0,44 | 27,89 | 0,44 | 28,03 | 0,5075 | 0,1623 | |||
| ORCL / Oracle Corporation | 0,00 | −77,87 | 0,44 | −81,73 | 0,5074 | −1,9030 | |||
| ATO / Atmos Energy Corporation | 0,00 | 0,42 | 0,4806 | 0,4806 | |||||
| FITB / Fifth Third Bancorp | 0,01 | 0,34 | 0,3890 | 0,3890 | |||||
| RF / Regions Financial Corporation | 0,00 | −100,00 | 0,00 | −100,00 | −2,4721 | ||||
| IBM / International Business Machines Corporation | 0,00 | −100,00 | 0,00 | −100,00 | −3,5957 | ||||
| DELL / Dell Technologies Inc. | 0,00 | −100,00 | 0,00 | −100,00 | −0,3189 | ||||
| MCK / McKesson Corporation | 0,00 | −100,00 | 0,00 | −100,00 | −3,4500 | ||||
| JCI / Johnson Controls International plc | 0,00 | −100,00 | 0,00 | −100,00 | −0,7687 | ||||
| XEL / Xcel Energy Inc. | 0,00 | −100,00 | 0,00 | −100,00 | −1,1805 | ||||
| GEV / GE Vernova Inc. | 0,00 | −100,00 | 0,00 | −100,00 | −0,4238 | ||||
| NVDA / NVIDIA Corporation | 0,00 | −100,00 | 0,00 | −100,00 | −2,8025 | ||||
| MS / Morgan Stanley | 0,00 | −100,00 | 0,00 | −100,00 | −2,6103 | ||||
| STT / State Street Corporation | 0,00 | −100,00 | 0,00 | −100,00 | −0,5442 | ||||
| PHM / PulteGroup, Inc. | 0,00 | −100,00 | 0,00 | −100,00 | −0,6109 | ||||
| HCA / HCA Healthcare, Inc. | 0,00 | −100,00 | 0,00 | −100,00 | −3,7492 | ||||
| PPG / PPG Industries, Inc. | 0,00 | −100,00 | 0,00 | −100,00 | −3,3816 |