Grundläggande statistik
| Portföljvärde | $ 286 421 |
| Aktuella positioner | 46 |
Senaste innehav, resultat, förvaltat kapital (från 13F, 13D)
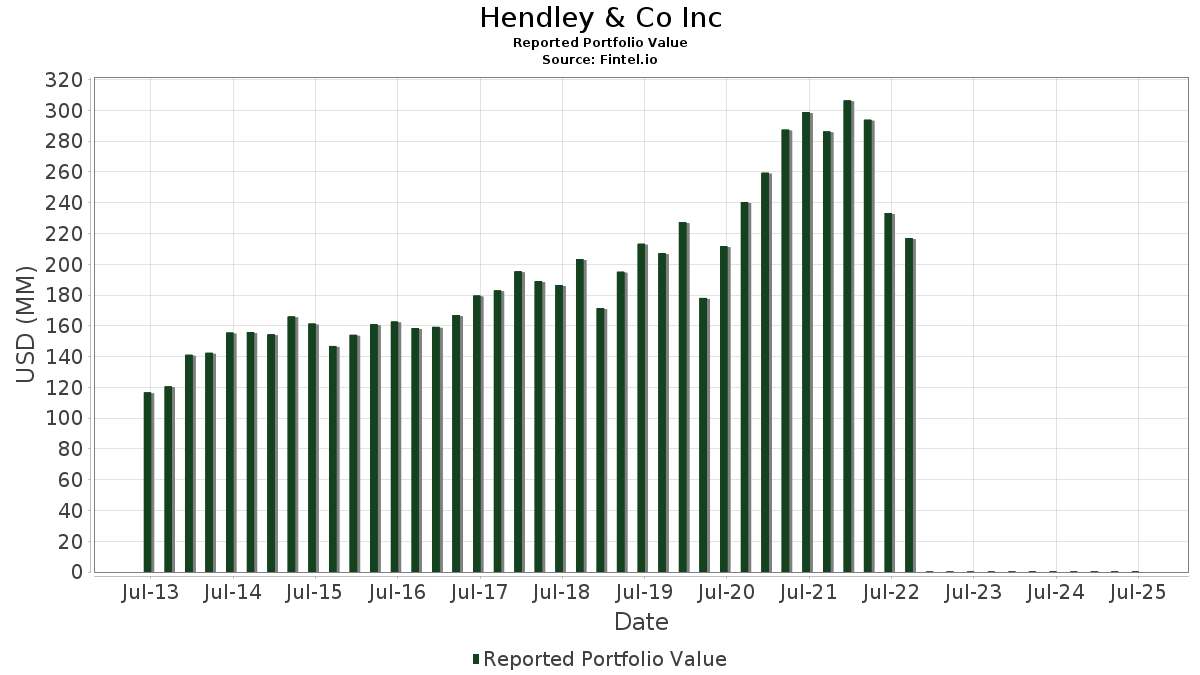
Hendley & Co Inc har redovisat 46 totala innehav i sina senaste SEC-arkiveringar. Det senaste portföljvärdet beräknas vara $ 286 421 USD. Faktiskt förvaltade tillgångar (AUM) är detta värde plus likvida medel (som inte redovisas). Hendley & Co Incs största innehav är Visa Inc. (US:V) , Berkshire Hathaway Inc. (US:BRK.B) , Microsoft Corporation (US:MSFT) , Amphenol Corporation (US:APH) , and Abbott Laboratories (US:ABT) . Hendley & Co Incs nya positioner inkluderar Linde plc (US:LIN) , IDACORP, Inc. (US:IDA) , .
Största ökningarna detta kvartal
Vi använder förändringen i portföljallokeringen eftersom det är det mest meningsfulla måttet. Förändringar kan bero på transaktioner eller förändringar i aktiekurser.
| Värdepapper | Aktier (MM) |
Värde (MM$) |
Portfölj % av | ΔPortfölj % av |
|---|---|---|---|---|
| 0,05 | 0,02 | 8,4337 | 2,0223 | |
| 0,16 | 0,02 | 5,3900 | 1,7728 | |
| 0,02 | 0,01 | 5,0471 | 1,6260 | |
| 0,01 | 0,00 | 1,5802 | 1,5802 | |
| 0,05 | 0,01 | 3,5905 | 1,2444 | |
| 0,01 | 0,01 | 1,9363 | 0,7984 | |
| 0,02 | 0,01 | 3,0923 | 0,7888 | |
| 0,03 | 0,00 | 1,5020 | 0,4609 | |
| 0,03 | 0,01 | 2,0299 | 0,4448 | |
| 0,09 | 0,01 | 2,8462 | 0,3955 |
Största minskningarna detta kvartal
Vi använder förändringen i portföljallokeringen eftersom det är det mest meningsfulla måttet. Förändringar kan bero på transaktioner eller förändringar i aktiepriser.
| Värdepapper | Aktier (MM) |
Värde (MM$) |
Portfölj % av | ΔPortfölj % av |
|---|---|---|---|---|
| 0,05 | 0,03 | 9,1830 | −1,9155 | |
| 0,01 | 0,00 | 0,7520 | −0,8480 | |
| 0,06 | 0,01 | 4,5227 | −0,8040 | |
| 0,05 | 0,01 | 2,6918 | −0,4849 | |
| 0,08 | 0,01 | 2,4031 | −0,4436 | |
| 0,05 | 0,01 | 2,4666 | −0,3367 | |
| 0,01 | 0,00 | 0,1505 | −0,2753 | |
| 0,08 | 0,00 | 0,7063 | −0,1900 | |
| 0,00 | 0,00 | 0,0751 | −0,1770 | |
| 0,05 | 0,01 | 2,7641 | −0,1766 |
13F- och fond arkiveringar
Denna blankett lämnades in den 2025-07-23 för rapporteringsperioden 2025-06-30. Klicka på länksymbolen för att se hela transaktionshistoriken.
Uppgradera för att låsa upp premiumdata och exportera till Excel![]() .
.
| Värdepapper | Typ | Genomsnittligt aktiepris | Aktier (MM) |
ΔAktier (%) |
ΔAktier (%) |
Värde ($MM) |
Portfölj (%) |
ΔPortfölj (%) |
|
|---|---|---|---|---|---|---|---|---|---|
| V / Visa Inc. | 0,07 | −0,33 | 0,03 | 0,00 | 9,2322 | 0,0775 | |||
| BRK.B / Berkshire Hathaway Inc. | 0,05 | −9,17 | 0,03 | −16,13 | 9,1830 | −1,9155 | |||
| MSFT / Microsoft Corporation | 0,05 | −0,60 | 0,02 | 33,33 | 8,4337 | 2,0223 | |||
| APH / Amphenol Corporation | 0,16 | −0,90 | 0,02 | 50,00 | 5,3900 | 1,7728 | |||
| ABT / Abbott Laboratories | 0,11 | 2,60 | 0,01 | 7,69 | 5,0866 | 0,2447 | |||
| PH / Parker-Hannifin Corporation | 0,02 | 28,55 | 0,01 | 55,56 | 5,0471 | 1,6260 | |||
| AAPL / Apple Inc. | 0,06 | −7,96 | 0,01 | −20,00 | 4,5227 | −0,8040 | |||
| AMZN / Amazon.com, Inc. | 0,05 | 32,88 | 0,01 | 66,67 | 3,5905 | 1,2444 | |||
| ETN / Eaton Corporation plc | 0,02 | 2,36 | 0,01 | 33,33 | 3,0923 | 0,7888 | |||
| UNP / Union Pacific Corporation | 0,04 | −1,76 | 0,01 | −11,11 | 3,0267 | −0,1406 | |||
| WPM / Wheaton Precious Metals Corp. | 0,09 | 0,52 | 0,01 | 14,29 | 2,8462 | 0,3955 | |||
| GJR / Strats Trust For Procter & Gambel Security - Preferred Security | 0,05 | 0,67 | 0,01 | −12,50 | 2,7641 | −0,1766 | |||
| CVX / Chevron Corporation | 0,05 | −0,88 | 0,01 | −22,22 | 2,6918 | −0,4849 | |||
| PEP / PepsiCo, Inc. | 0,05 | 0,05 | 0,01 | −12,50 | 2,4666 | −0,3367 | |||
| COP / ConocoPhillips | 0,08 | −1,08 | 0,01 | −25,00 | 2,4031 | −0,4436 | |||
| EOG / EOG Resources, Inc. | 0,05 | 1,29 | 0,01 | 0,00 | 2,2841 | −0,1365 | |||
| AMAT / Applied Materials, Inc. | 0,03 | 1,65 | 0,01 | 25,00 | 2,0299 | 0,4448 | |||
| SYK / Stryker Corporation | 0,01 | 60,32 | 0,01 | 66,67 | 1,9363 | 0,7984 | |||
| AZN / AstraZeneca PLC - Depositary Receipt (Common Stock) | 0,07 | 0,89 | 0,01 | 0,00 | 1,7977 | −0,0789 | |||
| ADBE / Adobe Inc. | 0,01 | 1,41 | 0,00 | 0,00 | 1,6270 | 0,0346 | |||
| HON / Honeywell International Inc. | 0,02 | −0,56 | 0,00 | 0,00 | 1,5917 | 0,1346 | |||
| JNJ / Johnson & Johnson | 0,03 | −1,35 | 0,00 | 0,00 | 1,5851 | −0,1618 | |||
| LIN / Linde plc | 0,01 | 0,00 | 1,5802 | 1,5802 | |||||
| HSY / The Hershey Company | 0,03 | −1,15 | 0,00 | 0,00 | 1,5236 | −0,0670 | |||
| AZO / AutoZone, Inc. | 0,00 | 0,69 | 0,00 | 0,00 | 1,5201 | −0,0327 | |||
| NVDA / NVIDIA Corporation | 0,03 | −0,91 | 0,00 | 100,00 | 1,5020 | 0,4609 | |||
| AEP / American Electric Power Company, Inc. | 0,04 | 0,15 | 0,00 | 0,00 | 1,4706 | −0,0778 | |||
| EXPD / Expeditors International of Washington, Inc. | 0,04 | −0,41 | 0,00 | 0,00 | 1,4479 | −0,0844 | |||
| ACGL / Arch Capital Group Ltd. | 0,04 | −0,47 | 0,00 | −25,00 | 1,3529 | −0,0846 | |||
| COST / Costco Wholesale Corporation | 0,00 | −0,03 | 0,00 | 0,00 | 1,1204 | 0,0482 | |||
| TROW / T. Rowe Price Group, Inc. | 0,03 | −0,76 | 0,00 | 0,00 | 1,0031 | 0,0396 | |||
| ORCL / Oracle Corporation | 0,01 | −69,91 | 0,00 | −50,00 | 0,7520 | −0,8480 | |||
| XOM / Exxon Mobil Corporation | 0,02 | 2,48 | 0,00 | 0,00 | 0,7231 | −0,0562 | |||
| BFB / Brown-Forman Corp. - Class B | 0,08 | −0,51 | 0,00 | 0,00 | 0,7063 | −0,1900 | |||
| PM / Philip Morris International Inc. | 0,01 | −32,66 | 0,00 | −50,00 | 0,5921 | −0,1749 | |||
| AXP / American Express Company | 0,00 | 12,44 | 0,00 | 0,3774 | 0,0939 | ||||
| TJX / The TJX Companies, Inc. | 0,01 | 75,03 | 0,00 | 0,3582 | 0,1562 | ||||
| KO / The Coca-Cola Company | 0,01 | −0,92 | 0,00 | 0,2660 | −0,0063 | ||||
| BRK.A / Berkshire Hathaway Inc. | 0,00 | 0,00 | 0,00 | 0,2545 | −0,0245 | ||||
| GOOG.L / Alphabet Inc. | 0,00 | 0,00 | 0,00 | 0,1889 | 0,0228 | ||||
| GLW / Corning Incorporated | 0,01 | −69,19 | 0,00 | −100,00 | 0,1505 | −0,2753 | |||
| AMGN / Amgen Inc. | 0,00 | −3,27 | 0,00 | 0,1442 | −0,0222 | ||||
| AVGO / Broadcom Inc. | 0,00 | 0,00 | 0,1030 | 0,1030 | |||||
| IDA / IDACORP, Inc. | 0,00 | 0,00 | 0,0841 | 0,0841 | |||||
| HD / The Home Depot, Inc. | 0,00 | 0,00 | 0,00 | 0,0754 | −0,0001 | ||||
| PSX / Phillips 66 | 0,00 | −69,07 | 0,00 | 0,0751 | −0,1770 | ||||
| BDX / Becton, Dickinson and Company | 0,00 | −100,00 | 0,00 | 0,0000 | |||||
| RS / Reliance, Inc. | 0,00 | −100,00 | 0,00 | 0,0000 | |||||
| JPM / JPMorgan Chase & Co. | 0,00 | −100,00 | 0,00 | 0,0000 | |||||
| GD / General Dynamics Corporation | 0,00 | −100,00 | 0,00 | 0,0000 | |||||
| CB / Chubb Limited | 0,00 | −100,00 | 0,00 | 0,0000 | |||||
| APD / Air Products and Chemicals, Inc. | 0,00 | −100,00 | 0,00 | 0,0000 | |||||
| CL / Colgate-Palmolive Company | 0,00 | −100,00 | 0,00 | 0,0000 | |||||
| MLM / Martin Marietta Materials, Inc. | 0,00 | −100,00 | 0,00 | 0,0000 |