Grundläggande statistik
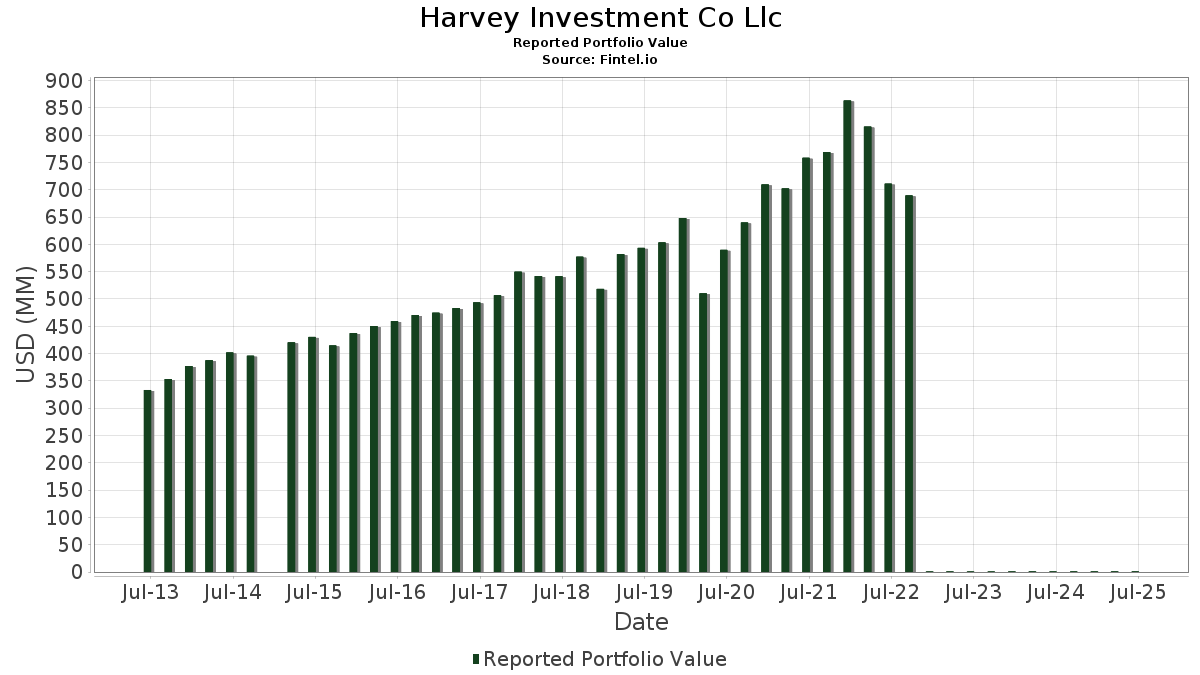
| Portföljvärde | $ 909 958 |
| Aktuella positioner | 102 |
Senaste innehav, resultat, förvaltat kapital (från 13F, 13D)
Harvey Investment Co Llc har redovisat 102 totala innehav i sina senaste SEC-arkiveringar. Det senaste portföljvärdet beräknas vara $ 909 958 USD. Faktiskt förvaltade tillgångar (AUM) är detta värde plus likvida medel (som inte redovisas). Harvey Investment Co Llcs största innehav är O'Reilly Automotive, Inc. (US:ORLY) , Berkshire Hathaway Inc. (US:BRK.B) , The TJX Companies, Inc. (US:TJX) , Fastenal Company (US:FAST) , and Verisk Analytics, Inc. (US:VRSK) . Harvey Investment Co Llcs nya positioner inkluderar Eagle Materials Inc. (US:EXP) , Oracle Corporation (US:ORCL) , .
Största ökningarna detta kvartal
Vi använder förändringen i portföljallokeringen eftersom det är det mest meningsfulla måttet. Förändringar kan bero på transaktioner eller förändringar i aktiekurser.
| Värdepapper | Aktier (MM) |
Värde (MM$) |
Portfölj % av | ΔPortfölj % av |
|---|---|---|---|---|
| 0,25 | 0,03 | 2,7563 | 0,8533 | |
| 0,05 | 0,03 | 3,1029 | 0,6556 | |
| 0,05 | 0,02 | 2,5841 | 0,5361 | |
| 0,08 | 0,02 | 2,0993 | 0,4220 | |
| 0,01 | 0,00 | 0,3303 | 0,3303 | |
| 0,04 | 0,01 | 0,8098 | 0,2865 | |
| 0,10 | 0,02 | 2,4236 | 0,2821 | |
| 0,11 | 0,02 | 2,1134 | 0,2388 | |
| 0,01 | 0,01 | 0,8128 | 0,1931 | |
| 1,02 | 0,04 | 4,7052 | 0,1801 |
Största minskningarna detta kvartal
Vi använder förändringen i portföljallokeringen eftersom det är det mest meningsfulla måttet. Förändringar kan bero på transaktioner eller förändringar i aktiepriser.
| Värdepapper | Aktier (MM) |
Värde (MM$) |
Portfölj % av | ΔPortfölj % av |
|---|---|---|---|---|
| 0,97 | 0,09 | 9,6346 | −1,0484 | |
| 0,10 | 0,05 | 5,5045 | −0,7550 | |
| 0,08 | 0,03 | 2,9611 | −0,3789 | |
| 0,20 | 0,03 | 3,3930 | −0,3555 | |
| 0,00 | 0,02 | 2,4027 | −0,2565 | |
| 0,08 | 0,01 | 1,6143 | −0,2266 | |
| 0,18 | 0,03 | 2,8809 | −0,2217 | |
| 0,09 | 0,01 | 1,3119 | −0,2052 | |
| 0,16 | 0,03 | 3,2851 | −0,1828 | |
| 0,12 | 0,01 | 1,3826 | −0,1584 |
13F- och fond arkiveringar
Denna blankett lämnades in den 2025-07-23 för rapporteringsperioden 2025-06-30. Klicka på länksymbolen för att se hela transaktionshistoriken.
Uppgradera för att låsa upp premiumdata och exportera till Excel![]() .
.
| Värdepapper | Typ | Genomsnittligt aktiepris | Aktier (MM) |
ΔAktier (%) |
ΔAktier (%) |
Värde ($MM) |
Portfölj (%) |
ΔPortfölj (%) |
|
|---|---|---|---|---|---|---|---|---|---|
| ORLY / O'Reilly Automotive, Inc. | 0,97 | 1 348,14 | 0,09 | −9,37 | 9,6346 | −1,0484 | |||
| BRK.B / Berkshire Hathaway Inc. | 0,10 | −2,60 | 0,05 | −10,71 | 5,5045 | −0,7550 | |||
| TJX / The TJX Companies, Inc. | 0,36 | −2,60 | 0,04 | −2,27 | 4,8210 | −0,1108 | |||
| FAST / Fastenal Company | 1,02 | 93,95 | 0,04 | 5,00 | 4,7052 | 0,1801 | |||
| VRSK / Verisk Analytics, Inc. | 0,13 | −3,73 | 0,04 | 0,00 | 4,4800 | −0,0119 | |||
| ABT / Abbott Laboratories | 0,24 | 0,00 | 0,03 | 3,13 | 3,6391 | 0,0536 | |||
| COST / Costco Wholesale Corporation | 0,03 | −0,89 | 0,03 | 3,33 | 3,5158 | 0,0920 | |||
| JNJ / Johnson & Johnson | 0,20 | −0,72 | 0,03 | −9,09 | 3,3930 | −0,3555 | |||
| WCN / Waste Connections, Inc. | 0,16 | −0,11 | 0,03 | −6,45 | 3,2851 | −0,1828 | |||
| IDXX / IDEXX Laboratories, Inc. | 0,05 | 0,29 | 0,03 | 27,27 | 3,1029 | 0,6556 | |||
| ANSS / ANSYS, Inc. | 0,08 | −19,27 | 0,03 | −13,33 | 2,9611 | −0,3789 | |||
| A / Agilent Technologies, Inc. | 0,22 | 5,19 | 0,03 | 8,33 | 2,9109 | 0,1397 | |||
| PAYX / Paychex, Inc. | 0,18 | −0,51 | 0,03 | −3,70 | 2,8809 | −0,2217 | |||
| MA / Mastercard Incorporated | 0,04 | 0,83 | 0,03 | 4,17 | 2,7706 | 0,0629 | |||
| APH / Amphenol Corporation | 0,25 | −2,81 | 0,03 | 47,06 | 2,7563 | 0,8533 | |||
| ULTA / Ulta Beauty, Inc. | 0,05 | −0,13 | 0,02 | 27,78 | 2,5841 | 0,5361 | |||
| NDSN / Nordson Corporation | 0,10 | 7,58 | 0,02 | 15,79 | 2,4236 | 0,2821 | |||
| BRK.A / Berkshire Hathaway Inc. | 0,00 | 0,00 | 0,02 | −8,70 | 2,4027 | −0,2565 | |||
| GOOG / Alphabet Inc. | 0,11 | 0,31 | 0,02 | 18,75 | 2,1134 | 0,2388 | |||
| STE / STERIS plc | 0,08 | 19,30 | 0,02 | 26,67 | 2,0993 | 0,4220 | |||
| 0K10 / Mettler-Toledo International Inc. | 0,01 | 0,26 | 0,02 | 0,00 | 1,7414 | −0,0225 | |||
| IEX / IDEX Corporation | 0,09 | 7,35 | 0,02 | 7,14 | 1,6928 | 0,0508 | |||
| ABBV / AbbVie Inc. | 0,08 | 0,00 | 0,01 | −12,50 | 1,6143 | −0,2266 | |||
| XOM / Exxon Mobil Corporation | 0,12 | 0,00 | 0,01 | −7,69 | 1,3826 | −0,1584 | |||
| PEP / PepsiCo, Inc. | 0,09 | −0,79 | 0,01 | −15,38 | 1,3119 | −0,2052 | |||
| KNX / Knight-Swift Transportation Holdings Inc. | 0,25 | −11,34 | 0,01 | −8,33 | 1,2276 | −0,1477 | |||
| WAT / Waters Corporation | 0,03 | 1,07 | 0,01 | 0,00 | 1,2175 | −0,0676 | |||
| MMM / 3M Company | 0,06 | −6,33 | 0,01 | 0,00 | 1,0327 | −0,0417 | |||
| ITW / Illinois Tool Works Inc. | 0,03 | 0,00 | 0,01 | 0,00 | 0,9505 | −0,0126 | |||
| ADBE / Adobe Inc. | 0,02 | 14,03 | 0,01 | 14,29 | 0,9396 | 0,1144 | |||
| LLY / Eli Lilly and Company | 0,01 | −3,13 | 0,01 | −11,11 | 0,9230 | −0,0969 | |||
| MSFT / Microsoft Corporation | 0,01 | 0,00 | 0,01 | 40,00 | 0,8128 | 0,1931 | |||
| AME / AMETEK, Inc. | 0,04 | 48,72 | 0,01 | 75,00 | 0,8098 | 0,2865 | |||
| PNC / The PNC Financial Services Group, Inc. | 0,04 | 0,00 | 0,01 | 16,67 | 0,7978 | 0,0379 | |||
| GJR / Strats Trust For Procter & Gambel Security - Preferred Security | 0,04 | −3,39 | 0,01 | 0,00 | 0,7770 | −0,0921 | |||
| ZTS / Zoetis Inc. | 0,04 | 13,24 | 0,01 | 0,00 | 0,6309 | 0,0367 | |||
| JPM / JPMorgan Chase & Co. | 0,02 | 0,00 | 0,01 | 25,00 | 0,6138 | 0,0891 | |||
| KO / The Coca-Cola Company | 0,07 | −0,18 | 0,01 | 0,00 | 0,5721 | −0,0141 | |||
| DCI / Donaldson Company, Inc. | 0,07 | −2,75 | 0,00 | 0,00 | 0,5387 | −0,0024 | |||
| KMX / CarMax, Inc. | 0,06 | −2,67 | 0,00 | 0,00 | 0,4528 | −0,0921 | |||
| MKC / McCormick & Company, Incorporated | 0,05 | 0,00 | 0,00 | −25,00 | 0,4332 | −0,0420 | |||
| APD / Air Products and Chemicals, Inc. | 0,01 | −3,64 | 0,00 | 0,00 | 0,3901 | −0,0375 | |||
| GGG / Graco Inc. | 0,04 | 0,37 | 0,00 | 0,00 | 0,3564 | 0,0080 | |||
| EXP / Eagle Materials Inc. | 0,01 | 0,00 | 0,3303 | 0,3303 | |||||
| AAPL / Apple Inc. | 0,01 | 0,00 | 0,00 | 0,00 | 0,3005 | −0,0283 | |||
| V / Visa Inc. | 0,01 | 0,00 | 0,00 | 0,00 | 0,2856 | 0,0009 | |||
| AOS / A. O. Smith Corporation | 0,04 | 66,53 | 0,00 | 100,00 | 0,2673 | 0,1056 | |||
| BFA / Brown-Forman Corp. - Class A | 0,09 | 0,00 | 0,00 | 0,00 | 0,2580 | −0,0597 | |||
| MRK / Merck & Co., Inc. | 0,03 | −0,12 | 0,00 | 0,00 | 0,2545 | −0,0374 | |||
| SYBT / Stock Yards Bancorp, Inc. | 0,03 | −1,26 | 0,00 | 100,00 | 0,2457 | 0,0259 | |||
| MDLZ / Mondelez International, Inc. | 0,03 | 0,00 | 0,00 | 0,00 | 0,2419 | −0,0040 | |||
| VNT / Vontier Corporation | 0,06 | 1,76 | 0,00 | 100,00 | 0,2346 | 0,0272 | |||
| ST / Sensata Technologies Holding plc | 0,07 | −5,48 | 0,00 | 100,00 | 0,2313 | 0,0320 | |||
| GE / General Electric Company | 0,01 | 0,00 | 0,00 | 0,00 | 0,2090 | 0,0448 | |||
| CINF / Cincinnati Financial Corporation | 0,01 | 0,00 | 0,00 | 0,00 | 0,2067 | −0,0005 | |||
| PGR / The Progressive Corporation | 0,01 | 0,00 | 0,00 | 0,00 | 0,2053 | −0,0146 | |||
| WAB / Westinghouse Air Brake Technologies Corporation | 0,01 | 0,00 | 0,00 | 0,00 | 0,1979 | 0,0247 | |||
| ADP / Automatic Data Processing, Inc. | 0,01 | 0,00 | 0,00 | 0,00 | 0,1862 | −0,0002 | |||
| PM / Philip Morris International Inc. | 0,01 | 0,00 | 0,00 | 0,00 | 0,1837 | 0,0220 | |||
| UNH / UnitedHealth Group Incorporated | 0,01 | 7,84 | 0,00 | −50,00 | 0,1791 | −0,1026 | |||
| CVX / Chevron Corporation | 0,01 | 0,00 | 0,00 | 0,00 | 0,1755 | −0,0317 | |||
| BFB / Brown-Forman Corp. - Class B | 0,05 | 0,00 | 0,00 | 0,00 | 0,1570 | −0,0431 | |||
| DOV / Dover Corporation | 0,01 | 0,00 | 0,00 | 0,00 | 0,1510 | 0,0047 | |||
| HUBB / Hubbell Incorporated | 0,00 | −3,04 | 0,00 | 0,00 | 0,1430 | 0,0223 | |||
| KDP / Keurig Dr Pepper Inc. | 0,04 | −4,42 | 0,00 | 0,00 | 0,1375 | −0,0130 | |||
| WSO.B / Watsco, Inc. | 0,00 | 1,10 | 0,00 | 0,00 | 0,1332 | −0,0200 | |||
| CLX / The Clorox Company | 0,01 | 0,00 | 0,00 | 0,00 | 0,1208 | −0,0288 | |||
| GEV / GE Vernova Inc. | 0,00 | 0,00 | 0,00 | 0,1046 | 0,0436 | ||||
| ENTG / Entegris, Inc. | 0,01 | 2,42 | 0,00 | 0,0940 | −0,0065 | ||||
| IBM / International Business Machines Corporation | 0,00 | 0,00 | 0,00 | 0,0934 | 0,0138 | ||||
| EMR / Emerson Electric Co. | 0,01 | −5,97 | 0,00 | 0,0923 | 0,0107 | ||||
| PFE / Pfizer Inc. | 0,03 | 0,00 | 0,00 | 0,0821 | −0,0045 | ||||
| DIS / The Walt Disney Company | 0,01 | −2,36 | 0,00 | 0,0763 | 0,0135 | ||||
| BDX / Becton, Dickinson and Company | 0,00 | 2,62 | 0,00 | 0,0741 | −0,0229 | ||||
| DE / Deere & Company | 0,00 | 0,00 | 0,00 | 0,0728 | 0,0049 | ||||
| GOOGL / Alphabet Inc. | 0,00 | 0,00 | 0,00 | 0,0722 | 0,0081 | ||||
| HSY / The Hershey Company | 0,00 | 0,00 | 0,00 | 0,0670 | −0,0027 | ||||
| BAC / Bank of America Corporation | 0,01 | 0,00 | 0,00 | 0,0623 | 0,0068 | ||||
| UNP / Union Pacific Corporation | 0,00 | 0,00 | 0,00 | 0,0569 | −0,0021 | ||||
| TNC / Tennant Company | 0,01 | 0,00 | 0,00 | 0,0515 | −0,0020 | ||||
| SLB / Schlumberger Limited | 0,01 | 0,00 | 0,00 | 0,0509 | −0,0127 | ||||
| CSX / CSX Corporation | 0,01 | 0,00 | 0,00 | 0,0501 | 0,0044 | ||||
| HUM / Humana Inc. | 0,00 | 0,00 | 0,00 | 0,0460 | −0,0042 | ||||
| ACN / Accenture plc | 0,00 | 12,86 | 0,00 | 0,0446 | 0,0029 | ||||
| INTC / Intel Corporation | 0,02 | 0,00 | 0,00 | 0,0432 | −0,0010 | ||||
| MO / Altria Group, Inc. | 0,01 | 0,00 | 0,00 | 0,0427 | −0,0014 | ||||
| SHW / The Sherwin-Williams Company | 0,00 | 0,00 | 0,00 | 0,0424 | −0,0012 | ||||
| CPRT / Copart, Inc. | 0,01 | 3,70 | 0,00 | 0,0409 | −0,0050 | ||||
| AMZN / Amazon.com, Inc. | 0,00 | 0,00 | 0,00 | 0,0378 | 0,0046 | ||||
| SOLV / Solventum Corporation | 0,00 | −35,27 | 0,00 | 0,0375 | −0,0211 | ||||
| HD / The Home Depot, Inc. | 0,00 | 0,00 | 0,00 | 0,0336 | −0,0003 | ||||
| BR / Broadridge Financial Solutions, Inc. | 0,00 | 0,00 | 0,00 | 0,0331 | −0,0002 | ||||
| SO / The Southern Company | 0,00 | 0,00 | 0,00 | 0,0296 | −0,0003 | ||||
| ECL / Ecolab Inc. | 0,00 | 0,00 | 0,00 | 0,0295 | 0,0015 | ||||
| DNP / DNP Select Income Fund Inc. | 0,03 | 0,00 | 0,00 | 0,0281 | −0,0005 | ||||
| GSCE / GS Connect S&P GSCI Enhanced Commodity Total Return ETN | 0,00 | 0,00 | 0,0273 | 0,0273 | |||||
| NEE / NextEra Energy, Inc. | 0,00 | 0,00 | 0,00 | 0,0262 | −0,0008 | ||||
| RGLD / Royal Gold, Inc. | 0,00 | 0,00 | 0,00 | 0,0254 | 0,0017 | ||||
| ORCL / Oracle Corporation | 0,00 | 0,00 | 0,0241 | 0,0241 | |||||
| TXN / Texas Instruments Incorporated | 0,00 | 0,00 | 0,0232 | 0,0232 | |||||
| TMO / Thermo Fisher Scientific Inc. | 0,00 | 0,00 | 0,00 | 0,0227 | −0,0055 | ||||
| BMY / Bristol-Myers Squibb Company | 0,00 | 0,00 | 0,00 | 0,0224 | −0,0074 | ||||
| JBHT / J.B. Hunt Transport Services, Inc. | 0,00 | −100,00 | 0,00 | 0,0000 | |||||
| TRN / Trinity Industries, Inc. | 0,00 | −100,00 | 0,00 | 0,0000 | |||||
| WBA / Walgreens Boots Alliance, Inc. | 0,00 | −100,00 | 0,00 | 0,0000 |