Grundläggande statistik
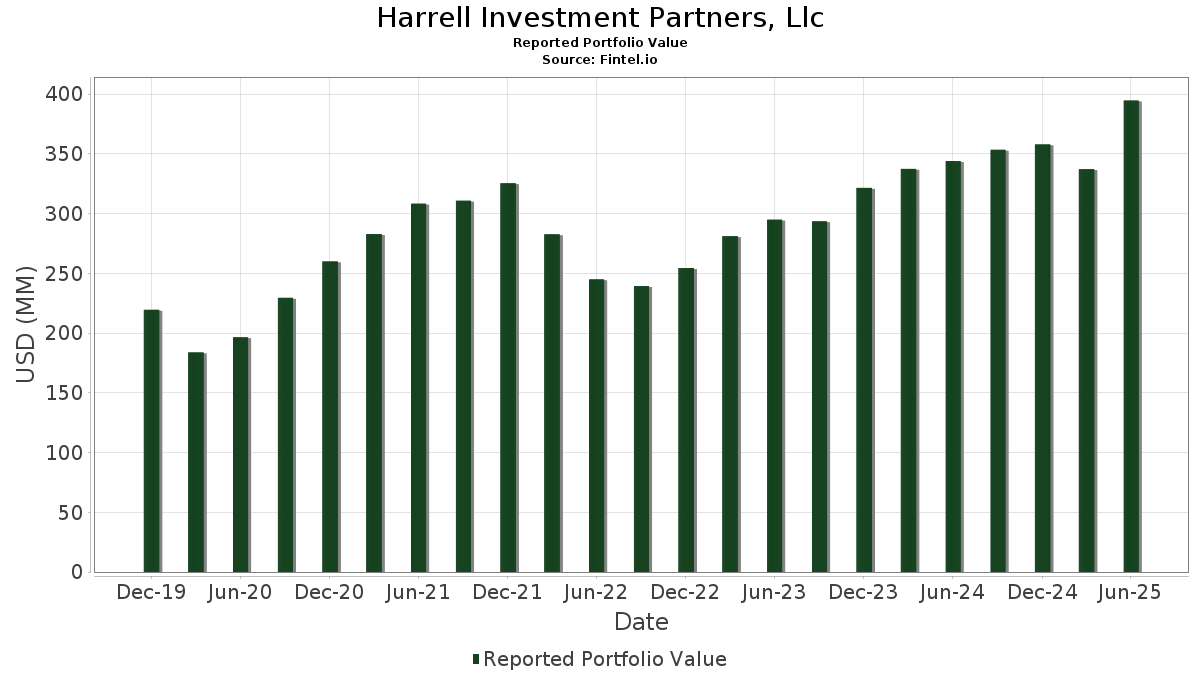
| Portföljvärde | $ 394 604 208 |
| Aktuella positioner | 124 |
Senaste innehav, resultat, förvaltat kapital (från 13F, 13D)
Harrell Investment Partners, Llc har redovisat 124 totala innehav i sina senaste SEC-arkiveringar. Det senaste portföljvärdet beräknas vara $ 394 604 208 USD. Faktiskt förvaltade tillgångar (AUM) är detta värde plus likvida medel (som inte redovisas). Harrell Investment Partners, Llcs största innehav är Broadcom Inc. (US:AVGO) , NVIDIA Corporation (US:NVDA) , Apple Inc. (US:AAPL) , Microsoft Corporation (US:MSFT) , and JPMorgan Chase & Co. (US:JPM) . Harrell Investment Partners, Llcs nya positioner inkluderar Netflix, Inc. (US:NFLX) , Oracle Corporation (US:ORCL) , Vertex Pharmaceuticals Incorporated (US:VRTX) , Monster Beverage Corporation (US:MNST) , and Autodesk, Inc. (US:ADSK) .
Största ökningarna detta kvartal
Vi använder förändringen i portföljallokeringen eftersom det är det mest meningsfulla måttet. Förändringar kan bero på transaktioner eller förändringar i aktiekurser.
| Värdepapper | Aktier (MM) |
Värde (MM$) |
Portfölj % av | ΔPortfölj % av |
|---|---|---|---|---|
| 0,14 | 22,59 | 5,7250 | 2,9441 | |
| 0,11 | 29,19 | 7,3977 | 2,7577 | |
| 0,03 | 6,07 | 1,5381 | 1,4427 | |
| 0,00 | 5,43 | 1,3754 | 1,3754 | |
| 0,04 | 19,54 | 4,9530 | 1,0687 | |
| 0,01 | 4,66 | 1,1812 | 1,0179 | |
| 0,02 | 3,79 | 0,9611 | 0,9611 | |
| 0,01 | 2,91 | 0,7385 | 0,7385 | |
| 0,04 | 9,47 | 2,4000 | 0,6109 | |
| 0,01 | 8,37 | 2,1204 | 0,5642 |
Största minskningarna detta kvartal
Vi använder förändringen i portföljallokeringen eftersom det är det mest meningsfulla måttet. Förändringar kan bero på transaktioner eller förändringar i aktiepriser.
| Värdepapper | Aktier (MM) |
Värde (MM$) |
Portfölj % av | ΔPortfölj % av |
|---|---|---|---|---|
| 0,06 | 2,88 | 0,7302 | −2,3033 | |
| 0,03 | 4,04 | 1,0227 | −2,0326 | |
| 0,02 | 6,19 | 1,5687 | −1,5749 | |
| 0,00 | 0,30 | 0,0754 | −1,5082 | |
| 0,02 | 1,92 | 0,4860 | −1,3880 | |
| 0,01 | 3,36 | 0,8515 | −1,2622 | |
| 0,11 | 22,53 | 5,7097 | −1,2219 | |
| 0,01 | 2,62 | 0,6646 | −1,0784 | |
| 0,02 | 1,76 | 0,4471 | −0,9667 | |
| 0,04 | 3,97 | 1,0071 | −0,8009 |
13F- och fond arkiveringar
Denna blankett lämnades in den 2025-07-15 för rapporteringsperioden 2025-06-30. Klicka på länksymbolen för att se hela transaktionshistoriken.
Uppgradera för att låsa upp premiumdata och exportera till Excel![]() .
.
| Värdepapper | Typ | Genomsnittligt aktiepris | Aktier (MM) |
ΔAktier (%) |
ΔAktier (%) |
Värde ($MM) |
Portfölj (%) |
ΔPortfölj (%) |
|
|---|---|---|---|---|---|---|---|---|---|
| AVGO / Broadcom Inc. | 0,11 | 13,34 | 29,19 | 86,60 | 7,3977 | 2,7577 | |||
| NVDA / NVIDIA Corporation | 0,14 | 65,28 | 22,59 | 140,94 | 5,7250 | 2,9441 | |||
| AAPL / Apple Inc. | 0,11 | 4,37 | 22,53 | −3,60 | 5,7097 | −1,2219 | |||
| MSFT / Microsoft Corporation | 0,04 | 12,63 | 19,54 | 49,24 | 4,9530 | 1,0687 | |||
| JPM / JPMorgan Chase & Co. | 0,06 | 3,18 | 16,03 | 21,96 | 4,0611 | 0,1637 | |||
| MSI / Motorola Solutions, Inc. | 0,03 | 10,31 | 11,73 | 5,93 | 2,9728 | −0,3115 | |||
| WMT / Walmart Inc. | 0,12 | 11,59 | 11,43 | 24,28 | 2,8970 | 0,1690 | |||
| ETN / Eaton Corporation plc | 0,03 | 8,25 | 10,68 | 42,16 | 2,7075 | 0,4786 | |||
| AMZN / Amazon.com, Inc. | 0,04 | 36,15 | 9,47 | 57,00 | 2,4000 | 0,6109 | |||
| META / Meta Platforms, Inc. | 0,01 | 24,52 | 8,37 | 59,46 | 2,1204 | 0,5642 | |||
| HD / The Home Depot, Inc. | 0,02 | 3,55 | 7,90 | 3,58 | 2,0014 | −0,2598 | |||
| GOOGL / Alphabet Inc. | 0,04 | 0,06 | 7,53 | 14,03 | 1,9094 | −0,0503 | |||
| CME / CME Group Inc. | 0,02 | 13,33 | 6,69 | 17,75 | 1,6949 | 0,0102 | |||
| V / Visa Inc. | 0,02 | 22,43 | 6,35 | 24,03 | 1,6104 | 0,0909 | |||
| XLK / The Select Sector SPDR Trust - The Technology Select Sector SPDR Fund | 0,02 | −52,38 | 6,19 | −41,60 | 1,5687 | −1,5749 | |||
| CB / Chubb Limited | 0,02 | 11,07 | 6,11 | 6,55 | 1,5496 | −0,1524 | |||
| VTI / Vanguard Index Funds - Vanguard Total Stock Market ETF | 0,02 | 3,51 | 6,11 | 14,47 | 1,5483 | −0,0347 | |||
| ABBV / AbbVie Inc. | 0,03 | 2 028,84 | 6,07 | 1 790,65 | 1,5381 | 1,4427 | |||
| JNJ / Johnson & Johnson | 0,04 | 8,21 | 5,87 | −0,32 | 1,4864 | −0,2590 | |||
| MPC / Marathon Petroleum Corporation | 0,04 | 8,74 | 5,82 | 23,98 | 1,4743 | 0,0826 | |||
| DRI / Darden Restaurants, Inc. | 0,03 | 15,63 | 5,81 | 21,32 | 1,4712 | 0,0519 | |||
| SLAB / Silicon Laboratories Inc. | 0,04 | 0,00 | 5,76 | 30,93 | 1,4589 | 0,1546 | |||
| NFLX / Netflix, Inc. | 0,00 | 5,43 | 1,3754 | 1,3754 | |||||
| JCI / Johnson Controls International plc | 0,05 | 9,76 | 5,39 | 44,74 | 1,3660 | 0,2613 | |||
| TT / Trane Technologies plc | 0,01 | −31,19 | 5,07 | −10,68 | 1,2848 | −0,3985 | |||
| ADI / Analog Devices, Inc. | 0,02 | 10,54 | 4,93 | 30,47 | 1,2504 | 0,1287 | |||
| APD / Air Products and Chemicals, Inc. | 0,02 | 3,62 | 4,84 | −0,90 | 1,2262 | −0,2219 | |||
| O / Realty Income Corporation | 0,08 | 13,89 | 4,67 | 13,09 | 1,1824 | −0,0410 | |||
| TSLA / Tesla, Inc. | 0,01 | 590,49 | 4,66 | 747,27 | 1,1812 | 1,0179 | |||
| XOM / Exxon Mobil Corporation | 0,04 | 45,98 | 4,51 | 32,31 | 1,1428 | 0,1320 | |||
| XLV / The Select Sector SPDR Trust - The Health Care Select Sector SPDR Fund | 0,03 | −57,57 | 4,04 | −60,83 | 1,0227 | −2,0326 | |||
| FIS / Fidelity National Information Services, Inc. | 0,05 | 14,04 | 4,03 | 24,35 | 1,0223 | 0,0599 | |||
| XLC / The Select Sector SPDR Trust - The Communication Services Select Sector SPDR Fund | 0,04 | −42,07 | 3,97 | −34,83 | 1,0071 | −0,8009 | |||
| MDT / Medtronic plc | 0,04 | −0,39 | 3,89 | −3,36 | 0,9849 | −0,2080 | |||
| VZ / Verizon Communications Inc. | 0,09 | 4,22 | 3,83 | −0,60 | 0,9695 | −0,1718 | |||
| ORCL / Oracle Corporation | 0,02 | 3,79 | 0,9611 | 0,9611 | |||||
| UNP / Union Pacific Corporation | 0,02 | 10,18 | 3,58 | 7,28 | 0,9072 | −0,0822 | |||
| CRM / Salesforce, Inc. | 0,01 | 4,55 | 3,48 | 6,24 | 0,8808 | −0,0895 | |||
| UNH / UnitedHealth Group Incorporated | 0,01 | −20,85 | 3,36 | −52,85 | 0,8515 | −1,2622 | |||
| CMI / Cummins Inc. | 0,01 | 18,60 | 3,28 | 23,96 | 0,8312 | 0,0463 | |||
| PEG / Public Service Enterprise Group Incorporated | 0,04 | 19,41 | 3,09 | 22,12 | 0,7823 | 0,0327 | |||
| CMCSA / Comcast Corporation | 0,08 | −11,11 | 3,03 | −14,02 | 0,7676 | −0,2774 | |||
| ANET / Arista Networks Inc | 0,03 | 117,09 | 2,94 | 186,74 | 0,7457 | 0,4412 | |||
| BA / The Boeing Company | 0,01 | 2,91 | 0,7385 | 0,7385 | |||||
| XLF / The Select Sector SPDR Trust - The Financial Select Sector SPDR Fund | 0,06 | −73,21 | 2,88 | −71,83 | 0,7302 | −2,3033 | |||
| XLY / The Select Sector SPDR Trust - The Consumer Discretionary Select Sector SPDR Fund | 0,01 | −59,46 | 2,62 | −55,38 | 0,6646 | −1,0784 | |||
| GOOG / Alphabet Inc. | 0,01 | 160,00 | 2,60 | 195,11 | 0,6584 | 0,3974 | |||
| NEE / NextEra Energy, Inc. | 0,04 | 13,35 | 2,46 | 11,01 | 0,6236 | −0,0339 | |||
| TXN / Texas Instruments Incorporated | 0,01 | 28,03 | 2,11 | 47,90 | 0,5354 | 0,1118 | |||
| VRTX / Vertex Pharmaceuticals Incorporated | 0,00 | 1,94 | 0,4910 | 0,4910 | |||||
| XLP / The Select Sector SPDR Trust - The Consumer Staples Select Sector SPDR Fund | 0,02 | −69,39 | 1,92 | −69,66 | 0,4860 | −1,3880 | |||
| MNST / Monster Beverage Corporation | 0,03 | 1,90 | 0,4813 | 0,4813 | |||||
| BBY / Best Buy Co., Inc. | 0,03 | −17,71 | 1,89 | −24,97 | 0,4783 | −0,2676 | |||
| ADSK / Autodesk, Inc. | 0,01 | 1,84 | 0,4661 | 0,4661 | |||||
| IGV / iShares Trust - iShares Expanded Tech-Software Sector ETF | 0,02 | −69,92 | 1,76 | −62,99 | 0,4471 | −0,9667 | |||
| KO / The Coca-Cola Company | 0,02 | −12,41 | 1,76 | −13,45 | 0,4450 | −0,1569 | |||
| DIS / The Walt Disney Company | 0,01 | 1,67 | 0,4243 | 0,4243 | |||||
| SHOP / Shopify Inc. | 0,01 | 1,62 | 0,4114 | 0,4114 | |||||
| TJX / The TJX Companies, Inc. | 0,01 | −50,46 | 1,52 | −49,79 | 0,3856 | −0,5129 | |||
| CVX / Chevron Corporation | 0,01 | −27,30 | 1,44 | −37,80 | 0,3651 | −0,3215 | |||
| LRCX / Lam Research Corporation | 0,01 | 133,20 | 1,13 | 212,40 | 0,2876 | 0,1798 | |||
| NXPI / NXP Semiconductors N.V. | 0,01 | −60,28 | 1,13 | −54,34 | 0,2867 | −0,4481 | |||
| REGN / Regeneron Pharmaceuticals, Inc. | 0,00 | 1,06 | 0,2674 | 0,2674 | |||||
| SBUX / Starbucks Corporation | 0,01 | 1,02 | 0,2584 | 0,2584 | |||||
| ISRG / Intuitive Surgical, Inc. | 0,00 | 0,98 | 0,2483 | 0,2483 | |||||
| EPD / Enterprise Products Partners L.P. - Limited Partnership | 0,03 | 0,93 | 0,2363 | 0,2363 | |||||
| NVO / Novo Nordisk A/S - Depositary Receipt (Common Stock) | 0,01 | 0,92 | 0,2342 | 0,2342 | |||||
| ICE / Intercontinental Exchange, Inc. | 0,01 | −2,12 | 0,92 | 4,06 | 0,2341 | −0,0291 | |||
| PG / The Procter & Gamble Company | 0,01 | 33,20 | 0,87 | 24,50 | 0,2204 | 0,0133 | |||
| VEU / Vanguard International Equity Index Funds - Vanguard FTSE All-World ex-US ETF | 0,01 | −8,05 | 0,85 | 1,91 | 0,2165 | −0,0321 | |||
| SEIC / SEI Investments Company | 0,01 | 0,81 | 0,2057 | 0,2057 | |||||
| IVV / iShares Trust - iShares Core S&P 500 ETF | 0,00 | −7,93 | 0,80 | 1,65 | 0,2026 | −0,0305 | |||
| VST / Vistra Corp. | 0,00 | 0,79 | 0,2008 | 0,2008 | |||||
| COP / ConocoPhillips | 0,01 | 162,53 | 0,78 | 124,28 | 0,1968 | 0,0941 | |||
| QCOM / QUALCOMM Incorporated | 0,00 | 0,77 | 0,1949 | 0,1949 | |||||
| NVS / Novartis AG - Depositary Receipt (Common Stock) | 0,01 | 0,76 | 0,1926 | 0,1926 | |||||
| VFH / Vanguard World Fund - Vanguard Financials ETF | 0,01 | 0,75 | 0,1889 | 0,1889 | |||||
| FDS / FactSet Research Systems Inc. | 0,00 | 0,74 | 0,1874 | 0,1874 | |||||
| XSW / SPDR Series Trust - SPDR S&P Software & Services ETF | 0,00 | 0,70 | 0,1786 | 0,1786 | |||||
| DE / Deere & Company | 0,00 | 0,70 | 0,1778 | 0,1778 | |||||
| HCA / HCA Healthcare, Inc. | 0,00 | 176,26 | 0,70 | 206,17 | 0,1762 | 0,1088 | |||
| EXPD / Expeditors International of Washington, Inc. | 0,01 | 0,69 | 0,1752 | 0,1752 | |||||
| SCHB / Schwab Strategic Trust - Schwab U.S. Broad Market ETF | 0,03 | 0,69 | 0,1747 | 0,1747 | |||||
| TMO / Thermo Fisher Scientific Inc. | 0,00 | 0,69 | 0,1738 | 0,1738 | |||||
| PYPL / PayPal Holdings, Inc. | 0,01 | 0,67 | 0,1695 | 0,1695 | |||||
| SPY / SPDR S&P 500 ETF | 0,00 | 0,00 | 0,65 | 10,56 | 0,1645 | −0,0098 | |||
| RJF / Raymond James Financial, Inc. | 0,00 | 0,39 | 0,64 | 10,94 | 0,1620 | −0,0091 | |||
| T / AT&T Inc. | 0,02 | −23,53 | 0,60 | −21,82 | 0,1528 | −0,0757 | |||
| PLTR / Palantir Technologies Inc. | 0,00 | 0,23 | 0,60 | 62,06 | 0,1518 | 0,0420 | |||
| SHEL / Shell plc - Depositary Receipt (Common Stock) | 0,01 | −9,50 | 0,58 | −12,95 | 0,1465 | −0,0507 | |||
| YUM / Yum! Brands, Inc. | 0,00 | 0,56 | 0,1412 | 0,1412 | |||||
| SPGI / S&P Global Inc. | 0,00 | −78,63 | 0,56 | −77,81 | 0,1412 | −0,6035 | |||
| WDAY / Workday, Inc. | 0,00 | 0,54 | 0,1381 | 0,1381 | |||||
| WM / Waste Management, Inc. | 0,00 | 0,53 | 0,1344 | 0,1344 | |||||
| SQ / Block, Inc. | 0,01 | 0,53 | 0,1341 | 0,1341 | |||||
| INTC / Intel Corporation | 0,02 | 3,24 | 0,52 | 1,96 | 0,1316 | −0,0196 | |||
| VPL / Vanguard International Equity Index Funds - Vanguard FTSE Pacific ETF | 0,01 | −52,83 | 0,51 | −46,56 | 0,1299 | −0,1543 | |||
| AMAT / Applied Materials, Inc. | 0,00 | 62,24 | 0,49 | 105,02 | 0,1242 | 0,0532 | |||
| EEMA / iShares, Inc. - iShares MSCI Emerging Markets Asia ETF | 0,01 | 0,48 | 0,1212 | 0,1212 | |||||
| LLY / Eli Lilly and Company | 0,00 | −17,97 | 0,46 | −22,77 | 0,1163 | −0,0597 | |||
| NKE / NIKE, Inc. | 0,01 | 0,45 | 0,1147 | 0,1147 | |||||
| FI / Fiserv, Inc. | 0,00 | −80,46 | 0,43 | −84,77 | 0,1097 | −0,7315 | |||
| BRK.B / Berkshire Hathaway Inc. | 0,00 | 0,00 | 0,39 | −8,82 | 0,0997 | −0,0282 | |||
| MU / Micron Technology, Inc. | 0,00 | 0,38 | 0,0968 | 0,0968 | |||||
| ILMN / Illumina, Inc. | 0,00 | 0,37 | 0,0948 | 0,0948 | |||||
| BABA / Alibaba Group Holding Limited - Depositary Receipt (Common Stock) | 0,00 | 0,37 | 0,0931 | 0,0931 | |||||
| STEL / Stellar Bancorp, Inc. | 0,01 | 0,00 | 0,36 | 1,13 | 0,0910 | −0,0143 | |||
| CSCO / Cisco Systems, Inc. | 0,00 | 0,34 | 0,0860 | 0,0860 | |||||
| PSX / Phillips 66 | 0,00 | 63,27 | 0,32 | 57,71 | 0,0804 | 0,0207 | |||
| PM / Philip Morris International Inc. | 0,00 | −68,13 | 0,31 | −63,51 | 0,0782 | −0,1722 | |||
| ALL / The Allstate Corporation | 0,00 | −80,52 | 0,31 | −81,07 | 0,0779 | −0,4034 | |||
| MRK / Merck & Co., Inc. | 0,00 | −93,68 | 0,30 | −94,44 | 0,0754 | −1,5082 | |||
| HON / Honeywell International Inc. | 0,00 | 0,30 | 0,0750 | 0,0750 | |||||
| IVE / iShares Trust - iShares S&P 500 Value ETF | 0,00 | 29,21 | 0,29 | 33,02 | 0,0725 | 0,0085 | |||
| AZO / AutoZone, Inc. | 0,00 | 0,29 | 0,0724 | 0,0724 | |||||
| ELF / e.l.f. Beauty, Inc. | 0,00 | 0,27 | 0,0687 | 0,0687 | |||||
| GS / The Goldman Sachs Group, Inc. | 0,00 | 0,25 | 0,0623 | 0,0623 | |||||
| SAH / Sonic Automotive, Inc. | 0,00 | 0,24 | 0,0608 | 0,0608 | |||||
| AMD / Advanced Micro Devices, Inc. | 0,00 | −76,93 | 0,23 | −68,25 | 0,0580 | −0,1550 | |||
| TRGP / Targa Resources Corp. | 0,00 | −1,62 | 0,22 | −14,67 | 0,0561 | −0,0208 | |||
| VT / Vanguard International Equity Index Funds - Vanguard Total World Stock ETF | 0,00 | 0,22 | 0,0545 | 0,0545 | |||||
| MS / Morgan Stanley | 0,00 | 0,21 | 0,0528 | 0,0528 | |||||
| YUMC / Yum China Holdings, Inc. | 0,00 | 0,21 | 0,0520 | 0,0520 | |||||
| LPRO / Open Lending Corporation | 0,02 | 0,00 | 0,04 | −29,51 | 0,0110 | −0,0073 | |||
| DXCM / DexCom, Inc. | 0,00 | −100,00 | 0,00 | 0,0000 | |||||
| FANG / Diamondback Energy, Inc. | 0,00 | −100,00 | 0,00 | 0,0000 | |||||
| VCSA / Vacasa, Inc. | 0,00 | −100,00 | 0,00 | 0,0000 | |||||
| STE / STERIS plc | 0,00 | −100,00 | 0,00 | 0,0000 | |||||
| IQV / IQVIA Holdings Inc. | 0,00 | −100,00 | 0,00 | 0,0000 | |||||
| EW / Edwards Lifesciences Corporation | 0,00 | −100,00 | 0,00 | 0,0000 | |||||
| ABT / Abbott Laboratories | 0,00 | −100,00 | 0,00 | 0,0000 | |||||
| EL / The Estée Lauder Companies Inc. | 0,00 | −100,00 | 0,00 | 0,0000 | |||||
| AEP / American Electric Power Company, Inc. | 0,00 | −100,00 | 0,00 | 0,0000 | |||||
| SNPS / Synopsys, Inc. | 0,00 | −100,00 | 0,00 | −100,00 | −0,0661 | ||||
| PGR / The Progressive Corporation | 0,00 | −100,00 | 0,00 | 0,0000 | |||||
| CMG / Chipotle Mexican Grill, Inc. | 0,00 | −100,00 | 0,00 | 0,0000 | |||||
| AIG / American International Group, Inc. | 0,00 | −100,00 | 0,00 | 0,0000 | |||||
| LHX / L3Harris Technologies, Inc. | 0,00 | −100,00 | 0,00 | 0,0000 | |||||
| CDNS / Cadence Design Systems, Inc. | 0,00 | −100,00 | 0,00 | 0,0000 | |||||
| APH / Amphenol Corporation | 0,00 | −100,00 | 0,00 | 0,0000 |