Grundläggande statistik
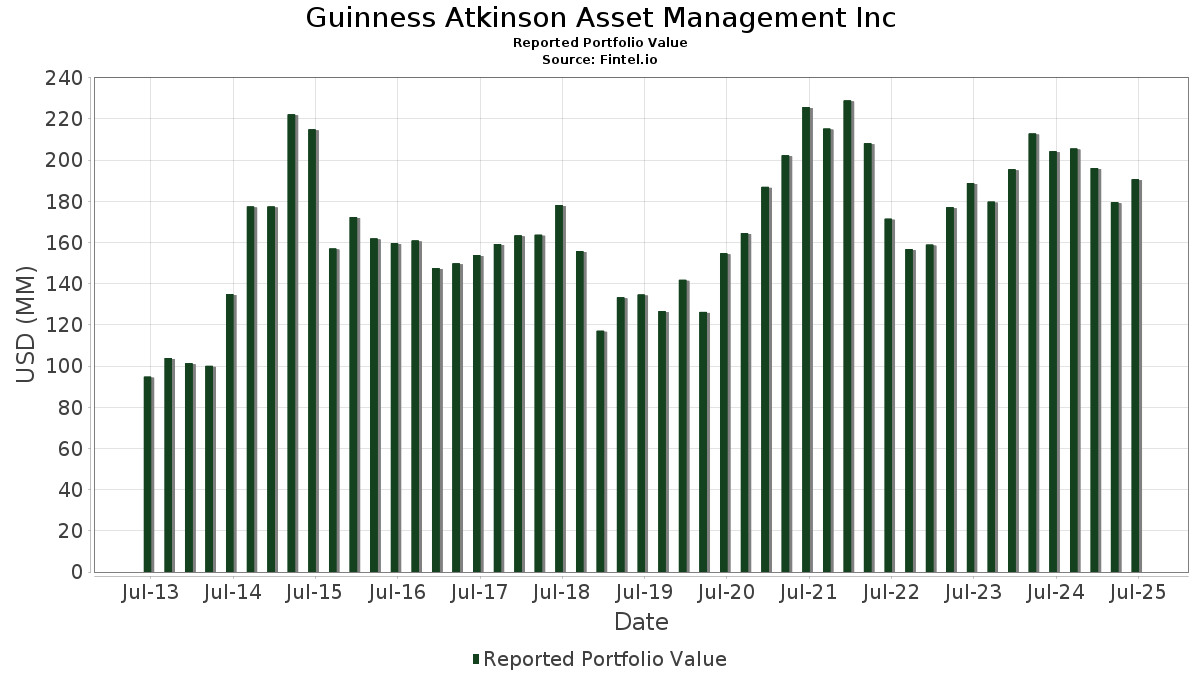
| Portföljvärde | $ 190 679 687 |
| Aktuella positioner | 84 |
Senaste innehav, resultat, förvaltat kapital (från 13F, 13D)
Guinness Atkinson Asset Management Inc har redovisat 84 totala innehav i sina senaste SEC-arkiveringar. Det senaste portföljvärdet beräknas vara $ 190 679 687 USD. Faktiskt förvaltade tillgångar (AUM) är detta värde plus likvida medel (som inte redovisas). Guinness Atkinson Asset Management Incs största innehav är Taiwan Semiconductor Manufacturing Company Limited - Depositary Receipt (Common Stock) (US:TSM) , Amphenol Corporation (US:APH) , NVIDIA Corporation (US:NVDA) , Netflix, Inc. (US:NFLX) , and Microsoft Corporation (US:MSFT) .
Största ökningarna detta kvartal
Vi använder förändringen i portföljallokeringen eftersom det är det mest meningsfulla måttet. Förändringar kan bero på transaktioner eller förändringar i aktiekurser.
| Värdepapper | Aktier (MM) |
Värde (MM$) |
Portfölj % av | ΔPortfölj % av |
|---|---|---|---|---|
| 0,04 | 9,78 | 5,1273 | 0,9055 | |
| 0,10 | 9,40 | 4,9291 | 0,9004 | |
| 0,05 | 8,40 | 4,4038 | 0,7711 | |
| 0,02 | 8,14 | 4,2669 | 0,6204 | |
| 0,07 | 6,76 | 3,5439 | 0,5096 | |
| 0,01 | 7,32 | 3,8389 | 0,4994 | |
| 0,01 | 8,33 | 4,3711 | 0,4493 | |
| 0,01 | 7,56 | 3,9654 | 0,4225 | |
| 0,01 | 7,63 | 3,9993 | 0,4196 | |
| 0,01 | 2,08 | 1,0893 | 0,2696 |
Största minskningarna detta kvartal
Vi använder förändringen i portföljallokeringen eftersom det är det mest meningsfulla måttet. Förändringar kan bero på transaktioner eller förändringar i aktiepriser.
| Värdepapper | Aktier (MM) |
Värde (MM$) |
Portfölj % av | ΔPortfölj % av |
|---|---|---|---|---|
| 0,01 | 4,19 | 2,1974 | −0,8937 | |
| 0,02 | 5,07 | 2,6573 | −0,6407 | |
| 0,01 | 5,74 | 3,0126 | −0,5790 | |
| 0,02 | 7,21 | 3,7793 | −0,4971 | |
| 0,01 | 7,34 | 3,8482 | −0,4545 | |
| 0,02 | 4,97 | 2,6062 | −0,3339 | |
| 0,01 | 4,66 | 2,4423 | −0,3330 | |
| 0,04 | 6,47 | 3,3918 | −0,3070 | |
| 0,04 | 7,21 | 3,7823 | −0,2944 | |
| 0,00 | 0,54 | 0,2855 | −0,2021 |
13F- och fond arkiveringar
Denna blankett lämnades in den 2025-08-01 för rapporteringsperioden 2025-06-30. Klicka på länksymbolen för att se hela transaktionshistoriken.
Uppgradera för att låsa upp premiumdata och exportera till Excel![]() .
.
| Värdepapper | Typ | Genomsnittligt aktiepris | Aktier (MM) |
ΔAktier (%) |
ΔAktier (%) |
Värde ($MM) |
Portfölj (%) |
ΔPortfölj (%) |
|
|---|---|---|---|---|---|---|---|---|---|
| TSM / Taiwan Semiconductor Manufacturing Company Limited - Depositary Receipt (Common Stock) | 0,04 | −5,45 | 9,78 | 29,01 | 5,1273 | 0,9055 | |||
| APH / Amphenol Corporation | 0,10 | −13,68 | 9,40 | 29,97 | 4,9291 | 0,9004 | |||
| NVDA / NVIDIA Corporation | 0,05 | −11,66 | 8,40 | 28,79 | 4,4038 | 0,7711 | |||
| NFLX / Netflix, Inc. | 0,01 | −17,55 | 8,33 | 18,40 | 4,3711 | 0,4493 | |||
| MSFT / Microsoft Corporation | 0,02 | −6,19 | 8,14 | 24,31 | 4,2669 | 0,6204 | |||
| META / Meta Platforms, Inc. | 0,01 | −7,33 | 7,63 | 18,68 | 3,9993 | 0,4196 | |||
| INTU / Intuit Inc. | 0,01 | −7,32 | 7,56 | 18,90 | 3,9654 | 0,4225 | |||
| MA / Mastercard Incorporated | 0,01 | −7,33 | 7,34 | −5,00 | 3,8482 | −0,4545 | |||
| FTXP / Foothills Exploration, Inc. | 0,01 | −7,33 | 7,32 | 22,11 | 3,8389 | 0,4994 | |||
| ICE / Intercontinental Exchange, Inc. | 0,04 | −7,34 | 7,21 | −1,44 | 3,7823 | −0,2944 | |||
| V / Visa Inc. | 0,02 | −7,34 | 7,21 | −6,12 | 3,7793 | −0,4971 | |||
| LRCX / Lam Research Corporation | 0,07 | −7,34 | 6,76 | 24,07 | 3,5439 | 0,5096 | |||
| AMZN / Amazon.com, Inc. | 0,03 | −7,33 | 6,69 | 6,85 | 3,5111 | 0,0206 | |||
| AME / AMETEK, Inc. | 0,04 | −7,34 | 6,47 | −2,59 | 3,3918 | −0,3070 | |||
| AMAT / Applied Materials, Inc. | 0,03 | −8,59 | 6,10 | 15,30 | 3,1984 | 0,2520 | |||
| GOOGL / Alphabet Inc. | 0,03 | −7,34 | 5,96 | 5,60 | 3,1245 | −0,0185 | |||
| ROP / Roper Technologies, Inc. | 0,01 | −7,33 | 5,74 | −10,90 | 3,0126 | −0,5790 | |||
| DHR / Danaher Corporation | 0,03 | 10,05 | 5,52 | 6,06 | 2,8935 | −0,0050 | |||
| AAPL / Apple Inc. | 0,02 | −7,34 | 5,07 | −14,41 | 2,6573 | −0,6407 | |||
| CRM / Salesforce, Inc. | 0,02 | −7,33 | 4,97 | −5,84 | 2,6062 | −0,3339 | |||
| ADBE / Adobe Inc. | 0,01 | −7,33 | 4,66 | −6,52 | 2,4423 | −0,3330 | |||
| TMO / Thermo Fisher Scientific Inc. | 0,01 | −7,33 | 4,19 | −24,48 | 2,1974 | −0,8937 | |||
| AVGO / Broadcom Inc. | 0,01 | −14,26 | 2,08 | 41,20 | 1,0893 | 0,2696 | |||
| NTES / NetEase, Inc. - Depositary Receipt (Common Stock) | 0,01 | −10,71 | 1,91 | 16,78 | 1,0041 | 0,0905 | |||
| AFL / Aflac Incorporated | 0,01 | 6,29 | 1,45 | 0,83 | 0,7621 | −0,0409 | |||
| MDLZ / Mondelez International, Inc. | 0,02 | 0,00 | 1,28 | −0,62 | 0,6730 | −0,0462 | |||
| TXN / Texas Instruments Incorporated | 0,01 | 0,00 | 1,28 | 15,61 | 0,6718 | 0,0541 | |||
| CME / CME Group Inc. | 0,00 | 0,00 | 1,28 | 3,90 | 0,6710 | −0,0151 | |||
| CSCO / Cisco Systems, Inc. | 0,02 | 0,00 | 1,24 | 12,45 | 0,6490 | 0,0358 | |||
| BLK / BlackRock, Inc. | 0,00 | 0,00 | 1,20 | 10,85 | 0,6268 | 0,0262 | |||
| KO / The Coca-Cola Company | 0,02 | 0,00 | 1,18 | −1,26 | 0,6187 | −0,0466 | |||
| EMR / Emerson Electric Co. | 0,01 | 0,00 | 1,18 | 21,59 | 0,6176 | 0,0781 | |||
| OTIS / Otis Worldwide Corporation | 0,01 | 0,00 | 1,15 | −4,02 | 0,6017 | −0,0644 | |||
| AJG / Arthur J. Gallagher & Co. | 0,00 | 0,00 | 1,11 | −7,28 | 0,5814 | −0,0847 | |||
| PAYX / Paychex, Inc. | 0,01 | 0,00 | 1,11 | −5,71 | 0,5802 | −0,0735 | |||
| JNJ / Johnson & Johnson | 0,01 | 0,00 | 1,10 | −7,87 | 0,5776 | −0,0885 | |||
| ABBV / AbbVie Inc. | 0,01 | 0,00 | 1,10 | −11,41 | 0,5743 | −0,1143 | |||
| ITW / Illinois Tool Works Inc. | 0,00 | 0,00 | 1,07 | −0,28 | 0,5634 | −0,0369 | |||
| PG / The Procter & Gamble Company | 0,01 | 0,00 | 1,06 | −6,51 | 0,5578 | −0,0760 | |||
| JD / JD.com, Inc. - Depositary Receipt (Common Stock) | 0,03 | 0,00 | 1,06 | −20,63 | 0,5553 | −0,1878 | |||
| PEP / PepsiCo, Inc. | 0,01 | 0,00 | 1,02 | −11,97 | 0,5362 | −0,1106 | |||
| BIDU / Baidu, Inc. - Depositary Receipt (Common Stock) | 0,01 | 0,00 | 1,02 | −6,84 | 0,5357 | −0,0750 | |||
| HUBB / Hubbell Incorporated | 0,00 | −9,28 | 0,91 | 11,99 | 0,4753 | 0,0244 | |||
| NEE / NextEra Energy, Inc. | 0,01 | −13,08 | 0,83 | −14,89 | 0,4351 | −0,1079 | |||
| ITRI / Itron, Inc. | 0,01 | −17,83 | 0,77 | 3,20 | 0,4057 | −0,0117 | |||
| ORA / Ormat Technologies, Inc. | 0,01 | −13,72 | 0,73 | 2,11 | 0,3817 | −0,0154 | |||
| ON / ON Semiconductor Corporation | 0,01 | −8,79 | 0,65 | 17,41 | 0,3433 | 0,0329 | |||
| FSLR / First Solar, Inc. | 0,00 | −9,58 | 0,56 | 18,32 | 0,2951 | 0,0303 | |||
| BABA / Alibaba Group Holding Limited - Depositary Receipt (Common Stock) | 0,00 | −27,48 | 0,54 | −37,83 | 0,2855 | −0,2021 | |||
| CSL / Carlisle Companies Incorporated | 0,00 | −7,47 | 0,53 | 1,54 | 0,2765 | −0,0130 | |||
| CVX / Chevron Corporation | 0,00 | 0,00 | 0,52 | −14,38 | 0,2720 | −0,0656 | |||
| XOM / Exxon Mobil Corporation | 0,00 | 0,00 | 0,51 | −9,30 | 0,2661 | −0,0457 | |||
| IBP / Installed Building Products, Inc. | 0,00 | −8,33 | 0,50 | −3,46 | 0,2634 | −0,0268 | |||
| OC / Owens Corning | 0,00 | −8,36 | 0,45 | −11,87 | 0,2379 | −0,0485 | |||
| KMI / Kinder Morgan, Inc. | 0,01 | 0,00 | 0,43 | 3,11 | 0,2261 | −0,0070 | |||
| IMO / Imperial Oil Limited | 0,01 | 0,00 | 0,43 | 9,77 | 0,2244 | 0,0076 | |||
| VLO / Valero Energy Corporation | 0,00 | 0,00 | 0,40 | 1,77 | 0,2118 | −0,0093 | |||
| SU / Suncor Energy Inc. | 0,01 | 0,00 | 0,40 | −3,13 | 0,2110 | −0,0207 | |||
| COP / ConocoPhillips | 0,00 | 0,00 | 0,39 | −14,60 | 0,2029 | −0,0493 | |||
| ENB / Enbridge Inc. | 0,01 | 0,00 | 0,37 | 2,21 | 0,1944 | −0,0075 | |||
| PWR / Quanta Services, Inc. | 0,00 | −14,26 | 0,35 | 27,54 | 0,1848 | 0,0309 | |||
| EOG / EOG Resources, Inc. | 0,00 | 0,00 | 0,35 | −6,70 | 0,1829 | −0,0254 | |||
| CNQ / Canadian Natural Resources Limited | 0,01 | 0,00 | 0,35 | 2,37 | 0,1809 | −0,0073 | |||
| QCOM / QUALCOMM Incorporated | 0,00 | 58,36 | 0,34 | 64,56 | 0,1779 | 0,0628 | |||
| ATHM / Autohome Inc. - Depositary Receipt (Common Stock) | 0,01 | 0,00 | 0,32 | −6,76 | 0,1664 | −0,0236 | |||
| FANG / Diamondback Energy, Inc. | 0,00 | 0,00 | 0,28 | −14,02 | 0,1481 | −0,0350 | |||
| TSLA / Tesla, Inc. | 0,00 | −14,26 | 0,28 | 4,91 | 0,1463 | −0,0016 | |||
| GOOG / Alphabet Inc. | 0,00 | −14,29 | 0,27 | −2,51 | 0,1429 | −0,0131 | |||
| CSIQ / Canadian Solar Inc. | 0,02 | −19,64 | 0,27 | 2,71 | 0,1390 | −0,0050 | |||
| SLB / Schlumberger Limited | 0,01 | 0,00 | 0,26 | −19,24 | 0,1345 | −0,0422 | |||
| CVE / Cenovus Energy Inc. | 0,02 | 0,00 | 0,26 | −1,92 | 0,1338 | −0,0114 | |||
| BKR / Baker Hughes Company | 0,01 | 0,00 | 0,25 | −12,94 | 0,1310 | −0,0285 | |||
| ADI / Analog Devices, Inc. | 0,00 | −14,29 | 0,24 | 1,24 | 0,1281 | −0,0064 | |||
| DVN / Devon Energy Corporation | 0,01 | 0,00 | 0,23 | −14,98 | 0,1194 | −0,0297 | |||
| AMRC / Ameresco, Inc. | 0,01 | −7,24 | 0,23 | 16,58 | 0,1183 | 0,0106 | |||
| HAL / Halliburton Company | 0,01 | 0,00 | 0,20 | −19,76 | 0,1048 | −0,0338 | |||
| ENPH / Enphase Energy, Inc. | 0,00 | −4,74 | 0,18 | −39,27 | 0,0969 | −0,0722 | |||
| DAN / Dana Incorporated | 0,01 | −14,29 | 0,17 | 10,46 | 0,0887 | 0,0033 | |||
| POWI / Power Integrations, Inc. | 0,00 | −14,29 | 0,14 | −5,30 | 0,0755 | −0,0090 | |||
| SWKS / Skyworks Solutions, Inc. | 0,00 | −14,29 | 0,12 | −0,82 | 0,0635 | −0,0048 | |||
| DAR / Darling Ingredients Inc. | 0,00 | −14,29 | 0,11 | 3,70 | 0,0592 | −0,0012 | |||
| THRM / Gentherm Incorporated | 0,00 | −68,91 | 0,10 | −67,12 | 0,0504 | −0,1123 | |||
| MBLY / Mobileye Global Inc. | 0,01 | −14,29 | 0,09 | 6,90 | 0,0492 | 0,0004 | |||
| HLX / Helix Energy Solutions Group, Inc. | 0,01 | 0,00 | 0,06 | −25,93 | 0,0319 | −0,0132 | |||
| SEDG / SolarEdge Technologies, Inc. | 0,00 | −100,00 | 0,00 | 0,0000 |