Grundläggande statistik
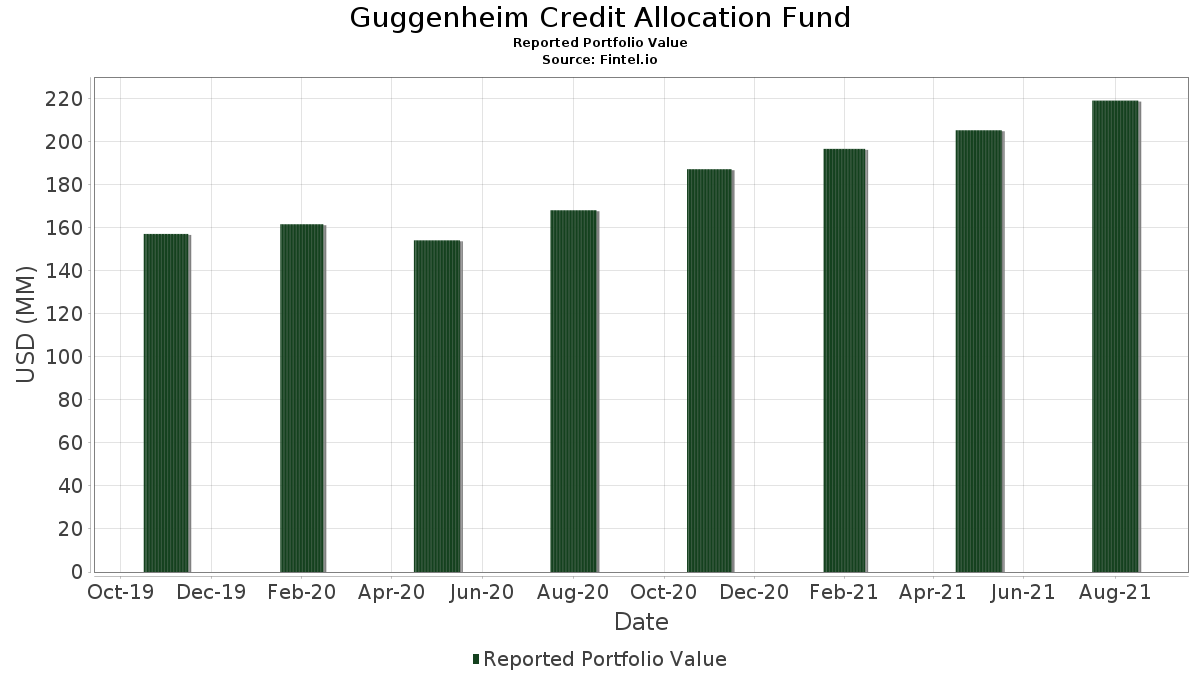
| Portföljvärde | $ 218 917 678 |
| Aktuella positioner | 422 |
Senaste innehav, resultat, förvaltat kapital (från 13F, 13D)
Guggenheim Credit Allocation Fund har redovisat 422 totala innehav i sina senaste SEC-arkiveringar. Det senaste portföljvärdet beräknas vara $ 218 917 678 USD. Faktiskt förvaltade tillgångar (AUM) är detta värde plus likvida medel (som inte redovisas). Guggenheim Credit Allocation Funds största innehav är FAGE International SA / FAGE USA Dairy Industry Inc (LU:US30257WAA45) , KeHE Distributors LLC / KeHE Finance Corp. (US:US487526AB19) , LBC Tank Terminals Holding Netherlands BV (NL:LBCN40) , Cengage Learning, Inc. (US:US15137NAA19) , and Accuride Corp. (US:US00439CBC73) . Guggenheim Credit Allocation Funds nya positioner inkluderar FAGE International SA / FAGE USA Dairy Industry Inc (LU:US30257WAA45) , KeHE Distributors LLC / KeHE Finance Corp. (US:US487526AB19) , LBC Tank Terminals Holding Netherlands BV (NL:LBCN40) , Cengage Learning, Inc. (US:US15137NAA19) , and Accuride Corp. (US:US00439CBC73) .
Största ökningarna detta kvartal
Vi använder förändringen i portföljallokeringen eftersom det är det mest meningsfulla måttet. Förändringar kan bero på transaktioner eller förändringar i aktiekurser.
| Värdepapper | Aktier (MM) |
Värde (MM$) |
Portfölj % av | ΔPortfölj % av |
|---|---|---|---|---|
| 3,09 | 1,4545 | 1,4545 | ||
| 3,08 | 1,4451 | 1,4451 | ||
| 2,42 | 1,1370 | 1,1370 | ||
| 2,04 | 0,9587 | 0,9587 | ||
| 1,72 | 0,8086 | 0,8086 | ||
| 1,65 | 0,7758 | 0,7758 | ||
| 2,03 | 0,9531 | 0,7348 | ||
| 1,49 | 0,7000 | 0,7000 | ||
| 1,41 | 0,6612 | 0,6612 | ||
| 1,20 | 0,5642 | 0,5642 |
Största minskningarna detta kvartal
Vi använder förändringen i portföljallokeringen eftersom det är det mest meningsfulla måttet. Förändringar kan bero på transaktioner eller förändringar i aktiepriser.
| Värdepapper | Aktier (MM) |
Värde (MM$) |
Portfölj % av | ΔPortfölj % av |
|---|---|---|---|---|
| −2,43 | −1,1406 | −3,0821 | ||
| −2,34 | −1,0994 | −3,0409 | ||
| −2,30 | −1,0811 | −3,0225 | ||
| −1,95 | −0,9175 | −2,8590 | ||
| −1,91 | −0,8993 | −2,8407 | ||
| −1,87 | −0,8786 | −2,8200 | ||
| −1,82 | −0,8565 | −2,7980 | ||
| −1,82 | −0,8549 | −2,7964 | ||
| −1,70 | −0,8003 | −2,7417 | ||
| −1,59 | −0,7496 | −2,6910 |
13F- och fond arkiveringar
Denna blankett lämnades in den 2021-10-27 för rapporteringsperioden 2021-08-31. Klicka på länksymbolen för att se hela transaktionshistoriken.
Uppgradera för att låsa upp premiumdata och exportera till Excel![]() .
.
| Värdepapper | Typ | Genomsnittligt aktiepris | Aktier (MM) |
ΔAktier (%) |
ΔAktier (%) |
Värde ($MM) |
Portfölj (%) |
ΔPortfölj (%) |
|
|---|---|---|---|---|---|---|---|---|---|
| NES Global Talent / LON (N/A) | 4,19 | 39,56 | 1,9700 | 0,0285 | |||||
| US30257WAA45 / FAGE International SA / FAGE USA Dairy Industry Inc | 4,12 | 14,17 | 1,9357 | 0,1125 | |||||
| US487526AB19 / KeHE Distributors LLC / KeHE Finance Corp. | 3,91 | −1,71 | 1,8378 | −0,1727 | |||||
| LBCN40 / LBC Tank Terminals Holding Netherlands BV | 3,74 | −0,21 | 1,7588 | −0,1364 | |||||
| US15137NAA19 / Cengage Learning, Inc. | 3,66 | 1,11 | 1,7191 | −0,1094 | |||||
| US00439CBC73 / Accuride Corp. | 3,51 | −0,14 | 1,6478 | −0,1269 | |||||
| US644274AG71 / New Enterprise Stone & Lime Co., Inc. | 3,42 | −0,23 | 1,6093 | −0,1252 | |||||
| US88033CAH25 / Teneo Holdings LLC | 3,40 | −39,25 | 1,5966 | −1,2300 | |||||
| BCLYF / Barclays PLC | 3,28 | −0,33 | 1,5421 | −0,1219 | |||||
| US88104UAC71 / Terraform Global Operating LLC | 3,16 | −0,13 | 1,4867 | −0,1140 | |||||
| US73939VAA26 / POWERTEAM SERVICES LLC REGD 144A P/P 9.03300000 | 3,11 | −0,92 | 1,4633 | −0,1247 | |||||
| US57767XAB64 / Mav Acquisition Corp. | 3,09 | 1,4545 | 1,4545 | ||||||
| US47232MAF95 / Jefferies Finance LLC | 3,08 | 1,4451 | 1,4451 | ||||||
| US398545AA16 / GRINDING MEDIA INC / MOLY-COP ALTASTEEL LTD 7.375% 12/15/2023 144A | 2,99 | −0,53 | 1,4060 | −0,1139 | |||||
| BHI Investments LLC / LON (N/A) | 2,95 | −1,86 | 1,3852 | −0,5563 | |||||
| US65342RAD26 / NFP Corp | 2,92 | −0,71 | 1,3746 | −0,1141 | |||||
| US445587AE85 / HUNTCO 5 1/4 04/15/29 | 2,92 | 8,20 | 1,3702 | 0,0086 | |||||
| US78489JAD63 / SIWF HOLDINGS INC | 2,90 | 0,38 | 1,3636 | −0,0975 | |||||
| US12598FAA75 / CPI CG Inc | 2,84 | 4,38 | 1,3329 | −0,0403 | |||||
| US185401AG14 / Cleaver-Brooks, Inc. | 2,72 | −1,49 | 1,2760 | −0,1169 | |||||
| US864486AK16 / Suburban Propane Partners Limited Partnership/Suburban Energy Finance Corp. | 2,71 | 0,11 | 1,2754 | −0,0945 | |||||
| US81220HAC07 / SeaPort Financing LLC | 2,48 | −0,28 | 1,1668 | −0,0913 | |||||
| NA Rail Hold Co. LLC / LON (N/A) | 2,47 | −17,82 | 1,1601 | −0,7814 | |||||
| US57767XAA81 / Mav Acquisition Corp | 2,42 | 1,1370 | 1,1370 | ||||||
| XAC9288BAC00 / 24-7 Intouch Inc 2018 Term Loan | 2,38 | 1,15 | 1,1183 | −0,0708 | |||||
| BHC / Bausch Health Companies Inc. | 2,34 | 11,82 | 1,0986 | 0,0420 | |||||
| US16412EAA55 / Cheplapharm Arzneimittel GmbH | 2,30 | 26,31 | 1,0788 | 0,1603 | |||||
| US33941LAE65 / TVC Albany, Inc. 2018 2nd Lien Term Loan | 2,27 | 1,11 | 1,0669 | −0,0682 | |||||
| US67059TAH86 / NuStar Logistics LP | 2,24 | 0,99 | 1,0523 | −0,0684 | |||||
| US50076QAE61 / Kraft Heinz Foods Co | 2,18 | 8,67 | 1,0250 | 0,0103 | |||||
| US415864AM90 / Harsco Corp 5.75% 07/31/2027 144A | 2,07 | −0,96 | 0,9747 | −0,0836 | |||||
| US90320BAA70 / UPC Broadband Finco BV | 2,04 | 2,25 | 0,9597 | −0,0498 | |||||
| US45074JAA25 / ITT Holdings LLC | 2,04 | 0,9587 | 0,9587 | ||||||
| US37954FAJ30 / CORP. NOTE | 2,03 | 369,44 | 0,9531 | 0,7348 | |||||
| US98432UAE55 / Yak Access, LLC 2018 2nd Lien Term Loan B | 2,02 | −5,38 | 0,9499 | −0,1300 | |||||
| US144285AL72 / Carpenter Technology Corp | 2,00 | −0,94 | 0,9421 | −0,0807 | |||||
| US50212YAD67 / LPL Holdings Inc | 1,89 | 2,78 | 0,8865 | −0,0411 | |||||
| TexGen Power LLC / EC (N/A) | 0,05 | 1,88 | −37,36 | 0,8842 | −1,0572 | ||||
| US730481AJ74 / J.B. Poindexter & Co., Inc. | 1,87 | −0,11 | 0,8801 | −0,0675 | |||||
| US893647BK28 / TransDigm Inc | 1,87 | −1,00 | 0,8800 | −0,0758 | |||||
| US23166MAA18 / DTZ US BORROWER LLC 6.75% 05/15/2028 144A | 1,79 | 27,57 | 0,8397 | 0,1318 | |||||
| US76009NAL47 / Rent-A-Center Inc/TX | 1,78 | 79,68 | 0,8355 | 0,3353 | |||||
| US12008RAP29 / Builders FirstSource Inc | 1,72 | 0,8086 | 0,8086 | ||||||
| LILAPR / LCPR Senior Secured Financing DAC | 1,71 | −0,47 | 0,8036 | −0,0648 | |||||
| US13201FAU03 / Cambrex Corporation 2021 Term Loan | 1,68 | −44,22 | 0,7874 | −1,1541 | |||||
| US384311AA42 / GrafTech Finance Inc | 1,66 | 32,24 | 0,7790 | 0,1454 | |||||
| US04683P1003 / ATD New Holdings Inc | 0,02 | 0,00 | 1,65 | 41,13 | 0,7778 | 0,1852 | |||
| US83600GAA22 / Sotheby's | 1,65 | 0,7758 | 0,7758 | ||||||
| US737446AR57 / Post Holdings, Inc. | 1,64 | −10,39 | 0,7704 | −0,1541 | |||||
| US97263CAA99 / Wilton RE Ltd. | 1,64 | 1,43 | 0,7685 | −0,0467 | |||||
| US632347AC40 / Nathan's Famous, Inc. | 1,63 | −0,24 | 0,7671 | −0,0597 | |||||
| US46284VAL53 / Iron Mountain Inc | 1,63 | 2,20 | 0,7656 | −0,0401 | |||||
| US12662PAD06 / CVR Energy Inc | 1,63 | 66,73 | 0,7656 | 0,2716 | |||||
| US103304BS93 / Boyd Gaming Corp | 1,63 | −1,39 | 0,7647 | −0,0692 | |||||
| US913229AA80 / United Wholesale Mortgage LLC | 1,59 | −0,75 | 0,7484 | −0,0626 | |||||
| US835898AH05 / SOTHEBYS 7.375% 10/15/2027 144A | 1,59 | −0,81 | 0,7475 | −0,0631 | |||||
| US59921PAB22 / MILEAGE PLUS HOLDINGS LLC | 1,59 | −0,56 | 0,7472 | −0,0613 | |||||
| US78573NAF96 / Sabre GLBL Inc | 1,59 | −1,86 | 0,7455 | −0,0714 | |||||
| Alexander Mann / LON (N/A) | 1,52 | −49,48 | 0,7130 | −1,2284 | |||||
| US489399AN56 / Kennedy-Wilson Inc | 1,49 | 0,7000 | 0,7000 | ||||||
| SP PF Buyer LLC / LON (N/A) | 1,47 | −50,92 | 0,6930 | −1,2484 | |||||
| US644274AF98 / New Enterprise Stone & Lime Co 6.25% 03/15/2026 144A | 1,46 | 26,42 | 0,6881 | 0,1025 | |||||
| US527298BS18 / Level 3 Financing Inc | 1,46 | 0,97 | 0,6841 | −0,0446 | |||||
| US45569LAC54 / INDIGO NATURAL RESOURCES LLC 5.375% 02/01/2029 144A | 1,45 | 2,99 | 0,6793 | −0,0302 | |||||
| US603158AA41 / Minerals Technologies Inc | 1,41 | 0,71 | 0,6646 | −0,0450 | |||||
| US02156LAA98 / Altice France SA/France | 1,41 | −0,35 | 0,6636 | −0,0525 | |||||
| US227046AB51 / Crocs Inc | 1,41 | 0,6612 | 0,6612 | ||||||
| US390607AF62 / GREAT LAKES DRDG and DOCK CORP NEW 5.25% 06/01/2029 144A | 1,39 | 1,31 | 0,6551 | −0,0400 | |||||
| US69888XAA72 / Par Pharmaceutical, Inc. | 1,36 | −0,73 | 0,6376 | −0,0532 | |||||
| US73900LAA98 / POWDR CORP 6% 08/01/2025 144A | 1,35 | 327,30 | 0,6329 | 0,4733 | |||||
| US432833AN19 / HILTON DOMESTIC OPERATING CO INC 3.625% 02/15/2032 144A | 1,34 | 1,67 | 0,6313 | −0,0364 | |||||
| US02156LAF85 / Altice France SA/France | 1,34 | 1,98 | 0,6296 | −0,0344 | |||||
| US70137WAG33 / Parkland Corp/Canada | 1,33 | 7,16 | 0,6262 | −0,0022 | |||||
| US92047WAG69 / Valvoline Inc | 1,32 | 2,41 | 0,6196 | −0,0313 | |||||
| US44541FAC41 / PANDA HUMMEL STATION TLB1 1L 10/27/2022 | 1,30 | −2,11 | 0,6103 | −0,0603 | |||||
| Barentz Midco BV / LON (N/A) | 1,29 | −56,94 | 0,6079 | −1,3336 | |||||
| US85172FAN96 / Springleaf Finance Corp Bond | 1,28 | 0,31 | 0,6036 | −0,0434 | |||||
| US65409QBK76 / NIELSEN FINANCE LLC/ FIN CO 4.75% 07/15/2031 144A | 1,28 | −1,16 | 0,6032 | −0,0531 | |||||
| JPM.PRK / JPMorgan Chase & Co. - Preferred Stock | 0,05 | 0,00 | 1,28 | 0,95 | 0,6015 | −0,0392 | |||
| US1248EPCL57 / CCO Holdings LLC / CCO Holdings Capital Corp | 1,27 | 3,60 | 0,5956 | −0,0227 | |||||
| WFC.PRC / Wells Fargo & Company - Preferred Stock | 0,05 | 0,00 | 1,27 | 1,12 | 0,5950 | −0,0380 | |||
| US929566AJ62 / Wabash National Corp. | 1,27 | −1,48 | 0,5948 | −0,0543 | |||||
| AEL.PRA / American National Group Inc. - Preferred Stock | 0,05 | 0,00 | 1,26 | −0,08 | 0,5943 | −0,0453 | |||
| TPGS / Vacasa Inc - Class A | 0,13 | 0,00 | 1,26 | 0,96 | 0,5904 | −0,0388 | |||
| Alexander Mann / LON (N/A) | 1,25 | −58,31 | 0,5888 | −1,3527 | |||||
| US92858RAA86 / Vmed O2 UK Financing I PLC | 1,23 | 3,79 | 0,5786 | −0,0210 | |||||
| US103186AB88 / BOXER PARENT CO INC REGD 144A P/P 7.12500000 | 1,23 | −0,16 | 0,5785 | −0,0449 | |||||
| LBTY.A / Liberty Global Ltd. | 1,22 | 1,67 | 0,5720 | −0,0329 | |||||
| US30227KAE91 / Exterran Energy Solutions LP / EES Finance Corp | 1,22 | −0,41 | 0,5710 | −0,0457 | |||||
| US443201AB48 / Howmet Aerospace Inc | 1,20 | 0,5642 | 0,5642 | ||||||
| BRE/Everbright M6 Borrower LLC / LON (N/A) | 1,19 | −60,24 | 0,5611 | −1,3803 | |||||
| US29384FAD33 / Entrans International, LLC 2018 Term Loan | 1,19 | −4,74 | 0,5574 | −0,0723 | |||||
| US43734LAA44 / Home Point Capital Inc | 1,17 | 5,32 | 0,5488 | −0,0115 | |||||
| US978097AG86 / WOLVERINE WORLD WIDE REGD 144A P/P 4.00000000 | 1,17 | 0,5486 | 0,5486 | ||||||
| US69867DAC20 / Panther BF Aggregator 2 LP / Panther Finance Co Inc | 1,12 | −1,84 | 0,5268 | −0,0503 | |||||
| US988498AP63 / Yum! Brands Inc | 1,11 | 3,55 | 0,5213 | −0,0200 | |||||
| US90290MAC55 / US Foods Inc | 1,11 | −0,54 | 0,5200 | −0,0423 | |||||
| US126307BD80 / CSC HOLDINGS LLC SR UNSECURED 144A 12/30 4.625 | 1,10 | 1,19 | 0,5184 | −0,0325 | |||||
| US019736AG29 / Allison Transmission Inc | 1,10 | 3,98 | 0,5163 | −0,0174 | |||||
| UNTC / Unit Corporation | 0,05 | 6,49 | 1,07 | 56,19 | 0,5043 | 0,1568 | |||
| US62886EAZ16 / NCR CORPORATION NEW 5.25% 10/01/2030 144A | 1,07 | 0,75 | 0,5034 | −0,0339 | |||||
| US853496AH04 / Standard Industries Inc/NJ | 1,06 | 1,25 | 0,4968 | −0,0308 | |||||
| US247361ZX93 / Delta Air Lines Inc | 1,05 | 0,48 | 0,4944 | −0,0345 | |||||
| US00109LAA17 / ADT Security Corp. | 1,05 | 0,4928 | 0,4928 | ||||||
| US18060TAA34 / Clarios Global LP | 1,05 | −11,04 | 0,4926 | −0,1029 | |||||
| US65409QBF81 / Nielsen Finance LLC / Nielsen Finance Co | 1,04 | −0,95 | 0,4903 | −0,0419 | |||||
| US031921AB57 / AmWINS Group Inc | 1,04 | 0,4895 | 0,4895 | ||||||
| US483007AJ91 / Kaiser Aluminum Corp 4.625% 03/01/2028 144A | 1,04 | −43,64 | 0,4876 | −0,4426 | |||||
| SUUIF / Superior Plus Corp. | 1,04 | 1,87 | 0,4870 | −0,0270 | |||||
| US89376VAA89 / TransMontaigne Partners Limited Partnership / TLP Finance Corp. | 1,02 | 0,4817 | 0,4817 | ||||||
| US74841CAB72 / Quicken Loans LLC / Quicken Loans Co-Issuer Inc | 1,02 | 4,61 | 0,4808 | −0,0132 | |||||
| JPM.PRM / JPMorgan Chase & Co. - Preferred Stock | 0,04 | 1,02 | 0,4796 | 0,4796 | |||||
| US22304LAA89 / Covey Park Energy LLC / Covey Park Finance Corp. | 1,00 | 0,00 | 0,4718 | −0,0356 | |||||
| US25536MAE12 / DiversiTech Holdings, Inc., Second Lien Term Loan | 1,00 | 0,00 | 0,4700 | −0,0354 | |||||
| US610333AY20 / Monroe Capital CLO Ltd. | 1,00 | 0,10 | 0,4691 | −0,0352 | |||||
| US74880TAE64 / Quirch Foods Holdings, LLC 2020 Term Loan | 1,00 | −0,50 | 0,4688 | −0,0379 | |||||
| McGraw Hill LLC / LON (N/A) | 0,99 | −66,97 | 0,4664 | −1,4750 | |||||
| / Arch Capital Group Ltd. | 0,04 | 0,99 | 0,4649 | 0,4649 | |||||
| US032177AJ66 / Amsted Industries Inc | 0,99 | 3,24 | 0,4643 | −0,0194 | |||||
| US50077LAB27 / Kraft Heinz Foods Co | 0,98 | 7,78 | 0,4627 | 0,0011 | |||||
| HAH Group Holding Co. LLC / LON (N/A) | 0,97 | −67,57 | 0,4582 | −1,4833 | |||||
| US41984LAA52 / Hawaiian Brand Intellectual Property Ltd / HawaiianMiles Loyalty Ltd | 0,97 | 46,69 | 0,4578 | 0,1222 | |||||
| KAHC / KKR Acquisition Holdings I Corp - Class A | 0,10 | 100,00 | 0,97 | 98,98 | 0,4567 | 0,2096 | |||
| US68246UAH77 / 1A Smart Start LLC | 0,97 | −0,41 | 0,4558 | −0,0362 | |||||
| US98262PAA93 / WW International, Inc. | 0,94 | 50,48 | 0,4414 | 0,1256 | |||||
| US70583GAW24 / Pelican Products, Inc. 2018 1st Lien Term Loan | 0,93 | 0,00 | 0,4369 | −0,0328 | |||||
| BAC.PRO / Bank of America Corporation - Preferred Stock | 0,04 | 0,00 | 0,91 | 2,47 | 0,4290 | −0,0208 | |||
| US03966VAB36 / Arconic Corp | 0,90 | −0,88 | 0,4229 | −0,0359 | |||||
| US82967NBM92 / Sirius XM Radio Inc | 0,89 | 0,4203 | 0,4203 | ||||||
| US72815LAA52 / Playtika Holding Corp | 0,88 | 2,44 | 0,4148 | −0,0208 | |||||
| US538034AV10 / Live Nation Entertainment Inc | 0,88 | −0,11 | 0,4145 | −0,0318 | |||||
| US84410HAC43 / Southern Veterinary Partners, LLC Term Loan | 0,88 | −0,68 | 0,4114 | −0,0572 | |||||
| US12541HAR49 / CHG Healthcare Services Inc. 2017 1st Lien Term Loan B | 0,87 | 0,00 | 0,4096 | −0,0310 | |||||
| US90290MAD39 / US FOODS INC 4.75% 02/15/2029 144A | 0,87 | 2,72 | 0,4090 | −0,0196 | |||||
| QSR / Restaurant Brands International Inc. | 0,86 | 0,4045 | 0,4045 | ||||||
| US489399AM73 / Kennedy-Wilson Inc | 0,86 | 1,78 | 0,4033 | −0,0231 | |||||
| US810186AT39 / Scotts Miracle-Gro Co. (The) | 0,85 | 1,55 | 0,4005 | −0,0237 | |||||
| US71677HAL96 / PetSmart, Inc., Term Loan B | 0,85 | 0,3998 | 0,3998 | ||||||
| US44157TAA34 / Houghton Mifflin Harcourt Publishers, Inc. | 0,85 | −0,35 | 0,3995 | −0,0320 | |||||
| US71360HAB33 / PERATON CORP | 0,85 | −0,35 | 0,3984 | −0,0316 | |||||
| US808513BJ38 / Charles Schwab Corp/The | 0,84 | 3,86 | 0,3928 | −0,0135 | |||||
| US008911BK48 / Air Canada | 0,83 | 0,3901 | 0,3901 | ||||||
| US45232TAA97 / Illuminate Buyer LLC / Illuminate Holdings IV Inc | 0,83 | −0,24 | 0,3895 | −0,0303 | |||||
| US864486AL98 / Suburban Propane Partners LP/Suburban Energy Finance Corp | 0,82 | 1,85 | 0,3872 | −0,0217 | |||||
| US62886EAV02 / NCR Corp. | 0,82 | 0,37 | 0,3842 | −0,0276 | |||||
| US92328MAB90 / Venture Global Calcasieu Pass LLC | 0,81 | 0,3824 | 0,3824 | ||||||
| US37954FAG90 / Global Partners LP / GLP Finance Corp | 0,81 | −1,71 | 0,3784 | −0,0358 | |||||
| US682691AC47 / OneMain Finance Corp | 0,80 | 0,3777 | 0,3777 | ||||||
| US00164VAF04 / AMC Networks Inc | 0,79 | 0,00 | 0,3732 | −0,0281 | |||||
| US29280BAA35 / Endo Luxembourg Finance Co I Sarl / Endo US Inc | 0,79 | 0,38 | 0,3722 | −0,0265 | |||||
| US02156LAE11 / Altice France SA/France | 0,78 | 1,69 | 0,3669 | −0,0209 | |||||
| US674599CF00 / Occidental Petroleum Corp | 0,78 | 17,58 | 0,3648 | 0,0309 | |||||
| US57763RAA59 / Mauser Packaging Solutions Holding Co. | 0,77 | 0,00 | 0,3639 | −0,0274 | |||||
| SCP Eye Care Services LLC / LON (N/A) | 0,77 | −74,53 | 0,3596 | −1,5819 | |||||
| FRC.PRK / First Republic Bank Depositary Shares, Each Representing a 1/40th Interest in a Share of 4.125% Nonc | 0,03 | 0,00 | 0,76 | 0,26 | 0,3573 | −0,0262 | |||
| US1248EPCP61 / CCO Holdings LLC / CCO Holdings Capital Corp | 0,76 | 0,3556 | 0,3556 | ||||||
| US00175PAB94 / AMN Healthcare, Inc. | 0,76 | 0,67 | 0,3552 | −0,0240 | |||||
| US71677KAA60 / PetSmart Inc / PetSmart Finance Corp | 0,75 | 0,53 | 0,3548 | −0,0247 | |||||
| COLI / Colicity Inc - Class A | 0,08 | 0,00 | 0,75 | −0,66 | 0,3524 | −0,0289 | |||
| US78573NAC65 / Sabre GLBL Inc | 0,75 | −1,45 | 0,3521 | −0,0323 | |||||
| Polaris Newco LLC / LON (N/A) | 0,75 | −75,06 | 0,3520 | −1,5894 | |||||
| VODPF / Vodafone Group Public Limited Company | 0,75 | 0,54 | 0,3509 | −0,0245 | |||||
| US50077LAZ94 / Kraft Heinz Foods Co | 0,75 | 8,13 | 0,3502 | 0,0018 | |||||
| QSR / Restaurant Brands International Inc. | 0,72 | 2,56 | 0,3388 | −0,0161 | |||||
| FI4000507876 / PHM Group Holding Oy | 0,72 | 0,3377 | 0,3377 | ||||||
| US810186AV84 / Scotts Miracle-Gro Co/The | 0,71 | 0,3336 | 0,3336 | ||||||
| US88033GDE70 / Tenet Healthcare Corp | 0,70 | −0,14 | 0,3269 | −0,0253 | |||||
| DXP Enterprises, Inc. / LON (N/A) | 0,69 | −76,89 | 0,3263 | −1,6152 | |||||
| US20451NAG60 / Compass Minerals International, Inc. | 0,69 | −1,29 | 0,3234 | −0,0289 | |||||
| US707569AV14 / Penn National Gaming Inc | 0,67 | 0,3168 | 0,3168 | ||||||
| US50201DAD57 / LCPR Senior Secured Financing DAC | 0,67 | 0,90 | 0,3162 | −0,0209 | |||||
| BAC.PRP / Bank of America Corporation - Preferred Stock | 0,03 | 0,00 | 0,67 | 2,14 | 0,3144 | −0,0163 | |||
| US92858RAB69 / Vmed O2 UK Financing I PLC | 0,67 | 0,3139 | 0,3139 | ||||||
| US12510CAA99 / CD&R Smokey Buyer Inc | 0,67 | −0,30 | 0,3127 | −0,0245 | |||||
| Franchise Group, Inc. / LON (N/A) | 0,65 | −78,22 | 0,3075 | −1,6339 | |||||
| First Brands Group LLC / LON (N/A) | 0,65 | −78,29 | 0,3066 | −1,6349 | |||||
| Tank Holdings Corp. / LON (N/A) | 0,65 | −78,35 | 0,3057 | −1,6358 | |||||
| US03960DAB91 / Arcline FM Holdings LLC | 0,64 | 0,3024 | 0,3024 | ||||||
| US82488HAC51 / SHO Holding I Corp. | 0,64 | 1,11 | 0,2992 | −0,0191 | |||||
| US48128B5497 / JPMORGAN CHASE and CO 4.625% PERP PFD | 0,02 | 0,00 | 0,63 | −0,48 | 0,2949 | −0,0234 | |||
| US91153LAA52 / United Shore Financial Services LLC | 0,63 | −41,31 | 0,2938 | −0,2445 | |||||
| US460919AB94 / Intertape Polymer Group Inc | 0,61 | 0,99 | 0,2877 | −0,0185 | |||||
| US81104BAC46 / ScribeAmerica Intermediate Holdco LLC (Healthchannels) | 0,59 | −1,00 | 0,2785 | −0,0237 | |||||
| US52473NAA63 / LEGENDS HOSPITALITY HOLDING CO LLC / LEGENDS HOSPITALITY CO-ISSUER INC 5% 02/01/2026 144A | 0,59 | −0,50 | 0,2783 | −0,0224 | |||||
| US50106GAF90 / Kronos Acquisition Holdings Inc / KIK Custom Products Inc | 0,59 | −56,68 | 0,2774 | −0,4111 | |||||
| Alterra Mountain Co. / LON (N/A) | 0,59 | −80,39 | 0,2772 | −1,6643 | |||||
| US527298BT90 / LEVEL 3 FINANCING INC 3.75% 07/15/2029 144A | 0,58 | 1,21 | 0,2749 | −0,0175 | |||||
| US038522AR99 / Aramark Services Inc | 0,58 | −0,34 | 0,2736 | −0,0217 | |||||
| XAC0553HAD26 / Avison Young (Canada), Inc. | 0,58 | −0,17 | 0,2731 | −0,0211 | |||||
| US143905AP21 / CSV 4 1/4 05/15/29 | 0,58 | 0,17 | 0,2707 | −0,0196 | |||||
| US97815UAH77 / Women's Care Holdings, Inc., LLC, First Lien Term Loan | 0,57 | −0,35 | 0,2690 | −0,0212 | |||||
| US50212YAF16 / LPL Holdings Inc | 0,57 | 3,45 | 0,2675 | −0,0105 | |||||
| US44332PAD33 / HUB International Ltd. | 0,57 | −0,18 | 0,2674 | −0,0207 | |||||
| US39303NAC56 / PANDA STONEWALL TERM B2 DD 11/13/21 | 0,56 | −4,24 | 0,2655 | −0,0326 | |||||
| DIRXX / Dreyfus Treasury Securities Cash Management - Dreyfus Treasury Securities Cash Management Institutional Shares | 0,55 | 6,15 | 0,55 | 6,18 | 0,2589 | −0,0034 | |||
| Provation Software Group, Inc. / LON (N/A) | 0,54 | −81,98 | 0,2546 | −1,6869 | |||||
| US483007AL48 / KAISER ALUMINUM CORP 4.5% 06/01/2031 144A | 0,52 | 1,97 | 0,2435 | −0,0136 | |||||
| Taxware Holdings (Sovos Compliance LLC) / LON (N/A) | 0,51 | −82,92 | 0,2412 | −1,7003 | |||||
| Drive Chassis (DCLI) / LON (N/A) | 0,51 | −83,18 | 0,2374 | −1,7041 | |||||
| National Mentor Holdings, Inc. / LON (N/A) | 0,50 | −83,22 | 0,2373 | −1,7042 | |||||
| US682691AA80 / OneMain Finance Corp | 0,50 | 3,73 | 0,2355 | −0,0091 | |||||
| US66981QAA40 / BRUNDAGE-BONE CONCRETE PUMPING HOLDINGS INC 6% 02/01/2026 144A | 0,50 | 74,30 | 0,2330 | 0,0892 | |||||
| AIZN / Assurant, Inc. - Corporate Bond/Note | 0,02 | 0,00 | 0,49 | 1,88 | 0,2292 | −0,0125 | |||
| SRNG / Soaring Eagle Acquisition Corp - Class A | 0,05 | 0,00 | 0,49 | 1,04 | 0,2286 | −0,0148 | |||
| US61647DAF96 / Moran Foods LLC | 0,48 | 3,71 | 0,2234 | −0,0085 | |||||
| US14856GAB68 / Castlelake Aircraft Structured Trust 2021-1 | 0,47 | 1,72 | 0,2230 | −0,0127 | |||||
| US53079EBL74 / Liberty Mutual Group, Inc. | 0,47 | 6,05 | 0,2227 | −0,0032 | |||||
| Pro Mach Group, Inc. / LON (N/A) | 0,47 | −84,25 | 0,2225 | −1,7190 | |||||
| US013817AK77 / Alcoa Inc 5.95% Notes 2/1/37 | 0,47 | 8,51 | 0,2223 | 0,0024 | |||||
| US67054KAA79 / Altice France SA/France | 0,47 | −0,21 | 0,2210 | −0,0171 | |||||
| US04621XAK46 / Assurant, Inc. | 0,47 | 1,96 | 0,2202 | −0,0121 | |||||
| Moran Foods LLC / LON (N/A) | 0,46 | −84,78 | 0,2149 | −1,7265 | |||||
| US39303NAB73 / Green Energy Partners/Stonewall LLC | 0,46 | −4,20 | 0,2146 | −0,0264 | |||||
| US15134NAF33 / BANK LOAN NOTE | 0,45 | 0,2120 | 0,2120 | ||||||
| US44541FAB67 / Hummel Station LLC Term Loan A | 0,45 | −3,23 | 0,2113 | −0,0235 | |||||
| US16280UAB61 / Checkers Drive-In Restaurants, Inc. | 0,45 | −0,44 | 0,2113 | −0,0169 | |||||
| Holding SOCOTEC / LON (N/A) | 0,45 | −85,05 | 0,2111 | −1,7304 | |||||
| US489399AL90 / KENNEDY-WILSON INC 4.75% 03/01/2029 | 0,44 | 0,46 | 0,2055 | −0,0146 | |||||
| US23345MAA53 / DT MIDSTREAM INC 4.125% 06/15/2029 144A | 0,44 | 1,87 | 0,2047 | −0,0111 | |||||
| US599191AA16 / Mileage Plus Holdings LLC / Mileage Plus Intellectual Property Assets Ltd | 0,43 | −0,69 | 0,2042 | −0,0171 | |||||
| US91879QAL32 / Vail Resorts Inc | 0,43 | 0,24 | 0,2003 | −0,0145 | |||||
| Balrog Acquisition, Inc. / LON (N/A) | 0,42 | −85,91 | 0,1992 | −1,7422 | |||||
| Gibson Brands, Inc. / LON (N/A) | 0,42 | −86,01 | 0,1977 | −1,7437 | |||||
| US75419TAA16 / Rattler Midstream LP | 0,42 | 0,96 | 0,1974 | −0,0129 | |||||
| US62886EBA55 / NCR Corp | 0,41 | 0,98 | 0,1949 | −0,0125 | |||||
| US153527AP10 / Central Garden & Pet Co | 0,41 | 1,25 | 0,1908 | −0,0121 | |||||
| US89473MAD48 / Treman Park CLO Ltd. | 0,39 | −0,51 | 0,1841 | −0,0147 | |||||
| US830867AB33 / Delta Air Lines Inc / SkyMiles IP Ltd | 0,39 | 1,83 | 0,1830 | −0,0103 | |||||
| US85172FAS83 / Springleaf Finance Corp | 0,38 | −0,52 | 0,1804 | −0,0144 | |||||
| US01883LAB99 / Alliant Holdings Intermediate LLC / Alliant Holdings Co-Issuer | 0,38 | 0,27 | 0,1767 | −0,0126 | |||||
| US83001WAC82 / Six Flags Theme Parks Inc | 0,37 | −0,53 | 0,1758 | −0,0144 | |||||
| PT Intermediate Holdings III LLC / LON (N/A) | 0,37 | −87,78 | 0,1727 | −1,7687 | |||||
| US71953LAA98 / Picasso Finance Sub Inc | 0,36 | −9,90 | 0,1715 | −0,0328 | |||||
| US039653AA89 / Arcosa Inc | 0,36 | 2,28 | 0,1690 | −0,0089 | |||||
| US09578EAB83 / Blue Nile, Inc. | 0,36 | 0,00 | 0,1685 | −0,0129 | |||||
| Blue Ribbon LLC / LON (N/A) | 0,35 | −88,21 | 0,1668 | −1,7747 | |||||
| US00771PAJ03 / AEGION CORPORATION TERM LOAN | 0,35 | 0,28 | 0,1657 | −0,0118 | |||||
| Permian Production Partners LLC / LON (N/A) | 0,34 | −88,54 | 0,1619 | −1,7796 | |||||
| US86614RAN70 / SUMMIT MATLS LLC / FIN CORP 5.25% 01/15/2029 144A | 0,34 | 0,58 | 0,1617 | −0,0116 | |||||
| US001877AA71 / APi Group DE Inc | 0,34 | 0,1612 | 0,1612 | ||||||
| US29275YAC66 / EnerSys | 0,34 | 1,49 | 0,1604 | −0,0095 | |||||
| US1248EPCN14 / CORPORATE BONDS | 0,34 | −80,23 | 0,1596 | −0,7072 | |||||
| US09951LAB99 / Booz Allen Hamilton Inc | 0,34 | 0,1583 | 0,1583 | ||||||
| RNR.PRG / RenaissanceRe Holdings Ltd. - Preferred Stock | 0,01 | 0,33 | 0,1552 | 0,1552 | |||||
| US78410GAE44 / SBA COMMUNICATIONS CORP 3.125% 02/01/2029 144A | 0,33 | −66,77 | 0,1538 | −0,3435 | |||||
| Apttus Corp. / LON (N/A) | 0,33 | −89,18 | 0,1530 | −1,7884 | |||||
| US57777YAB20 / MAVIS TIRE TERM 1LN 05/04/2028 | 0,32 | −0,31 | 0,1527 | −0,0119 | |||||
| US49387TAW62 / KIK CONSUMER TERM B 1LN 12/22/2026 | 0,32 | −1,87 | 0,1481 | −0,0143 | |||||
| US00175PAC77 / AMN Healthcare Inc | 0,31 | −46,26 | 0,1454 | −0,1452 | |||||
| US29273DAC48 / Endo Dac / Endo Finance LLC / Endo Finco Inc | 0,30 | −10,24 | 0,1404 | −0,0279 | |||||
| Ascend Performance Materials Operations LLC / LON (N/A) | 0,30 | −90,08 | 0,1403 | −1,8011 | |||||
| Syndigo LLC / LON (N/A) | 0,30 | −90,08 | 0,1403 | −1,8012 | |||||
| US74112BAM72 / Prestige Brands Inc | 0,30 | 2,78 | 0,1392 | −0,0063 | |||||
| US14314VAB99 / HAMILTON TERM B 1LN 06/11/2027 | 0,30 | −1,01 | 0,1390 | −0,0117 | |||||
| Eisner Advisory Group / LON (N/A) | 0,29 | −90,24 | 0,1380 | −1,8035 | |||||
| US90350DAF50 / U.S. Farathane, LLC 2021 Term Loan B | 0,29 | 0,1349 | 0,1349 | ||||||
| ACRO.U / Acropolis Infrastructure Acquisition Corp. Units, each consisting of one share of Class A Common Sto | 0,03 | 0,29 | 0,1343 | 0,1343 | |||||
| US90932LAH06 / United Airlines Inc | 0,29 | 0,35 | 0,1341 | −0,0095 | |||||
| CA86828QAK72 / Superior Plus, LP | 0,28 | −2,74 | 0,1338 | −0,0142 | |||||
| US047649AA63 / Atkore Inc | 0,28 | 4,41 | 0,1336 | −0,0042 | |||||
| US37959E3009 / Globe Life, Inc., 4.25% | 0,01 | 0,28 | 0,1333 | 0,1333 | |||||
| US76009WAV28 / Rent-A-Center Inc/TX | 0,28 | 0,1294 | 0,1294 | ||||||
| US26244LAA26 / Dryden 41 Senior Loan Fund | 0,27 | −6,85 | 0,1280 | −0,0198 | |||||
| US988498AM33 / Yum! Brands Inc | 0,27 | −0,74 | 0,1266 | −0,0108 | |||||
| US36165YAB65 / BBB Industries U.S. Holdings, Inc. - First Lien | 0,27 | −84,75 | 0,1251 | −0,7566 | |||||
| US409322AD66 / HAMPTON ROADS PPV LLC BONDS 144A 06/53 6.621 | 0,27 | 0,00 | 0,1245 | −0,0094 | |||||
| US431571AE83 / HILLENBRAND INC 3.75% 03/01/2031 | 0,25 | 1,62 | 0,1184 | −0,0067 | |||||
| Atlas CC Acquisition Corp. / LON (N/A) | 0,25 | −91,71 | 0,1174 | −1,8241 | |||||
| XAC0102MAP05 / Air Canada 2021 Term Loan B | 0,25 | 0,1173 | 0,1173 | ||||||
| US50106GAE26 / Kronos Acquisition Holdings Inc / KIK Custom Products Inc | 0,25 | −2,36 | 0,1169 | −0,0115 | |||||
| US741771AA79 / Princess Juliana International Airport Operating Company N.V. | 0,24 | −1,61 | 0,1150 | −0,0107 | |||||
| US08883CAD02 / SOTHEBYS TERM B 1LN 01/15/2027 | 0,24 | −0,42 | 0,1126 | −0,0090 | |||||
| US896945AA07 / TRIPADVISOR INC 7% 07/15/2025 144A | 0,24 | −2,07 | 0,1118 | −0,0106 | |||||
| US85172FAQ28 / Springleaf Finance Corp 6.625% 01/15/2028 | 0,23 | 1,77 | 0,1085 | −0,0062 | |||||
| US03021BAJ35 / American Tire Distributors, Inc. | 0,22 | 0,90 | 0,1056 | −0,0071 | |||||
| YTPG / TPG Pace Beneficial II Corp - Class A | 0,02 | 0,00 | 0,22 | −3,11 | 0,1025 | −0,0112 | |||
| US67059TAE55 / NuStar Logistics LP | 0,21 | 0,47 | 0,1000 | −0,0068 | |||||
| US92763MAA36 / Viper Energy Partners LP 5.375% 11/01/2027 144A | 0,21 | 0,48 | 0,0986 | −0,0065 | |||||
| US18538RAJ23 / Clearwater Paper Corp | 0,21 | 4,59 | 0,0965 | −0,0026 | |||||
| US50077LAM81 / Kraft Heinz Foods Co | 0,19 | 8,47 | 0,0904 | 0,0007 | |||||
| US29273DAB64 / Endo Dac / Endo Finance LLC / Endo Finco Inc | 0,18 | −3,80 | 0,0834 | −0,0097 | |||||
| MTTR / Matterport, Inc. | 0,01 | 0,15 | 0,0704 | 0,0704 | |||||
| ATD / AMERICAN TIRE DISTRIBUTORS H. 2015 TERM LOAN | 0,15 | 0,69 | 0,0688 | −0,0048 | |||||
| Save-A-Lot / EC (N/A) | 0,02 | 0,14 | −95,37 | 0,0654 | −1,8760 | ||||
| US67059TAF21 / NuStar Logistics LP | 0,14 | 1,50 | 0,0636 | −0,0041 | |||||
| US96950GAE26 / Williams Scotsman International Inc | 0,13 | 0,78 | 0,0609 | −0,0039 | |||||
| US40467AAD19 / HAHGRO TL DD 1L USD | 0,12 | 0,0580 | 0,0580 | ||||||
| Permian Production Partners LLC / EC (N/A) | 0,10 | 0,12 | −95,97 | 0,0572 | −1,8843 | ||||
| US74045BAE74 / Pregis TopCo Corporation 2021 Incremental Term Loan | 0,12 | 0,0563 | 0,0563 | ||||||
| NCBJ / ABS-O (N/A) | 0,11 | −96,24 | 0,0534 | −1,8881 | |||||
| XAC8614YAB92 / Xplornet Communications, Inc., Term Loan | 0,10 | 0,00 | 0,0465 | −0,0038 | |||||
| QLIK / Qlik Technologies Inc. | 0,00 | −99,60 | 0,08 | 0,0371 | 0,0371 | ||||
| Targus Group International Equity, Inc. / EC (N/A) | 0,03 | 0,08 | −97,40 | 0,0367 | −1,9048 | ||||
| XS1078200430 / Mirabela Nickel Ltd. | 0,06 | 23,53 | 0,0301 | 0,0042 | |||||
| US5770961184 / Matterport, Inc. | 0,01 | 0,06 | 0,0290 | 0,0290 | |||||
| US06985PAN06 / Basic Energy Services, Inc. | 0,06 | −48,62 | 0,0263 | −0,0289 | |||||
| Atlas CC Acquisition Corp. / LON (N/A) | 0,05 | −98,33 | 0,0239 | −1,9176 | |||||
| BP Holdco LLC / EC (N/A) | 0,07 | 0,05 | −98,47 | 0,0219 | −1,9196 | ||||
| US48253T1170 / KKR Acquisition Holdings I Corp. | 0,03 | 100,00 | 0,03 | 92,31 | 0,0118 | 0,0050 | |||
| PT Intermediate Holdings III LLC / LON (N/A) | 0,02 | −99,23 | 0,0111 | −1,9304 | |||||
| SRNGW / Soaring Eagle Acquisition Corp - Warrants (23/02/2026) | 0,01 | 0,00 | 0,02 | 4,76 | 0,0105 | −0,0002 | |||
| National Mentor Holdings, Inc. / LON (N/A) | 0,02 | −99,37 | 0,0094 | −1,9321 | |||||
| Vector Phoenix Holdings, LP / EC (N/A) | 0,07 | 0,02 | −99,40 | 0,0085 | −1,9329 | ||||
| Legacy Reserves, Inc. / EC (N/A) | 0,00 | 0,01 | −99,57 | 0,0064 | −1,9351 | ||||
| US56168P1049 / Mana Capital Acquisition Corp. | 0,01 | −99,57 | 0,0062 | −1,9353 | |||||
| US1941701146 / Colicity, Inc. | 0,02 | 0,00 | 0,01 | −45,00 | 0,0053 | −0,0049 | |||
| SHO Holding I Corp. / LON (N/A) | 0,01 | −99,67 | 0,0050 | −1,9365 | |||||
| US44157YAB02 / Houghton Mifflin Co. | 0,00 | −97,76 | 0,0018 | −0,0660 | |||||
| US06747W8495 / Barclays Bank plc into Metlife, Inc. | 0,00 | −99,93 | 0,0011 | −1,9404 | |||||
| Bruin E&P Partnership Units / EC (N/A) | 0,04 | 0,00 | −99,93 | 0,0010 | −1,9405 | ||||
| Chef Holdings, Inc. / EC (N/A) | 0,00 | 0,00 | −99,97 | 0,0005 | −1,9410 | ||||
| QLIK / Qlik Technologies Inc. | 0,01 | 0,00 | 0,00 | 0,0000 | 0,0000 | ||||
| Sparta Systems / EC (N/A) | 0,00 | 0,00 | −100,00 | 0,0000 | −1,9415 | ||||
| Medline Industries, Inc. / LON (N/A) | 0,00 | −100,00 | −0,0000 | −1,9415 | |||||
| Pro Mach Group, Inc. / LON (N/A) | 0,00 | −100,00 | 0,0000 | −1,9415 | |||||
| Datix Bidco Ltd. / LON (N/A) | 0,00 | −100,00 | −0,0000 | −1,9415 | |||||
| Taxware Holdings (Sovos Compliance LLC) / LON (N/A) | 0,00 | −100,00 | 0,0000 | −1,9415 | |||||
| Medline Industries, Inc. / LON (N/A) | 0,00 | −100,00 | −0,0000 | −1,9415 | |||||
| CCC Information Services, Inc. / LON (N/A) | −0,00 | −100,00 | −0,0000 | −1,9415 | |||||
| CCC Information Services, Inc. / LON (N/A) | −0,00 | −100,00 | −0,0000 | −1,9415 | |||||
| National Mentor Holdings, Inc. / LON (N/A) | −0,00 | −100,00 | −0,0000 | −1,9415 | |||||
| PT Intermediate Holdings III LLC / LON (N/A) | −0,00 | −100,00 | −0,0001 | −1,9415 | |||||
| Eisner Advisory Group / LON (N/A) | −0,00 | −100,00 | −0,0001 | −1,9416 | |||||
| SCP Eye Care Services LLC / LON (N/A) | −0,00 | −100,00 | −0,0002 | −1,9416 | |||||
| Southern Veterinary Partners LLC / LON (N/A) | −0,00 | −100,03 | −0,0005 | −1,9420 | |||||
| US06747W8495 / Barclays Bank plc into Metlife, Inc. | −0,00 | −100,13 | −0,0019 | −1,9434 | |||||
| Matterport, Inc. / DE (N/A) | −0,01 | −100,17 | −0,0028 | −1,9443 | |||||
| US30065FAH82 / ExamWorks Group, Inc. | −0,02 | −100,77 | −0,0111 | −1,9526 | |||||
| Matterport, Inc. / DE (N/A) | −0,03 | −100,83 | −0,0120 | −1,9535 | |||||
| RBC Capital Markets LLC / RA (N/A) | −0,08 | −102,80 | −0,0395 | −1,9810 | |||||
| Alexander Mann / LON (N/A) | −0,14 | −104,76 | −0,0673 | −2,0088 | |||||
| Credit Suisse Securities (USA) LLC / RA (N/A) | −0,15 | −104,86 | −0,0687 | −2,0101 | |||||
| US13607C3925 / Canadian Imperial Bank of Commerce, ELN, (linked to S&P 500 Index) | −0,16 | −105,36 | −0,0758 | −2,0173 | |||||
| US13607C3925 / Canadian Imperial Bank of Commerce, ELN, (linked to S&P 500 Index) | −0,18 | −105,96 | −0,0845 | −2,0260 | |||||
| DE000C4SA6R6 / EURO STOXX 50 Index | −0,21 | −106,89 | −0,0973 | −2,0388 | |||||
| BMO Capital Markets Corp. / RA (N/A) | −0,23 | −107,69 | −0,1087 | −2,0502 | |||||
| US13607C3925 / Canadian Imperial Bank of Commerce, ELN, (linked to S&P 500 Index) | −0,24 | −107,89 | −0,1117 | −2,0532 | |||||
| BMO Capital Markets Corp. / RA (N/A) | −0,25 | −108,16 | −0,1154 | −2,0569 | |||||
| DE000C4SA6R6 / EURO STOXX 50 Index | −0,26 | −108,52 | −0,1203 | −2,0618 | |||||
| Polaris Newco LLC / LON (N/A) | −0,26 | −108,52 | −0,1205 | −2,0619 | |||||
| Credit Suisse Securities (USA) LLC / RA (N/A) | −0,26 | −108,56 | −0,1211 | −2,0626 | |||||
| RBC Capital Markets LLC / RA (N/A) | −0,26 | −108,66 | −0,1223 | −2,0638 | |||||
| RBC Capital Markets LLC / RA (N/A) | −0,29 | −109,52 | −0,1344 | −2,0759 | |||||
| DE000C4SA6R6 / EURO STOXX 50 Index | −0,29 | −109,66 | −0,1363 | −2,0778 | |||||
| BMO Capital Markets Corp. / RA (N/A) | −0,30 | −110,09 | −0,1427 | −2,0841 | |||||
| US13607C3925 / Canadian Imperial Bank of Commerce, ELN, (linked to S&P 500 Index) | −0,32 | −110,62 | −0,1500 | −2,0915 | |||||
| Credit Suisse Securities (USA) LLC / RA (N/A) | −0,32 | −110,79 | −0,1523 | −2,0938 | |||||
| DE000C4SA6R6 / EURO STOXX 50 Index | −0,33 | −110,99 | −0,1551 | −2,0966 | |||||
| RBC Capital Markets LLC / RA (N/A) | −0,34 | −111,32 | −0,1598 | −2,1013 | |||||
| Credit Suisse Securities (USA) LLC / RA (N/A) | −0,36 | −111,92 | −0,1683 | −2,1097 | |||||
| Barclays Capital, Inc. / RA (N/A) | −0,38 | −112,52 | −0,1767 | −2,1182 | |||||
| BMO Capital Markets Corp. / RA (N/A) | −0,38 | −112,62 | −0,1784 | −2,1198 | |||||
| RBC Capital Markets LLC / RA (N/A) | −0,39 | −113,12 | −0,1854 | −2,1269 | |||||
| DE000C4SA6R6 / EURO STOXX 50 Index | −0,41 | −113,72 | −0,1936 | −2,1351 | |||||
| RBC Capital Markets LLC / RA (N/A) | −0,42 | −113,89 | −0,1962 | −2,1377 | |||||
| BMO Capital Markets Corp. / RA (N/A) | −0,43 | −114,25 | −0,2014 | −2,1429 | |||||
| BMO Capital Markets Corp. / RA (N/A) | −0,47 | −115,48 | −0,2186 | −2,1601 | |||||
| BMO Capital Markets Corp. / RA (N/A) | −0,48 | −115,92 | −0,2249 | −2,1664 | |||||
| US13607C3925 / Canadian Imperial Bank of Commerce, ELN, (linked to S&P 500 Index) | −0,49 | −116,28 | −0,2303 | −2,1718 | |||||
| DE000C4SA6R6 / EURO STOXX 50 Index | −0,50 | −116,65 | −0,2350 | −2,1765 | |||||
| US13607C3925 / Canadian Imperial Bank of Commerce, ELN, (linked to S&P 500 Index) | −0,50 | −116,72 | −0,2360 | −2,1775 | |||||
| Credit Suisse Securities (USA) LLC / RA (N/A) | −0,50 | −116,75 | −0,2368 | −2,1782 | |||||
| Barclays Capital, Inc. / RA (N/A) | −0,51 | −116,85 | −0,2379 | −2,1794 | |||||
| DE000C4SA6R6 / EURO STOXX 50 Index | −0,51 | −116,98 | −0,2397 | −2,1812 | |||||
| BMO Capital Markets Corp. / RA (N/A) | −0,52 | −117,18 | −0,2425 | −2,1840 | |||||
| BMO Capital Markets Corp. / RA (N/A) | −0,56 | −118,71 | −0,2643 | −2,2058 | |||||
| DE000C4SA6R6 / EURO STOXX 50 Index | −0,57 | −119,08 | −0,2693 | −2,2108 | |||||
| US13607C3925 / Canadian Imperial Bank of Commerce, ELN, (linked to S&P 500 Index) | −0,58 | −119,25 | −0,2721 | −2,2135 | |||||
| US13607C3925 / Canadian Imperial Bank of Commerce, ELN, (linked to S&P 500 Index) | −0,59 | −119,61 | −0,2770 | −2,2184 | |||||
| US13607C3925 / Canadian Imperial Bank of Commerce, ELN, (linked to S&P 500 Index) | −0,61 | −120,31 | −0,2867 | −2,2282 | |||||
| RBC Capital Markets LLC / RA (N/A) | −0,63 | −121,05 | −0,2972 | −2,2387 | |||||
| Credit Suisse Securities (USA) LLC / RA (N/A) | −0,66 | −122,04 | −0,3115 | −2,2530 | |||||
| Barclays Capital, Inc. / RA (N/A) | −0,67 | −122,24 | −0,3143 | −2,2558 | |||||
| Barclays Capital, Inc. / RA (N/A) | −0,67 | −122,31 | −0,3151 | −2,2565 | |||||
| RBC Capital Markets LLC / RA (N/A) | −0,69 | −122,81 | −0,3220 | −2,2635 | |||||
| Barclays Capital, Inc. / RA (N/A) | −0,69 | −122,84 | −0,3224 | −2,2639 | |||||
| BMO Capital Markets Corp. / RA (N/A) | −0,70 | −123,28 | −0,3289 | −2,2704 | |||||
| BMO Capital Markets Corp. / RA (N/A) | −0,71 | −123,54 | −0,3326 | −2,2741 | |||||
| RBC Capital Markets LLC / RA (N/A) | −0,74 | −124,78 | −0,3500 | −2,2915 | |||||
| Credit Suisse Securities (USA) LLC / RA (N/A) | −0,76 | −125,27 | −0,3567 | −2,2982 | |||||
| DE000C4SA6R6 / EURO STOXX 50 Index | −0,76 | −125,27 | −0,3569 | −2,2984 | |||||
| BMO Capital Markets Corp. / RA (N/A) | −0,78 | −126,04 | −0,3675 | −2,3090 | |||||
| BMO Capital Markets Corp. / RA (N/A) | −0,78 | −126,04 | −0,3678 | −2,3092 | |||||
| RBC Capital Markets LLC / RA (N/A) | −0,81 | −127,11 | −0,3830 | −2,3245 | |||||
| DE000C4SA6R6 / EURO STOXX 50 Index | −0,83 | −127,47 | −0,3878 | −2,3292 | |||||
| DE000C4SA6R6 / EURO STOXX 50 Index | −0,86 | −128,54 | −0,4028 | −2,3443 | |||||
| RBC Capital Markets LLC / RA (N/A) | −0,88 | −129,37 | −0,4149 | −2,3564 | |||||
| RBC Capital Markets LLC / RA (N/A) | −0,90 | −130,10 | −0,4251 | −2,3666 | |||||
| US13607C3925 / Canadian Imperial Bank of Commerce, ELN, (linked to S&P 500 Index) | −0,91 | −130,17 | −0,4259 | −2,3674 | |||||
| US13607C3925 / Canadian Imperial Bank of Commerce, ELN, (linked to S&P 500 Index) | −0,91 | −130,24 | −0,4268 | −2,3683 | |||||
| US13607C3925 / Canadian Imperial Bank of Commerce, ELN, (linked to S&P 500 Index) | −0,91 | −130,30 | −0,4279 | −2,3694 | |||||
| Barclays Capital, Inc. / RA (N/A) | −0,92 | −130,57 | −0,4316 | −2,3730 | |||||
| Citigroup Global Markets, Inc. / RA (N/A) | −0,93 | −130,94 | −0,4367 | −2,3782 | |||||
| Credit Suisse Securities (USA) LLC / RA (N/A) | −0,94 | −131,34 | −0,4425 | −2,3840 | |||||
| BMO Capital Markets Corp. / RA (N/A) | −1,00 | −133,20 | −0,4687 | −2,4102 | |||||
| RBC Capital Markets LLC / RA (N/A) | −1,01 | −133,50 | −0,4731 | −2,4146 | |||||
| Barclays Capital, Inc. / RA (N/A) | −1,03 | −134,43 | −0,4862 | −2,4276 | |||||
| Barclays Capital, Inc. / RA (N/A) | −1,08 | −135,83 | −0,5060 | −2,4475 | |||||
| BMO Capital Markets Corp. / RA (N/A) | −1,09 | −136,36 | −0,5133 | −2,4548 | |||||
| DE000C4SA6R6 / EURO STOXX 50 Index | −1,10 | −136,56 | −0,5161 | −2,4576 | |||||
| Barclays Capital, Inc. / RA (N/A) | −1,12 | −137,33 | −0,5272 | −2,4686 | |||||
| Barclays Capital, Inc. / RA (N/A) | −1,12 | −137,43 | −0,5286 | −2,4700 | |||||
| US13607C3925 / Canadian Imperial Bank of Commerce, ELN, (linked to S&P 500 Index) | −1,12 | −137,43 | −0,5286 | −2,4701 | |||||
| US13607C3925 / Canadian Imperial Bank of Commerce, ELN, (linked to S&P 500 Index) | −1,14 | −138,10 | −0,5380 | −2,4795 | |||||
| BMO Capital Markets Corp. / RA (N/A) | −1,16 | −138,69 | −0,5462 | −2,4877 | |||||
| Barclays Capital, Inc. / RA (N/A) | −1,17 | −139,06 | −0,5517 | −2,4932 | |||||
| Credit Suisse Securities (USA) LLC / RA (N/A) | −1,18 | −139,33 | −0,5550 | −2,4965 | |||||
| US13607C3925 / Canadian Imperial Bank of Commerce, ELN, (linked to S&P 500 Index) | −1,21 | −140,39 | −0,5703 | −2,5118 | |||||
| US13607C3925 / Canadian Imperial Bank of Commerce, ELN, (linked to S&P 500 Index) | −1,26 | −141,99 | −0,5930 | −2,5344 | |||||
| Credit Suisse Securities (USA) LLC / RA (N/A) | −1,31 | −143,49 | −0,6142 | −2,5557 | |||||
| US13607C3925 / Canadian Imperial Bank of Commerce, ELN, (linked to S&P 500 Index) | −1,32 | −144,06 | −0,6218 | −2,5633 | |||||
| DE000C4SA6R6 / EURO STOXX 50 Index | −1,32 | −144,06 | −0,6220 | −2,5634 | |||||
| US13607C3925 / Canadian Imperial Bank of Commerce, ELN, (linked to S&P 500 Index) | −1,33 | −144,26 | −0,6247 | −2,5662 | |||||
| BMO Capital Markets Corp. / RA (N/A) | −1,38 | −145,95 | −0,6486 | −2,5901 | |||||
| Barclays Capital, Inc. / RA (N/A) | −1,43 | −147,45 | −0,6700 | −2,6115 | |||||
| BMO Capital Markets Corp. / RA (N/A) | −1,54 | −151,38 | −0,7256 | −2,6670 | |||||
| Credit Suisse Securities (USA) LLC / RA (N/A) | −1,55 | −151,65 | −0,7291 | −2,6706 | |||||
| Barclays Capital, Inc. / RA (N/A) | −1,57 | −152,41 | −0,7398 | −2,6813 | |||||
| RBC Capital Markets LLC / RA (N/A) | −1,59 | −153,08 | −0,7496 | −2,6910 | |||||
| Barclays Capital, Inc. / RA (N/A) | −1,70 | −156,68 | −0,8003 | −2,7417 | |||||
| Credit Suisse Securities (USA) LLC / RA (N/A) | −1,82 | −160,57 | −0,8549 | −2,7964 | |||||
| BMO Capital Markets Corp. / RA (N/A) | −1,82 | −160,67 | −0,8565 | −2,7980 | |||||
| US13607C3925 / Canadian Imperial Bank of Commerce, ELN, (linked to S&P 500 Index) | −1,87 | −162,24 | −0,8786 | −2,8200 | |||||
| BMO Capital Markets Corp. / RA (N/A) | −1,91 | −163,70 | −0,8993 | −2,8407 | |||||
| RBC Capital Markets LLC / RA (N/A) | −1,95 | −165,00 | −0,9175 | −2,8590 | |||||
| Citigroup Global Markets, Inc. / RA (N/A) | −2,30 | −176,59 | −1,0811 | −3,0225 | |||||
| BMO Capital Markets Corp. / RA (N/A) | −2,34 | −177,89 | −1,0994 | −3,0409 | |||||
| Barclays Capital, Inc. / RA (N/A) | −2,43 | −180,79 | −1,1406 | −3,0821 |