Grundläggande statistik
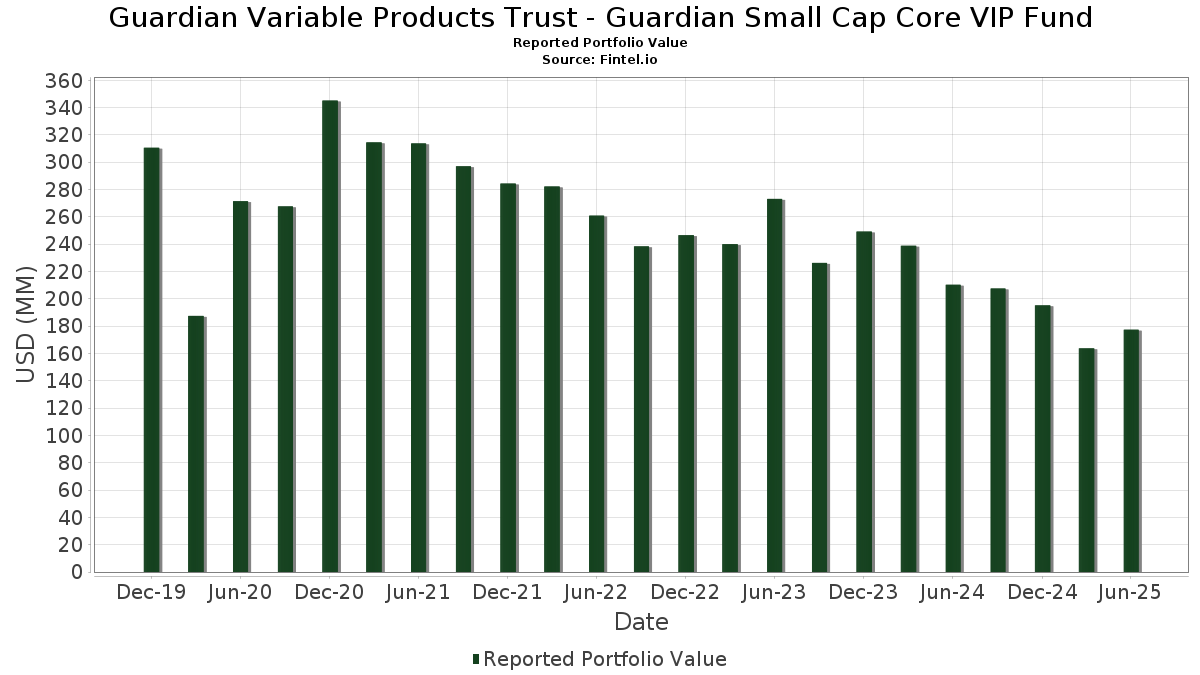
| Portföljvärde | $ 177 366 146 |
| Aktuella positioner | 94 |
Senaste innehav, resultat, förvaltat kapital (från 13F, 13D)
Guardian Variable Products Trust - Guardian Small Cap Core VIP Fund har redovisat 94 totala innehav i sina senaste SEC-arkiveringar. Det senaste portföljvärdet beräknas vara $ 177 366 146 USD. Faktiskt förvaltade tillgångar (AUM) är detta värde plus likvida medel (som inte redovisas). Guardian Variable Products Trust - Guardian Small Cap Core VIP Funds största innehav är Silicon Motion Technology Corporation - Depositary Receipt (Common Stock) (US:SIMO) , BGC Group, Inc. (US:BGC) , Kemper Corporation (US:KMPR) , BrightView Holdings, Inc. (US:BV) , and Brixmor Property Group Inc. (US:BRX) . Guardian Variable Products Trust - Guardian Small Cap Core VIP Funds nya positioner inkluderar Silicon Motion Technology Corporation - Depositary Receipt (Common Stock) (US:SIMO) , BGC Group, Inc. (US:BGC) , Kemper Corporation (US:KMPR) , BrightView Holdings, Inc. (US:BV) , and Brixmor Property Group Inc. (US:BRX) .
Största ökningarna detta kvartal
Vi använder förändringen i portföljallokeringen eftersom det är det mest meningsfulla måttet. Förändringar kan bero på transaktioner eller förändringar i aktiekurser.
| Värdepapper | Aktier (MM) |
Värde (MM$) |
Portfölj % av | ΔPortfölj % av |
|---|---|---|---|---|
| 0,07 | 5,07 | 2,8582 | 2,8582 | |
| 0,41 | 4,22 | 2,3779 | 2,3779 | |
| 0,07 | 4,20 | 2,3680 | 2,3680 | |
| 3,91 | 2,2023 | 2,2023 | ||
| 0,23 | 3,84 | 2,1654 | 2,1654 | |
| 0,14 | 3,59 | 2,0254 | 2,0254 | |
| 0,03 | 3,43 | 1,9335 | 1,9335 | |
| 0,06 | 3,36 | 1,8948 | 1,8948 | |
| 0,02 | 3,35 | 1,8881 | 1,8881 | |
| 0,11 | 3,35 | 1,8873 | 1,8873 |
Största minskningarna detta kvartal
Vi använder förändringen i portföljallokeringen eftersom det är det mest meningsfulla måttet. Förändringar kan bero på transaktioner eller förändringar i aktiepriser.
| Värdepapper | Aktier (MM) |
Värde (MM$) |
Portfölj % av | ΔPortfölj % av |
|---|---|---|---|---|
| 0,02 | 0,85 | 0,4769 | −1,2685 | |
| 0,00 | 0,00 | −1,1303 | ||
| 0,00 | 0,00 | −0,9105 | ||
| 0,03 | 0,35 | 0,1999 | −0,8134 | |
| 0,00 | 0,00 | −0,7390 | ||
| 0,00 | 0,00 | −0,6576 | ||
| 0,00 | 0,00 | −0,6100 | ||
| 0,00 | 0,00 | −0,4860 | ||
| 0,22 | 1,61 | 0,9050 | −0,4177 | |
| 0,00 | 0,00 | −0,4117 |
13F- och fond arkiveringar
Denna blankett lämnades in den 2025-08-15 för rapporteringsperioden 2025-06-30. Klicka på länksymbolen för att se hela transaktionshistoriken.
Uppgradera för att låsa upp premiumdata och exportera till Excel![]() .
.
| Värdepapper | Typ | Genomsnittligt aktiepris | Aktier (MM) |
ΔAktier (%) |
ΔAktier (%) |
Värde ($MM) |
Portfölj (%) |
ΔPortfölj (%) |
|
|---|---|---|---|---|---|---|---|---|---|
| SIMO / Silicon Motion Technology Corporation - Depositary Receipt (Common Stock) | 0,07 | 5,07 | 2,8582 | 2,8582 | |||||
| BGC / BGC Group, Inc. | 0,41 | 4,22 | 2,3779 | 2,3779 | |||||
| KMPR / Kemper Corporation | 0,07 | 4,20 | 2,3680 | 2,3680 | |||||
| FIXED INC CLEARING CORP.REPO / RA (000000000) | 3,91 | 2,2023 | 2,2023 | ||||||
| BV / BrightView Holdings, Inc. | 0,23 | 3,84 | 2,1654 | 2,1654 | |||||
| BRX / Brixmor Property Group Inc. | 0,14 | 3,59 | 2,0254 | 2,0254 | |||||
| TFX / Teleflex Incorporated | 0,03 | 3,43 | 1,9335 | 1,9335 | |||||
| EFSC / Enterprise Financial Services Corp | 0,06 | 3,36 | 1,8948 | 1,8948 | |||||
| THG / The Hanover Insurance Group, Inc. | 0,02 | 3,35 | 1,8881 | 1,8881 | |||||
| ENOV / Enovis Corporation | 0,11 | 3,35 | 1,8873 | 1,8873 | |||||
| AL / Air Lease Corporation | 0,06 | 3,35 | 1,8860 | 1,8860 | |||||
| WBS / Webster Financial Corporation | 0,06 | 3,30 | 1,8604 | 1,8604 | |||||
| GTY / Getty Realty Corp. | 0,11 | 3,08 | 1,7369 | 1,7369 | |||||
| NCR / NCR Corp. | 0,26 | 130,13 | 3,05 | 113,82 | 1,7174 | 1,1205 | |||
| GXO / GXO Logistics, Inc. | 0,06 | 3,00 | 1,6929 | 1,6929 | |||||
| POR / Portland General Electric Company | 0,07 | 16,81 | 2,93 | 6,42 | 1,6531 | −0,0304 | |||
| PB / Prosperity Bancshares, Inc. | 0,04 | −16,63 | 2,78 | 3,69 | 1,5677 | 0,5906 | |||
| ABM / ABM Industries Incorporated | 0,06 | 2,72 | 1,5334 | 1,5334 | |||||
| STNG / Scorpio Tankers Inc. | 0,07 | 2,67 | 1,5074 | 1,5074 | |||||
| GIL / Gildan Activewear Inc. | 0,05 | 2,61 | 1,4727 | 1,4727 | |||||
| CARG / CarGurus, Inc. | 0,08 | 2,58 | 1,4536 | 1,4536 | |||||
| SR / Spire Inc. | 0,03 | 2,52 | 1,4216 | 1,4216 | |||||
| KNX / Knight-Swift Transportation Holdings Inc. | 0,06 | 2,47 | 1,3930 | 1,3930 | |||||
| BKV / BKV Corporation | 0,10 | 2,43 | 1,3713 | 1,3713 | |||||
| NBHC / National Bank Holdings Corporation | 0,06 | 2,28 | 1,2832 | 1,2832 | |||||
| FCF / First Commonwealth Financial Corporation | 0,14 | 2,27 | 1,2775 | 1,2775 | |||||
| CXT / Crane NXT, Co. | 0,04 | 64,53 | 2,26 | 72,60 | 1,2745 | 0,4740 | |||
| CSCCF / Capstone Copper Corp. | 0,36 | 2,23 | 1,2581 | 1,2581 | |||||
| HCC / Warrior Met Coal, Inc. | 0,05 | 120,50 | 2,20 | 111,83 | 1,2416 | 0,6063 | |||
| DRVN / Driven Brands Holdings Inc. | 0,13 | 2,20 | 1,2405 | 1,2405 | |||||
| BNL / Broadstone Net Lease, Inc. | 0,14 | 2,20 | 1,2405 | 1,2405 | |||||
| NWE / NorthWestern Energy Group, Inc. | 0,04 | 2,19 | 1,2346 | 1,2346 | |||||
| CSTM / Constellium SE | 0,16 | 25,38 | 2,14 | −11,57 | 1,2071 | 0,0556 | |||
| BPOP / Popular, Inc. | 0,02 | 2,10 | 1,1835 | 1,1835 | |||||
| PHR / Phreesia, Inc. | 0,07 | 2,09 | 1,1796 | 1,1796 | |||||
| TDC / Teradata Corporation | 0,09 | 2,07 | 1,1684 | 1,1684 | |||||
| BKH / Black Hills Corporation | 0,04 | 28,90 | 2,05 | 20,02 | 1,1558 | 0,5334 | |||
| MYRG / MYR Group Inc. | 0,01 | 2,02 | 1,1358 | 1,1358 | |||||
| VRNT / Verint Systems Inc. | 0,10 | 1,95 | 1,0990 | 1,0990 | |||||
| COHR / Coherent Corp. | 0,02 | 1,92 | 1,0811 | 1,0811 | |||||
| ERO / Ero Copper Corp. | 0,11 | 1,90 | 1,0728 | 1,0728 | |||||
| CNO / CNO Financial Group, Inc. | 0,05 | 1,88 | 1,0591 | 1,0591 | |||||
| DRS / Leonardo DRS, Inc. | 0,04 | 1,84 | 1,0345 | 1,0345 | |||||
| TSEM / Tower Semiconductor Ltd. | 0,04 | −56,90 | 1,81 | −33,38 | 1,0214 | 0,1418 | |||
| SLM / SLM Corporation | 0,05 | 1,77 | 0,9956 | 0,9956 | |||||
| AXS / AXIS Capital Holdings Limited | 0,02 | 1,73 | 0,9739 | 0,9739 | |||||
| WSBC / WesBanco, Inc. | 0,05 | −43,25 | 1,72 | −29,90 | 0,9675 | 0,0756 | |||
| FBP / First BanCorp. | 0,08 | 1,71 | 0,9655 | 0,9655 | |||||
| MTZ / MasTec, Inc. | 0,01 | 1,69 | 0,9550 | 0,9550 | |||||
| 541 / ADT Inc. | 0,20 | 1,68 | 0,9467 | 0,9467 | |||||
| MMS / Maximus, Inc. | 0,02 | 1,67 | 0,9413 | 0,9413 | |||||
| TKA / thyssenkrupp AG | 0,16 | 1,67 | 0,9392 | 0,9392 | |||||
| DHT / DHT Holdings, Inc. | 0,15 | 1,66 | 0,9361 | 0,9361 | |||||
| NMRK / Newmark Group, Inc. | 0,14 | 1,66 | 0,9355 | 0,9355 | |||||
| ACA / Arcosa, Inc. | 0,02 | 1,66 | 0,9337 | 0,9337 | |||||
| INR / Infinity Natural Resources, Inc. | 0,09 | 1,64 | 0,9255 | 0,9255 | |||||
| SBLK / Star Bulk Carriers Corp. | 0,09 | 1,63 | 0,9159 | 0,9159 | |||||
| BBWI / Bath & Body Works, Inc. | 0,05 | 1,62 | 0,9120 | 0,9120 | |||||
| HLMN / Hillman Solutions Corp. | 0,22 | −8,72 | 1,61 | −25,87 | 0,9050 | −0,4177 | |||
| ASH / Ashland Inc. | 0,03 | 1,59 | 0,8989 | 0,8989 | |||||
| THC / Tenet Healthcare Corporation | 0,01 | 1,56 | 0,8798 | 0,8798 | |||||
| NOMD / Nomad Foods Limited | 0,09 | 1,56 | 0,8797 | 0,8797 | |||||
| KBR / KBR, Inc. | 0,03 | 1,55 | 0,8724 | 0,8724 | |||||
| AA / Alcoa Corporation | 0,05 | 1,46 | 0,8241 | 0,8241 | |||||
| CMC / Commercial Metals Company | 0,03 | −2,80 | 1,44 | 3,29 | 0,8137 | −0,0397 | |||
| HUN / Huntsman Corporation | 0,13 | 1,38 | 0,7756 | 0,7756 | |||||
| MOS / The Mosaic Company | 0,04 | 1,30 | 0,7324 | 0,7324 | |||||
| SM / SM Energy Company | 0,05 | 1,28 | 0,7230 | 0,7230 | |||||
| DIOD / Diodes Incorporated | 0,02 | 1,19 | 0,6698 | 0,6698 | |||||
| AAP / Advance Auto Parts, Inc. | 0,02 | 1,10 | 0,6206 | 0,6206 | |||||
| THRM / Gentherm Incorporated | 0,04 | 1,00 | 0,5644 | 0,5644 | |||||
| ALGT / Allegiant Travel Company | 0,02 | −38,04 | 0,95 | −34,09 | 0,5373 | −0,3460 | |||
| TKR / The Timken Company | 0,01 | 0,95 | 0,5366 | 0,5366 | |||||
| HALO / Halozyme Therapeutics, Inc. | 0,02 | 0,94 | 0,5283 | 0,5283 | |||||
| UFPI / UFP Industries, Inc. | 0,01 | 0,93 | 0,5261 | 0,5261 | |||||
| UA / Under Armour, Inc. | 0,14 | 0,91 | 0,5154 | 0,5154 | |||||
| FCFS / FirstCash Holdings, Inc. | 0,01 | 0,88 | 0,4942 | 0,4942 | |||||
| KGS / Kodiak Gas Services, Inc. | 0,03 | 0,87 | 0,4901 | 0,4901 | |||||
| XPRO / Expro Group Holdings N.V. | 0,10 | 0,86 | 0,4844 | 0,4844 | |||||
| CCS / Century Communities, Inc. | 0,02 | −66,57 | 0,85 | −76,94 | 0,4769 | −1,2685 | |||
| VNOM / Viper Energy, Inc. | 0,02 | 0,84 | 0,4713 | 0,4713 | |||||
| SLDE / Slide Insurance Holdings, Inc. | 0,04 | 0,76 | 0,4280 | 0,4280 | |||||
| WH / Wyndham Hotels & Resorts, Inc. | 0,01 | 0,74 | 0,4184 | 0,4184 | |||||
| GO / Grocery Outlet Holding Corp. | 0,06 | 0,73 | 0,4117 | 0,4117 | |||||
| FA / First Advantage Corporation | 0,04 | 0,72 | 0,4046 | 0,4046 | |||||
| LBRT / Liberty Energy Inc. | 0,06 | 0,64 | 0,3584 | 0,3584 | |||||
| PLAY / Dave & Buster's Entertainment, Inc. | 0,02 | 0,62 | 0,3520 | 0,3520 | |||||
| BB / BlackBerry Limited | 0,11 | 0,52 | 0,2928 | 0,2928 | |||||
| CALX / Calix, Inc. | 0,01 | 0,51 | 0,2902 | 0,2902 | |||||
| CHYM / Chime Financial, Inc. | 0,01 | 0,50 | 0,2819 | 0,2819 | |||||
| W / Wayfair Inc. | 0,01 | 0,47 | 0,2621 | 0,2621 | |||||
| NVEE / NV5 Global, Inc. | 0,02 | 0,43 | 0,2450 | 0,2450 | |||||
| PRI / Primerica, Inc. | 0,00 | 0,42 | 0,2383 | 0,2383 | |||||
| AESI / Atlas Energy Solutions Inc. | 0,03 | −71,48 | 0,35 | −78,66 | 0,1999 | −0,8134 | |||
| ZETA / Zeta Global Holdings Corp. | 0,00 | −100,00 | 0,00 | −100,00 | −0,6576 | ||||
| COLB / Columbia Banking System, Inc. | 0,00 | −100,00 | 0,00 | −100,00 | −1,1303 | ||||
| PRVA / Privia Health Group, Inc. | 0,00 | −100,00 | 0,00 | −100,00 | −0,9105 | ||||
| WULF / TeraWulf Inc. | 0,00 | −100,00 | 0,00 | −100,00 | −0,4860 | ||||
| ASGN / ASGN Incorporated | 0,00 | −100,00 | 0,00 | −100,00 | −0,7390 | ||||
| ARWR / Arrowhead Pharmaceuticals, Inc. | 0,00 | −100,00 | 0,00 | −100,00 | −0,6100 | ||||
| GPRE / Green Plains Inc. | 0,00 | −100,00 | 0,00 | −100,00 | −0,4117 | ||||
| BBNX / Beta Bionics, Inc. | 0,00 | −100,00 | 0,00 | −100,00 | −0,3672 |