Grundläggande statistik
| Portföljvärde | $ 153 404 128 |
| Aktuella positioner | 45 |
Senaste innehav, resultat, förvaltat kapital (från 13F, 13D)
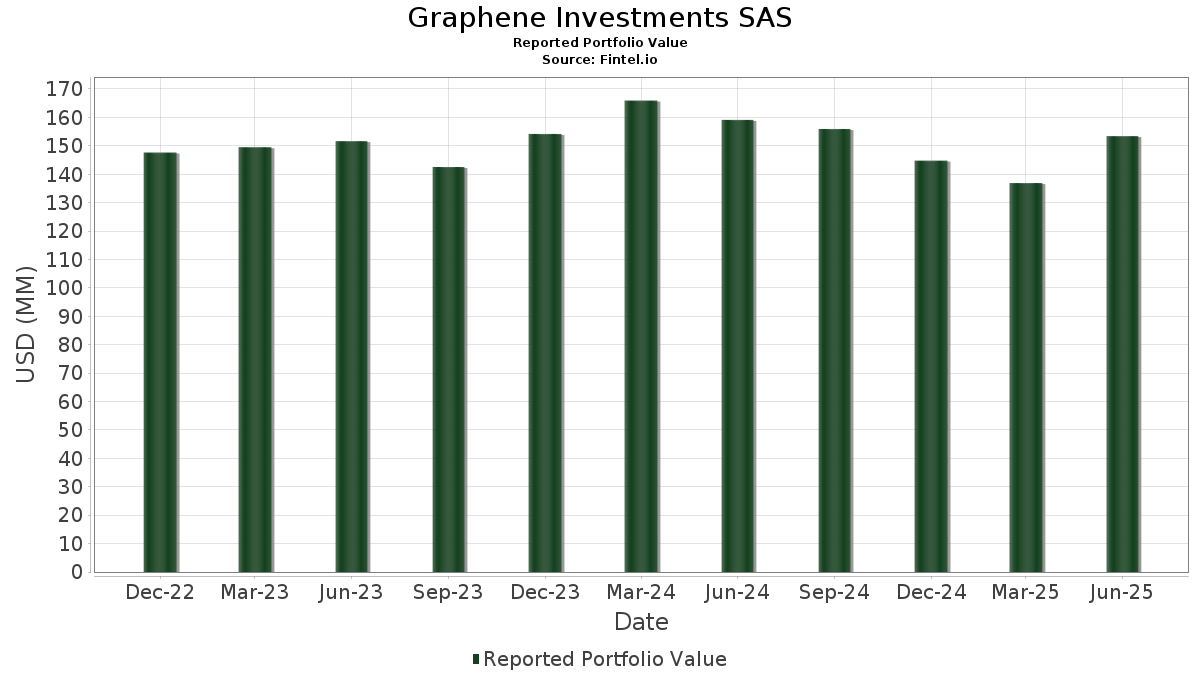
Graphene Investments SAS har redovisat 45 totala innehav i sina senaste SEC-arkiveringar. Det senaste portföljvärdet beräknas vara $ 153 404 128 USD. Faktiskt förvaltade tillgångar (AUM) är detta värde plus likvida medel (som inte redovisas). Graphene Investments SASs största innehav är Microsoft Corporation (US:MSFT) , Broadcom Inc. (US:AVGO) , NVIDIA Corporation (US:NVDA) , Alphabet Inc. (US:GOOGL) , and Apple Inc. (US:AAPL) . Graphene Investments SASs nya positioner inkluderar Iridium Communications Inc. (US:IRDM) , EOG Resources, Inc. (US:EOG) , .
Största ökningarna detta kvartal
Vi använder förändringen i portföljallokeringen eftersom det är det mest meningsfulla måttet. Förändringar kan bero på transaktioner eller förändringar i aktiekurser.
| Värdepapper | Aktier (MM) |
Värde (MM$) |
Portfölj % av | ΔPortfölj % av |
|---|---|---|---|---|
| 0,12 | 3,48 | 2,2676 | 2,2676 | |
| 0,02 | 2,98 | 1,9415 | 1,9415 | |
| 0,02 | 6,64 | 4,3305 | 0,8691 | |
| 0,07 | 3,37 | 2,1966 | 0,4663 | |
| 0,04 | 6,29 | 4,0990 | 0,3382 | |
| 0,01 | 6,86 | 4,4746 | 0,3337 | |
| 0,05 | 2,94 | 1,9143 | 0,3070 | |
| 0,02 | 2,84 | 1,8499 | 0,2993 | |
| 0,00 | 3,27 | 2,1342 | 0,2639 | |
| 0,03 | 3,42 | 2,2310 | 0,2412 |
Största minskningarna detta kvartal
Vi använder förändringen i portföljallokeringen eftersom det är det mest meningsfulla måttet. Förändringar kan bero på transaktioner eller förändringar i aktiepriser.
| Värdepapper | Aktier (MM) |
Värde (MM$) |
Portfölj % av | ΔPortfölj % av |
|---|---|---|---|---|
| 0,07 | 2,83 | 1,8420 | −0,5243 | |
| 0,01 | 3,05 | 1,9900 | −0,3537 | |
| 0,01 | 3,10 | 2,0191 | −0,3190 | |
| 0,02 | 3,02 | 1,9658 | −0,2987 | |
| 0,01 | 2,88 | 1,8805 | −0,2784 | |
| 0,01 | 2,95 | 1,9242 | −0,2575 | |
| 0,11 | 2,46 | 1,6018 | −0,2181 | |
| 0,01 | 2,84 | 1,8491 | −0,2078 | |
| 0,10 | 2,86 | 1,8651 | −0,2036 | |
| 0,01 | 2,75 | 1,7954 | −0,1847 |
13F- och fond arkiveringar
Denna blankett lämnades in den 2025-08-06 för rapporteringsperioden 2025-06-30. Klicka på länksymbolen för att se hela transaktionshistoriken.
Uppgradera för att låsa upp premiumdata och exportera till Excel![]() .
.
| Värdepapper | Typ | Genomsnittligt aktiepris | Aktier (MM) |
ΔAktier (%) |
ΔAktier (%) |
Värde ($MM) |
Portfölj (%) |
ΔPortfölj (%) |
|
|---|---|---|---|---|---|---|---|---|---|
| MSFT / Microsoft Corporation | 0,01 | −8,61 | 6,86 | 21,10 | 4,4746 | 0,3337 | |||
| AVGO / Broadcom Inc. | 0,02 | −14,84 | 6,64 | 40,21 | 4,3305 | 0,8691 | |||
| NVDA / NVIDIA Corporation | 0,04 | −16,21 | 6,29 | 22,14 | 4,0990 | 0,3382 | |||
| GOOGL / Alphabet Inc. | 0,03 | 0,00 | 6,15 | 13,97 | 4,0093 | 0,0667 | |||
| AAPL / Apple Inc. | 0,03 | 19,03 | 6,03 | 9,93 | 3,9321 | −0,0760 | |||
| IRDM / Iridium Communications Inc. | 0,12 | 3,48 | 2,2676 | 2,2676 | |||||
| PFE / Pfizer Inc. | 0,14 | 23,98 | 3,47 | 18,63 | 2,2628 | 0,1247 | |||
| BK / The Bank of New York Mellon Corporation | 0,04 | 0,00 | 3,43 | 8,63 | 2,2331 | −0,0706 | |||
| ITRI / Itron, Inc. | 0,03 | 0,00 | 3,42 | 25,67 | 2,2310 | 0,2412 | |||
| FLEX / Flex Ltd. | 0,07 | −5,73 | 3,37 | 42,27 | 2,1966 | 0,4663 | |||
| DBX / Dropbox, Inc. | 0,12 | 2,38 | 3,32 | 9,63 | 2,1664 | −0,0483 | |||
| MSI / Motorola Solutions, Inc. | 0,01 | 17,91 | 3,32 | 13,23 | 2,1653 | 0,0224 | |||
| LLY / Eli Lilly and Company | 0,00 | 35,48 | 3,27 | 27,89 | 2,1342 | 0,2639 | |||
| AMZN / Amazon.com, Inc. | 0,01 | 0,00 | 3,27 | 15,31 | 2,1309 | 0,0600 | |||
| FI / Fiserv, Inc. | 0,02 | 51,20 | 3,26 | 18,04 | 2,1242 | 0,1076 | |||
| MS / Morgan Stanley | 0,02 | 0,00 | 3,24 | 20,72 | 2,1119 | 0,1516 | |||
| ATI / ATI Inc. | 0,04 | −30,90 | 3,19 | 14,65 | 2,0768 | 0,0471 | |||
| MCK / McKesson Corporation | 0,00 | 0,00 | 3,15 | 8,88 | 2,0540 | −0,0600 | |||
| RJF / Raymond James Financial, Inc. | 0,02 | 0,00 | 3,14 | 10,43 | 2,0495 | −0,0307 | |||
| CDW / CDW Corporation | 0,02 | 0,00 | 3,11 | 11,44 | 2,0257 | −0,0114 | |||
| HCA / HCA Healthcare, Inc. | 0,01 | 0,00 | 3,10 | 10,90 | 2,0228 | −0,0219 | |||
| TMUS / T-Mobile US, Inc. | 0,01 | 8,33 | 3,10 | −3,22 | 2,0191 | −0,3190 | |||
| URI / United Rentals, Inc. | 0,00 | −12,77 | 3,09 | 4,86 | 2,0136 | −0,1381 | |||
| CPAY / Corpay, Inc. | 0,01 | 0,00 | 3,05 | −4,86 | 1,9900 | −0,3537 | |||
| VRTX / Vertex Pharmaceuticals Incorporated | 0,01 | 23,64 | 3,03 | 13,54 | 1,9735 | 0,0255 | |||
| CNC / Centene Corporation | 0,06 | 21,66 | 3,02 | 8,76 | 1,9673 | −0,0595 | |||
| BFAM / Bright Horizons Family Solutions Inc. | 0,02 | 0,00 | 3,02 | −2,71 | 1,9658 | −0,2987 | |||
| TENB / Tenable Holdings, Inc. | 0,09 | 18,74 | 3,00 | 14,66 | 1,9532 | 0,0443 | |||
| EOG / EOG Resources, Inc. | 0,02 | 2,98 | 1,9415 | 1,9415 | |||||
| WM / Waste Management, Inc. | 0,01 | 0,00 | 2,95 | −1,17 | 1,9242 | −0,2575 | |||
| PINS / Pinterest, Inc. | 0,08 | −1,44 | 2,95 | 14,03 | 1,9239 | 0,0329 | |||
| PSTG / Pure Storage, Inc. | 0,05 | 2,62 | 2,94 | 33,45 | 1,9143 | 0,3070 | |||
| IQV / IQVIA Holdings Inc. | 0,02 | 22,67 | 2,90 | 9,64 | 1,8902 | −0,0417 | |||
| BURL / Burlington Stores, Inc. | 0,01 | 0,00 | 2,88 | −2,40 | 1,8805 | −0,2784 | |||
| BBWI / Bath & Body Works, Inc. | 0,10 | 2,25 | 2,86 | 1,06 | 1,8651 | −0,2036 | |||
| JAZZ / Jazz Pharmaceuticals plc | 0,03 | 30,10 | 2,84 | 11,22 | 1,8539 | −0,0144 | |||
| VRT / Vertiv Holdings Co | 0,02 | −24,83 | 2,84 | 33,69 | 1,8499 | 0,2993 | |||
| RGA / Reinsurance Group of America, Incorporated | 0,01 | 0,00 | 2,84 | 0,75 | 1,8491 | −0,2078 | |||
| BKR / Baker Hughes Company | 0,07 | 0,00 | 2,83 | −12,78 | 1,8420 | −0,5243 | |||
| ON / ON Semiconductor Corporation | 0,05 | −10,64 | 2,77 | 15,12 | 1,8073 | 0,0476 | |||
| PATH / UiPath Inc. | 0,22 | −13,26 | 2,75 | 7,79 | 1,7956 | −0,0712 | |||
| CRM / Salesforce, Inc. | 0,01 | 0,00 | 2,75 | 1,62 | 1,7954 | −0,1847 | |||
| GAP / The Gap, Inc. | 0,12 | −4,56 | 2,55 | 0,99 | 1,6649 | −0,1825 | |||
| NXT / Nextracker Inc. | 0,05 | −22,01 | 2,48 | 0,61 | 1,6197 | −0,1842 | |||
| INTC / Intel Corporation | 0,11 | 0,00 | 2,46 | −1,36 | 1,6018 | −0,2181 | |||
| COTY / Coty Inc. | 0,00 | −100,00 | 0,00 | 0,0000 | |||||
| OXY / Occidental Petroleum Corporation | 0,00 | −100,00 | 0,00 | 0,0000 |