Grundläggande statistik
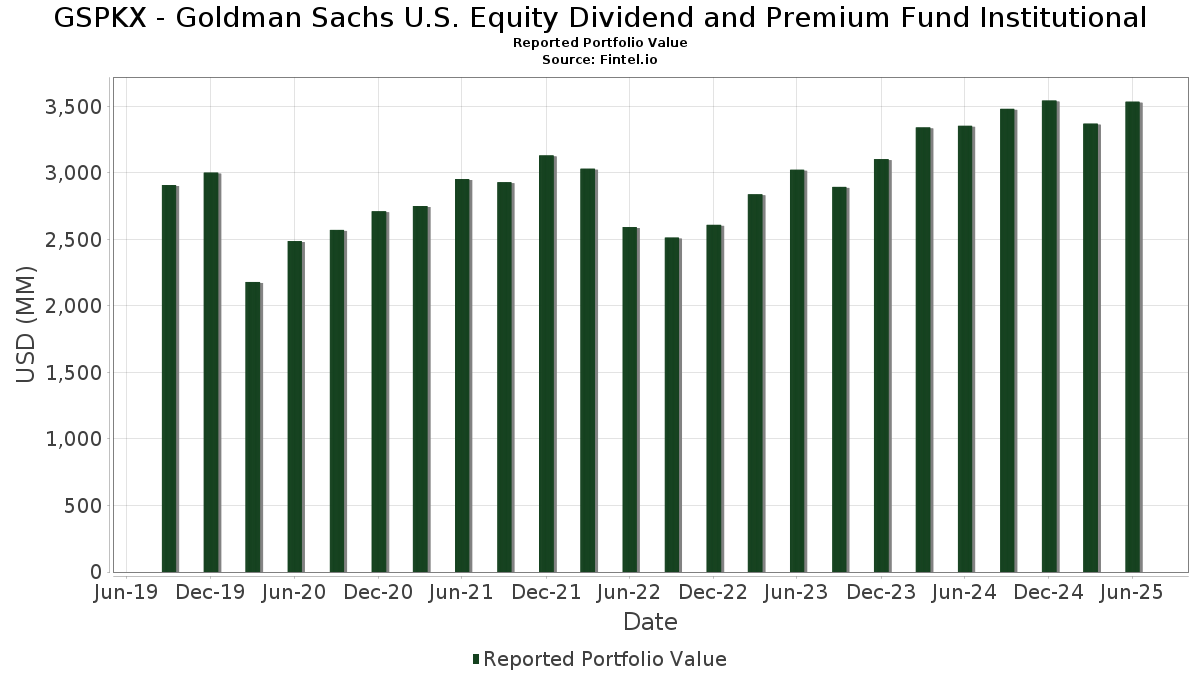
| Portföljvärde | $ 3 535 381 981 |
| Aktuella positioner | 218 |
Senaste innehav, resultat, förvaltat kapital (från 13F, 13D)
GSPKX - Goldman Sachs U.S. Equity Dividend and Premium Fund Institutional har redovisat 218 totala innehav i sina senaste SEC-arkiveringar. Det senaste portföljvärdet beräknas vara $ 3 535 381 981 USD. Faktiskt förvaltade tillgångar (AUM) är detta värde plus likvida medel (som inte redovisas). GSPKX - Goldman Sachs U.S. Equity Dividend and Premium Fund Institutionals största innehav är NVIDIA Corporation (US:NVDA) , Microsoft Corporation (US:MSFT) , Apple Inc. (US:AAPL) , Amazon.com, Inc. (US:AMZN) , and Meta Platforms, Inc. (US:META) .
Största ökningarna detta kvartal
Vi använder förändringen i portföljallokeringen eftersom det är det mest meningsfulla måttet. Förändringar kan bero på transaktioner eller förändringar i aktiekurser.
| Värdepapper | Aktier (MM) |
Värde (MM$) |
Portfölj % av | ΔPortfölj % av |
|---|---|---|---|---|
| 1,73 | 273,91 | 7,7372 | 2,1268 | |
| 0,54 | 267,89 | 7,5674 | 1,7401 | |
| 0,35 | 97,52 | 2,7549 | 0,9927 | |
| 0,16 | 118,39 | 3,3441 | 0,6066 | |
| 0,15 | 33,10 | 0,9351 | 0,4305 | |
| 0,08 | 13,84 | 0,3910 | 0,3910 | |
| 0,03 | 42,93 | 1,2126 | 0,3214 | |
| 0,06 | 34,37 | 0,9708 | 0,2727 | |
| 0,07 | 22,46 | 0,6343 | 0,2710 | |
| 0,23 | 16,00 | 0,4521 | 0,2542 |
Största minskningarna detta kvartal
Vi använder förändringen i portföljallokeringen eftersom det är det mest meningsfulla måttet. Förändringar kan bero på transaktioner eller förändringar i aktiepriser.
| Värdepapper | Aktier (MM) |
Värde (MM$) |
Portfölj % av | ΔPortfölj % av |
|---|---|---|---|---|
| −34,61 | −0,9776 | −0,9776 | ||
| −34,49 | −0,9743 | −0,9743 | ||
| 1,07 | 218,99 | 6,1861 | −0,8350 | |
| −22,30 | −0,6299 | −0,6299 | ||
| 0,08 | 25,86 | 0,7306 | −0,5552 | |
| 0,29 | 13,59 | 0,3839 | −0,3977 | |
| 0,45 | 49,01 | 1,3845 | −0,3510 | |
| 0,27 | 15,62 | 0,4412 | −0,3453 | |
| 0,81 | 19,59 | 0,5533 | −0,3003 | |
| 0,34 | 24,21 | 0,6838 | −0,2898 |
13F- och fond arkiveringar
Denna blankett lämnades in den 2025-08-19 för rapporteringsperioden 2025-06-30. Klicka på länksymbolen för att se hela transaktionshistoriken.
Uppgradera för att låsa upp premiumdata och exportera till Excel![]() .
.
| Värdepapper | Typ | Genomsnittligt aktiepris | Aktier (MM) |
ΔAktier (%) |
ΔAktier (%) |
Värde ($MM) |
Portfölj (%) |
ΔPortfölj (%) |
|
|---|---|---|---|---|---|---|---|---|---|
| NVDA / NVIDIA Corporation | 1,73 | −0,82 | 273,91 | 44,57 | 7,7372 | 2,1268 | |||
| MSFT / Microsoft Corporation | 0,54 | 2,74 | 267,89 | 36,14 | 7,5674 | 1,7401 | |||
| AAPL / Apple Inc. | 1,07 | 0,00 | 218,99 | −7,64 | 6,1861 | −0,8350 | |||
| AMZN / Amazon.com, Inc. | 0,60 | −8,48 | 130,73 | 5,53 | 3,6928 | 0,0246 | |||
| META / Meta Platforms, Inc. | 0,16 | 0,00 | 118,39 | 28,06 | 3,3441 | 0,6066 | |||
| GOOGL / Alphabet Inc. | 0,62 | 0,00 | 109,06 | 13,96 | 3,0808 | 0,2468 | |||
| AVGO / Broadcom Inc. | 0,35 | −0,46 | 97,52 | 63,88 | 2,7549 | 0,9927 | |||
| TSLA / Tesla, Inc. | 0,19 | −5,84 | 60,61 | 15,41 | 1,7122 | 0,1569 | |||
| JPM / JPMorgan Chase & Co. | 0,19 | −3,28 | 54,63 | 14,31 | 1,5432 | 0,1280 | |||
| GSAXX / Goldman Sachs Trust - Goldman Sachs Financial Square Government Fund | 50,29 | 17,62 | 50,29 | 17,62 | 1,4207 | 0,1544 | |||
| XOM / Exxon Mobil Corporation | 0,45 | −7,74 | 49,01 | −16,37 | 1,3845 | −0,3510 | |||
| V / Visa Inc. | 0,13 | 0,00 | 46,15 | 1,31 | 1,3035 | −0,0453 | |||
| NFLX / Netflix, Inc. | 0,03 | −0,67 | 42,93 | 42,65 | 1,2126 | 0,3214 | |||
| LLY / Eli Lilly and Company | 0,05 | −4,72 | 41,52 | −10,07 | 1,1728 | −0,1944 | |||
| BRK.B / Berkshire Hathaway Inc. | 0,08 | −6,51 | 36,68 | −14,73 | 1,0361 | −0,2377 | |||
| HD / The Home Depot, Inc. | 0,10 | 0,00 | 35,93 | 0,04 | 1,0149 | −0,0486 | |||
| MA / Mastercard Incorporated | 0,06 | 42,21 | 34,37 | 45,79 | 0,9708 | 0,2727 | |||
| CSCO / Cisco Systems, Inc. | 0,49 | 0,00 | 33,95 | 12,43 | 0,9591 | 0,0648 | |||
| ORCL / Oracle Corporation | 0,15 | 24,23 | 33,10 | 94,27 | 0,9351 | 0,4305 | |||
| TDG / TransDigm Group Incorporated | 0,02 | −10,97 | 32,50 | −2,13 | 0,9180 | −0,0653 | |||
| JNJ / Johnson & Johnson | 0,21 | −4,85 | 31,71 | −12,36 | 0,8958 | −0,1758 | |||
| IBM / International Business Machines Corporation | 0,11 | −20,63 | 31,44 | −5,90 | 0,8880 | −0,1013 | |||
| PG / The Procter & Gamble Company | 0,20 | −5,30 | 31,32 | −11,47 | 0,8847 | −0,1629 | |||
| ETN / Eaton Corporation plc | 0,09 | 0,00 | 31,26 | 31,33 | 0,8830 | 0,1781 | |||
| ABBV / AbbVie Inc. | 0,17 | −1,47 | 31,02 | −12,71 | 0,8762 | −0,1761 | |||
| WMT / Walmart Inc. | 0,31 | 16,56 | 30,60 | 29,83 | 0,8644 | 0,1664 | |||
| VZ / Verizon Communications Inc. | 0,67 | −18,35 | 29,05 | −22,11 | 0,8206 | −0,2839 | |||
| COST / Costco Wholesale Corporation | 0,03 | 24,61 | 28,75 | 30,43 | 0,8122 | 0,1594 | |||
| DUK / Duke Energy Corporation | 0,24 | −4,52 | 28,67 | −7,63 | 0,8100 | −0,1092 | |||
| MDT / Medtronic plc | 0,32 | 0,00 | 28,18 | −3,00 | 0,7960 | −0,0642 | |||
| GOOG / Alphabet Inc. | 0,16 | 0,00 | 27,78 | 13,55 | 0,7847 | 0,0602 | |||
| CVX / Chevron Corporation | 0,19 | 0,00 | 27,24 | −14,41 | 0,7694 | −0,1729 | |||
| UNH / UnitedHealth Group Incorporated | 0,08 | 0,00 | 25,86 | −40,44 | 0,7306 | −0,5552 | |||
| TXN / Texas Instruments Incorporated | 0,12 | 0,00 | 24,92 | 15,54 | 0,7039 | 0,0652 | |||
| SO / The Southern Company | 0,27 | −14,83 | 24,82 | −14,94 | 0,7010 | −0,1629 | |||
| PAYX / Paychex, Inc. | 0,17 | 0,00 | 24,32 | −5,72 | 0,6870 | −0,0769 | |||
| KO / The Coca-Cola Company | 0,34 | −25,47 | 24,21 | −26,37 | 0,6838 | −0,2898 | |||
| PLTR / Palantir Technologies Inc. | 0,18 | −1,48 | 24,07 | 59,12 | 0,6798 | 0,2320 | |||
| MCD / McDonald's Corporation | 0,08 | 0,00 | 23,78 | −6,47 | 0,6718 | −0,0812 | |||
| MS / Morgan Stanley | 0,17 | 0,00 | 23,35 | 20,73 | 0,6596 | 0,0869 | |||
| ACGL / Arch Capital Group Ltd. | 0,26 | 48,87 | 23,30 | 40,92 | 0,6582 | 0,1686 | |||
| CAT / Caterpillar Inc. | 0,06 | 0,00 | 23,02 | 17,71 | 0,6503 | 0,0712 | |||
| INTU / Intuit Inc. | 0,03 | 0,00 | 23,01 | 28,28 | 0,6501 | 0,1188 | |||
| ABT / Abbott Laboratories | 0,17 | 0,00 | 22,93 | 2,54 | 0,6477 | −0,0145 | |||
| AXP / American Express Company | 0,07 | 54,39 | 22,46 | 83,05 | 0,6343 | 0,2710 | |||
| CRM / Salesforce, Inc. | 0,08 | 0,00 | 22,26 | 1,61 | 0,6287 | −0,0199 | |||
| D / Dominion Energy, Inc. | 0,39 | 0,00 | 21,91 | 0,81 | 0,6189 | −0,0247 | |||
| GE / General Electric Company | 0,08 | 0,00 | 21,34 | 28,60 | 0,6027 | 0,1114 | |||
| T / AT&T Inc. | 0,71 | −14,60 | 20,54 | −12,60 | 0,5802 | −0,1158 | |||
| LYB / LyondellBasell Industries N.V. | 0,35 | −2,78 | 20,46 | −20,09 | 0,5779 | −0,1803 | |||
| HON / Honeywell International Inc. | 0,09 | 0,00 | 19,79 | 9,98 | 0,5592 | 0,0262 | |||
| BEN / Franklin Resources, Inc. | 0,82 | 0,00 | 19,63 | 23,90 | 0,5546 | 0,0853 | |||
| PFE / Pfizer Inc. | 0,81 | −28,96 | 19,59 | −32,05 | 0,5533 | −0,3003 | |||
| LRCX / Lam Research Corporation | 0,20 | 0,00 | 19,51 | 33,90 | 0,5510 | 0,1196 | |||
| WELL / Welltower Inc. | 0,13 | 0,00 | 19,46 | 0,34 | 0,5496 | −0,0246 | |||
| DHR / Danaher Corporation | 0,10 | 83,76 | 19,31 | 77,09 | 0,5456 | 0,2226 | |||
| QCOM / QUALCOMM Incorporated | 0,12 | −4,92 | 19,21 | −1,42 | 0,5425 | −0,0344 | |||
| KEY / KeyCorp | 1,09 | 0,00 | 19,02 | 8,94 | 0,5373 | 0,0203 | |||
| ITW / Illinois Tool Works Inc. | 0,08 | 0,00 | 18,93 | −0,31 | 0,5348 | −0,0276 | |||
| UPS / United Parcel Service, Inc. | 0,19 | 6,33 | 18,77 | −2,42 | 0,5303 | −0,0394 | |||
| DOW / Dow Inc. | 0,70 | −0,72 | 18,56 | −24,72 | 0,5242 | −0,2058 | |||
| BKNG / Booking Holdings Inc. | 0,00 | 0,00 | 18,53 | 25,66 | 0,5233 | 0,0868 | |||
| AMAT / Applied Materials, Inc. | 0,10 | 0,00 | 18,47 | 26,15 | 0,5218 | 0,0882 | |||
| GILD / Gilead Sciences, Inc. | 0,17 | −11,90 | 18,45 | −12,83 | 0,5211 | −0,1056 | |||
| ADP / Automatic Data Processing, Inc. | 0,06 | 0,00 | 18,22 | 0,94 | 0,5148 | −0,0199 | |||
| RTX / RTX Corporation | 0,12 | 0,00 | 18,21 | 10,24 | 0,5143 | 0,0252 | |||
| MRK / Merck & Co., Inc. | 0,23 | 24,56 | 18,12 | 9,86 | 0,5119 | 0,0234 | |||
| SYK / Stryker Corporation | 0,04 | 0,00 | 17,27 | 6,28 | 0,4879 | 0,0066 | |||
| ACN / Accenture plc | 0,06 | 0,00 | 17,17 | −4,22 | 0,4850 | −0,0458 | |||
| UBER / Uber Technologies, Inc. | 0,18 | 13,33 | 16,89 | 45,49 | 0,4770 | 0,1315 | |||
| ADI / Analog Devices, Inc. | 0,07 | 0,00 | 16,80 | 18,03 | 0,4747 | 0,0531 | |||
| BLK / BlackRock, Inc. | 0,02 | 0,00 | 16,79 | 10,86 | 0,4742 | 0,0258 | |||
| PRU / Prudential Financial, Inc. | 0,15 | −27,27 | 16,39 | −30,04 | 0,4630 | −0,2307 | |||
| PNC / The PNC Financial Services Group, Inc. | 0,09 | 0,00 | 16,37 | 6,06 | 0,4624 | 0,0053 | |||
| ISRG / Intuitive Surgical, Inc. | 0,03 | −7,71 | 16,35 | 1,26 | 0,4618 | −0,0163 | |||
| BA / The Boeing Company | 0,08 | 75,61 | 16,04 | 90,66 | 0,4532 | 0,2002 | |||
| IP / International Paper Company | 0,34 | −0,00 | 16,02 | −12,22 | 0,4524 | −0,0879 | |||
| CVS / CVS Health Corporation | 0,23 | 48,29 | 16,00 | 127,90 | 0,4521 | 0,2542 | |||
| PEP / PepsiCo, Inc. | 0,12 | 0,00 | 15,96 | −11,94 | 0,4507 | −0,0858 | |||
| MO / Altria Group, Inc. | 0,27 | −39,80 | 15,62 | −41,19 | 0,4412 | −0,3453 | |||
| BX / Blackstone Inc. | 0,10 | 13,23 | 15,29 | 21,17 | 0,4320 | 0,0582 | |||
| SBUX / Starbucks Corporation | 0,17 | 0,00 | 15,18 | −6,59 | 0,4289 | −0,0524 | |||
| KMI / Kinder Morgan, Inc. | 0,51 | 27,92 | 14,86 | 31,82 | 0,4198 | 0,0860 | |||
| ARES / Ares Management Corporation | 0,08 | 0,00 | 14,69 | 18,14 | 0,4149 | 0,0467 | |||
| ORI / Old Republic International Corporation | 0,38 | 0,00 | 14,66 | −1,99 | 0,4141 | −0,0288 | |||
| NOW / ServiceNow, Inc. | 0,01 | −23,21 | 14,58 | −0,84 | 0,4117 | −0,0235 | |||
| AMCR / Amcor plc | 1,56 | 0,00 | 14,32 | −5,25 | 0,4044 | −0,0431 | |||
| TJX / The TJX Companies, Inc. | 0,11 | 0,00 | 14,18 | 1,39 | 0,4005 | −0,0136 | |||
| PM / Philip Morris International Inc. | 0,08 | 13,84 | 0,3910 | 0,3910 | |||||
| USB / U.S. Bancorp | 0,30 | 0,00 | 13,75 | 7,18 | 0,3884 | 0,0085 | |||
| WMB / The Williams Companies, Inc. | 0,22 | 0,00 | 13,65 | 5,10 | 0,3857 | 0,0010 | |||
| BMY / Bristol-Myers Squibb Company | 0,29 | −32,16 | 13,59 | −48,51 | 0,3839 | −0,3977 | |||
| CRWD / CrowdStrike Holdings, Inc. | 0,03 | −2,07 | 13,47 | 41,46 | 0,3804 | 0,0985 | |||
| TROW / T. Rowe Price Group, Inc. | 0,14 | 19,22 | 13,43 | 25,23 | 0,3793 | 0,0618 | |||
| C / Citigroup Inc. | 0,15 | −20,59 | 13,17 | −4,78 | 0,3720 | −0,0375 | |||
| DRI / Darden Restaurants, Inc. | 0,06 | 0,00 | 13,08 | 4,92 | 0,3694 | 0,0003 | |||
| AMGN / Amgen Inc. | 0,05 | 0,00 | 13,08 | −10,38 | 0,3694 | −0,0627 | |||
| LOW / Lowe's Companies, Inc. | 0,06 | 0,00 | 12,93 | −4,87 | 0,3653 | −0,0373 | |||
| KMB / Kimberly-Clark Corporation | 0,10 | −27,08 | 12,44 | −33,90 | 0,3514 | −0,2059 | |||
| OKE / ONEOK, Inc. | 0,15 | 0,00 | 12,24 | −17,73 | 0,3459 | −0,0948 | |||
| KHC / The Kraft Heinz Company | 0,47 | −16,58 | 12,23 | −29,22 | 0,3454 | −0,1661 | |||
| UNP / Union Pacific Corporation | 0,05 | 0,00 | 12,20 | −2,60 | 0,3445 | −0,0263 | |||
| AMD / Advanced Micro Devices, Inc. | 0,09 | −45,99 | 12,08 | −25,40 | 0,3412 | −0,1383 | |||
| PLD / Prologis, Inc. | 0,11 | −15,96 | 11,77 | −20,98 | 0,3324 | −0,1086 | |||
| WFC / Wells Fargo & Company | 0,14 | −53,34 | 11,59 | −37,05 | 0,3273 | −0,2206 | |||
| JHG / Janus Henderson Group plc | 0,30 | 0,00 | 11,52 | 7,44 | 0,3255 | 0,0079 | |||
| CMCSA / Comcast Corporation | 0,32 | −18,58 | 11,44 | −25,80 | 0,3232 | −0,1358 | |||
| EQIX / Equinix, Inc. | 0,01 | 0,00 | 11,22 | −2,44 | 0,3169 | −0,0236 | |||
| AMT / American Tower Corporation | 0,05 | 72,16 | 11,07 | 74,87 | 0,3128 | 0,1253 | |||
| TGT / Target Corporation | 0,11 | 29,74 | 10,93 | 22,64 | 0,3088 | 0,0448 | |||
| KVUE / Kenvue Inc. | 0,48 | −24,23 | 10,13 | −33,86 | 0,2862 | −0,1675 | |||
| OGE / OGE Energy Corp. | 0,19 | 0,00 | 8,57 | −3,44 | 0,2420 | −0,0207 | |||
| EQH / Equitable Holdings, Inc. | 0,14 | 0,00 | 7,72 | 7,70 | 0,2181 | 0,0058 | |||
| CAG / Conagra Brands, Inc. | 0,35 | 0,00 | 7,07 | −23,25 | 0,1998 | −0,0731 | |||
| FNF / Fidelity National Financial, Inc. | 0,12 | 0,00 | 6,80 | −13,85 | 0,1921 | −0,0417 | |||
| MSM / MSC Industrial Direct Co., Inc. | 0,08 | 0,00 | 6,67 | 9,46 | 0,1885 | 0,0080 | |||
| AMH / American Homes 4 Rent | 0,18 | 0,00 | 6,47 | −4,60 | 0,1827 | −0,0181 | |||
| SCCO / Southern Copper Corporation | 0,06 | 0,99 | 6,08 | 9,33 | 0,1718 | 0,0071 | |||
| WSM / Williams-Sonoma, Inc. | 0,03 | 600,00 | 5,03 | 623,88 | 0,1421 | 0,1215 | |||
| WSO / Watsco, Inc. | 0,01 | 0,00 | 4,64 | −13,12 | 0,1310 | −0,0271 | |||
| US21871X1090 / Corebridge Financial, Inc. | 0,11 | 0,00 | 3,93 | 12,45 | 0,1110 | 0,0075 | |||
| AVT / Avnet, Inc. | 0,07 | 0,00 | 3,68 | 10,38 | 0,1039 | 0,0052 | |||
| WU / The Western Union Company | 0,43 | 0,00 | 3,60 | −20,41 | 0,1016 | −0,0322 | |||
| DKS / DICK'S Sporting Goods, Inc. | 0,02 | 0,00 | 3,58 | −1,86 | 0,1011 | −0,0069 | |||
| COLB / Columbia Banking System, Inc. | 0,15 | 0,00 | 3,40 | −6,26 | 0,0960 | −0,0114 | |||
| H / Hyatt Hotels Corporation | 0,02 | 0,00 | 2,92 | 14,01 | 0,0825 | 0,0066 | |||
| HUBS / HubSpot, Inc. | 0,00 | −25,31 | 2,74 | −27,22 | 0,0775 | −0,0341 | |||
| R / Ryder System, Inc. | 0,02 | 0,00 | 2,62 | 10,58 | 0,0741 | 0,0038 | |||
| FAF / First American Financial Corporation | 0,04 | 0,00 | 2,62 | −6,44 | 0,0739 | −0,0089 | |||
| JEF / Jefferies Financial Group Inc. | 0,04 | 0,00 | 2,44 | 2,09 | 0,0691 | −0,0019 | |||
| ZS / Zscaler, Inc. | 0,01 | −45,92 | 2,19 | −14,43 | 0,0620 | −0,0140 | |||
| BAH / Booz Allen Hamilton Holding Corporation | 0,02 | 0,00 | 2,18 | −0,46 | 0,0616 | −0,0033 | |||
| NET / Cloudflare, Inc. | 0,01 | −19,93 | 2,18 | 39,14 | 0,0616 | 0,0152 | |||
| SON / Sonoco Products Company | 0,04 | 0,00 | 1,93 | −7,77 | 0,0546 | −0,0075 | |||
| MELI / MercadoLibre, Inc. | 0,00 | 0,00 | 1,88 | 34,00 | 0,0530 | 0,0115 | |||
| OWL / Blue Owl Capital Inc. | 0,08 | 0,00 | 1,61 | −4,18 | 0,0454 | −0,0042 | |||
| TEAM / Atlassian Corporation | 0,01 | −19,95 | 1,59 | −23,38 | 0,0450 | −0,0166 | |||
| PAG / Penske Automotive Group, Inc. | 0,01 | 0,00 | 1,55 | 19,38 | 0,0437 | 0,0053 | |||
| CNA / CNA Financial Corporation | 0,03 | 0,00 | 1,50 | −8,41 | 0,0425 | −0,0061 | |||
| RGEN / Repligen Corporation | 0,01 | −46,24 | 1,43 | −47,47 | 0,0404 | −0,0402 | |||
| HRB / H&R Block, Inc. | 0,02 | 0,00 | 1,36 | 0,00 | 0,0385 | −0,0019 | |||
| ARMK / Aramark | 0,03 | 0,00 | 1,35 | 21,29 | 0,0381 | 0,0052 | |||
| AFG / American Financial Group, Inc. | 0,01 | 0,00 | 1,30 | −3,92 | 0,0367 | −0,0033 | |||
| MAN / ManpowerGroup Inc. | 0,03 | 0,00 | 1,28 | −30,22 | 0,0363 | −0,0182 | |||
| GLPI / Gaming and Leisure Properties, Inc. | 0,03 | 0,00 | 1,27 | −8,28 | 0,0360 | −0,0052 | |||
| EVR / Evercore Inc. | 0,00 | 0,00 | 1,27 | 35,29 | 0,0358 | 0,0081 | |||
| FLO / Flowers Foods, Inc. | 0,08 | 0,00 | 1,25 | −15,92 | 0,0352 | −0,0087 | |||
| DOX / Amdocs Limited | 0,01 | 0,00 | 1,23 | −0,32 | 0,0348 | −0,0018 | |||
| AFRM / Affirm Holdings, Inc. | 0,02 | 0,00 | 1,23 | 53,05 | 0,0347 | 0,0109 | |||
| CG / The Carlyle Group Inc. | 0,02 | 0,00 | 1,20 | 17,84 | 0,0340 | 0,0038 | |||
| RBLX / Roblox Corporation | 0,01 | −9,39 | 1,13 | 63,44 | 0,0320 | 0,0115 | |||
| UNM / Unum Group | 0,01 | 0,00 | 1,08 | −0,82 | 0,0306 | −0,0018 | |||
| DDOG / Datadog, Inc. | 0,01 | −66,14 | 1,00 | −54,14 | 0,0281 | −0,0362 | |||
| FNB / F.N.B. Corporation | 0,07 | 0,00 | 0,96 | 8,46 | 0,0272 | 0,0009 | |||
| PEN / Penumbra, Inc. | 0,00 | 0,00 | 0,96 | −4,00 | 0,0271 | −0,0025 | |||
| AXS / AXIS Capital Holdings Limited | 0,01 | 0,00 | 0,91 | 3,51 | 0,0258 | −0,0003 | |||
| SGI / Somnigroup International Inc. | 0,01 | 0,00 | 0,86 | 13,66 | 0,0242 | 0,0019 | |||
| MTN / Vail Resorts, Inc. | 0,01 | 0,00 | 0,85 | −1,85 | 0,0240 | −0,0016 | |||
| MDU / MDU Resources Group, Inc. | 0,05 | 0,00 | 0,84 | −1,41 | 0,0238 | −0,0015 | |||
| U / Unity Software Inc. | 0,03 | −0,01 | 0,82 | 23,46 | 0,0232 | 0,0035 | |||
| CFR / Cullen/Frost Bankers, Inc. | 0,01 | 0,00 | 0,81 | 2,66 | 0,0229 | −0,0005 | |||
| ECG / Everus Construction Group, Inc. | 0,01 | 0,00 | 0,80 | 71,37 | 0,0227 | 0,0088 | |||
| DKNG / DraftKings Inc. | 0,02 | 0,00 | 0,78 | 29,16 | 0,0222 | 0,0042 | |||
| CUBE / CubeSmart | 0,02 | 0,00 | 0,73 | −0,55 | 0,0205 | −0,0011 | |||
| HUN / Huntsman Corporation | 0,07 | 0,00 | 0,70 | −33,96 | 0,0197 | −0,0116 | |||
| S+P500 EMINI FUT SEP25 / DE (000000000) | 0,58 | 0,0164 | 0,0164 | ||||||
| SLM / SLM Corporation | 0,02 | 0,00 | 0,58 | 11,82 | 0,0163 | 0,0010 | |||
| DTM / DT Midstream, Inc. | 0,01 | 0,00 | 0,57 | 13,97 | 0,0161 | 0,0013 | |||
| THG / The Hanover Insurance Group, Inc. | 0,00 | 0,00 | 0,56 | −2,44 | 0,0158 | −0,0012 | |||
| REYN / Reynolds Consumer Products Inc. | 0,03 | 0,00 | 0,56 | −10,13 | 0,0158 | −0,0026 | |||
| BC / Brunswick Corporation | 0,01 | 0,00 | 0,51 | 2,60 | 0,0145 | −0,0003 | |||
| XYZ / Block, Inc. | 0,01 | 0,00 | 0,49 | 25,19 | 0,0139 | 0,0022 | |||
| CFLT / Confluent, Inc. | 0,02 | 0,00 | 0,46 | 6,42 | 0,0131 | 0,0002 | |||
| WPC / W. P. Carey Inc. | 0,01 | 0,00 | 0,44 | −1,34 | 0,0125 | −0,0008 | |||
| FR / First Industrial Realty Trust, Inc. | 0,01 | 0,00 | 0,44 | −10,89 | 0,0125 | −0,0022 | |||
| TNL / Travel + Leisure Co. | 0,01 | 0,00 | 0,41 | 11,35 | 0,0117 | 0,0007 | |||
| VMI / Valmont Industries, Inc. | 0,00 | 0,00 | 0,39 | 14,33 | 0,0111 | 0,0009 | |||
| HOOD / Robinhood Markets, Inc. | 0,00 | 0,00 | 0,39 | 125,73 | 0,0109 | 0,0058 | |||
| FOUR / Shift4 Payments, Inc. | 0,00 | 0,00 | 0,38 | 21,29 | 0,0106 | 0,0014 | |||
| BRX / Brixmor Property Group Inc. | 0,01 | 0,00 | 0,37 | −1,85 | 0,0105 | −0,0007 | |||
| BRKR / Bruker Corporation | 0,01 | 0,00 | 0,37 | −1,35 | 0,0104 | −0,0006 | |||
| FLS / Flowserve Corporation | 0,01 | 0,00 | 0,37 | 7,33 | 0,0104 | 0,0002 | |||
| ESTC / Elastic N.V. | 0,00 | −28,00 | 0,36 | −31,84 | 0,0103 | −0,0055 | |||
| NNN / NNN REIT, Inc. | 0,01 | 0,00 | 0,36 | 1,42 | 0,0101 | −0,0004 | |||
| ROKU / Roku, Inc. | 0,00 | 0,00 | 0,35 | 24,64 | 0,0099 | 0,0016 | |||
| SOFI / SoFi Technologies, Inc. | 0,02 | 0,00 | 0,34 | 56,68 | 0,0096 | 0,0032 | |||
| LECO / Lincoln Electric Holdings, Inc. | 0,00 | 0,00 | 0,33 | 9,60 | 0,0094 | 0,0004 | |||
| OMF / OneMain Holdings, Inc. | 0,01 | 0,00 | 0,32 | 16,85 | 0,0090 | 0,0009 | |||
| GAP / The Gap, Inc. | 0,01 | 0,00 | 0,29 | 5,80 | 0,0083 | 0,0001 | |||
| TTD / The Trade Desk, Inc. | 0,00 | 0,00 | 0,25 | 31,41 | 0,0071 | 0,0014 | |||
| CRI / Carter's, Inc. | 0,01 | 0,00 | 0,21 | −26,57 | 0,0060 | −0,0025 | |||
| WMS / Advanced Drainage Systems, Inc. | 0,00 | 0,00 | 0,21 | 5,64 | 0,0058 | 0,0000 | |||
| FHB / First Hawaiian, Inc. | 0,01 | 0,00 | 0,18 | 2,25 | 0,0051 | −0,0001 | |||
| SUI / Sun Communities, Inc. | 0,00 | 0,00 | 0,15 | −1,96 | 0,0043 | −0,0003 | |||
| APP / AppLovin Corporation | 0,00 | 0,00 | 0,14 | 33,33 | 0,0040 | 0,0008 | |||
| MRVL / Marvell Technology, Inc. | 0,00 | 0,00 | 0,14 | 25,93 | 0,0038 | 0,0006 | |||
| NTRA / Natera, Inc. | 0,00 | −58,27 | 0,12 | −50,41 | 0,0035 | −0,0038 | |||
| ADT / ADT Inc. | 0,01 | 0,00 | 0,12 | 4,55 | 0,0033 | −0,0000 | |||
| BILL / BILL Holdings, Inc. | 0,00 | −71,31 | 0,11 | −71,17 | 0,0031 | −0,0083 | |||
| HR / Healthcare Realty Trust Incorporated | 0,01 | 0,00 | 0,11 | −6,14 | 0,0030 | −0,0004 | |||
| MSA / MSA Safety Incorporated | 0,00 | 0,00 | 0,10 | 13,64 | 0,0028 | 0,0002 | |||
| S / SentinelOne, Inc. | 0,00 | −66,22 | 0,09 | −66,02 | 0,0025 | −0,0051 | |||
| W / Wayfair Inc. | 0,00 | 0,00 | 0,07 | 61,36 | 0,0020 | 0,0007 | |||
| BLD / TopBuild Corp. | 0,00 | 0,00 | 0,06 | 6,67 | 0,0018 | 0,0000 | |||
| VAC / Marriott Vacations Worldwide Corporation | 0,00 | 0,00 | 0,05 | 13,64 | 0,0014 | 0,0001 | |||
| WBS / Webster Financial Corporation | 0,00 | 0,00 | 0,03 | 6,67 | 0,0009 | 0,0000 | |||
| CAR / Avis Budget Group, Inc. | 0,00 | 0,00 | 0,02 | 128,57 | 0,0005 | 0,0003 | |||
| CONTRA MIRATI THERAPEU / DE (604CVR027) | 0,00 | 0,00 | 0,00 | 0,00 | 0,0001 | −0,0000 | |||
| REXR / Rexford Industrial Realty, Inc. | 0,00 | −99,97 | 0,00 | −100,00 | 0,0000 | −0,0950 | |||
| OHI / Omega Healthcare Investors, Inc. | 0,00 | 0,00 | 0,00 | 0,0000 | −0,0000 | ||||
| TXG / 10x Genomics, Inc. | 0,00 | 0,00 | 0,00 | 0,0000 | 0,0000 | ||||
| AZTA / Azenta, Inc. | 0,00 | 0,00 | 0,00 | 0,0000 | −0,0000 | ||||
| OKTA / Okta, Inc. | 0,00 | 0,00 | 0,00 | 0,0000 | −0,0000 | ||||
| RYN / Rayonier Inc. | 0,00 | −99,94 | 0,00 | −100,00 | 0,0000 | −0,0027 | |||
| KD / Kyndryl Holdings, Inc. | 0,00 | −50,00 | 0,00 | 0,0000 | −0,0000 | ||||
| S+P 500 INDEX / DE (000000000) | −22,30 | −0,6299 | −0,6299 | ||||||
| S+P 500 INDEX / DE (000000000) | −34,49 | −0,9743 | −0,9743 | ||||||
| S+P 500 INDEX / DE (000000000) | −34,61 | −0,9776 | −0,9776 |