Grundläggande statistik
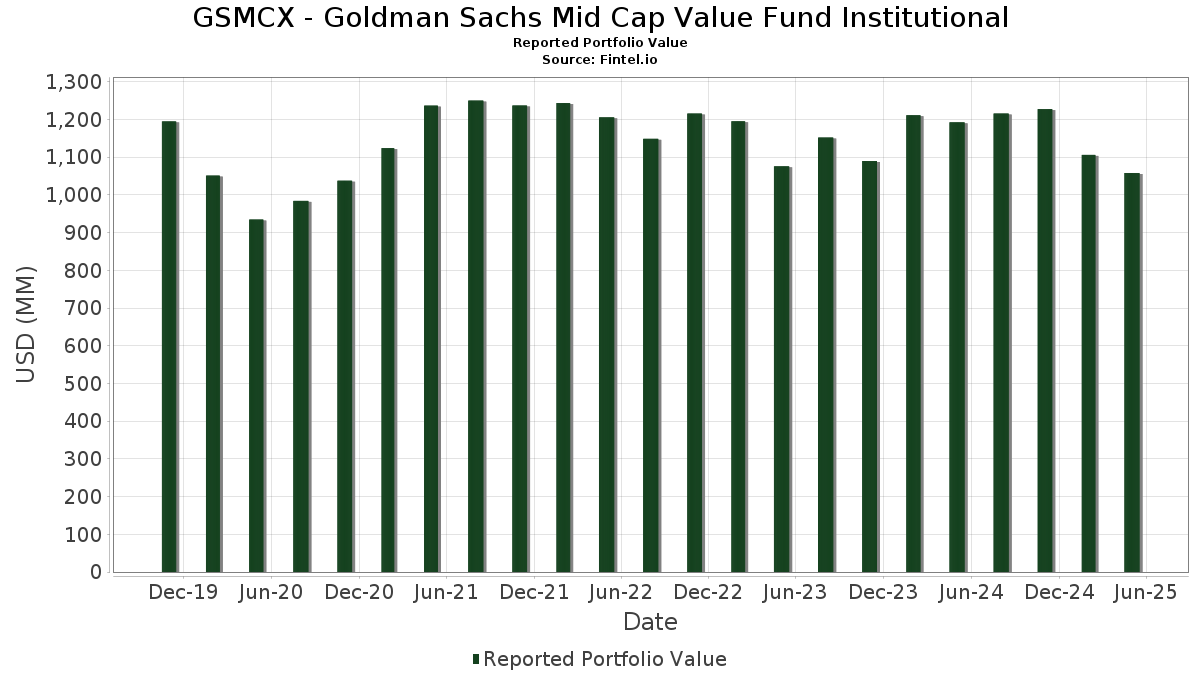
| Portföljvärde | $ 1 058 101 561 |
| Aktuella positioner | 100 |
Senaste innehav, resultat, förvaltat kapital (från 13F, 13D)
GSMCX - Goldman Sachs Mid Cap Value Fund Institutional har redovisat 100 totala innehav i sina senaste SEC-arkiveringar. Det senaste portföljvärdet beräknas vara $ 1 058 101 561 USD. Faktiskt förvaltade tillgångar (AUM) är detta värde plus likvida medel (som inte redovisas). GSMCX - Goldman Sachs Mid Cap Value Fund Institutionals största innehav är GE Vernova Inc. (US:GEV) , AMETEK, Inc. (US:AME) , Rockwell Automation, Inc. (US:ROK) , COCA COLA EUROPACIFIC COMPANY GUAR REGS 11/27 1.5 (UK:CCEP) , and BJ's Wholesale Club Holdings, Inc. (US:BJ) . GSMCX - Goldman Sachs Mid Cap Value Fund Institutionals nya positioner inkluderar Wintrust Financial Corporation (US:WTFC) , TKO Group Holdings, Inc. (US:TKO) , Kinetik Holdings Inc. (US:KNTK) , .
Största ökningarna detta kvartal
Vi använder förändringen i portföljallokeringen eftersom det är det mest meningsfulla måttet. Förändringar kan bero på transaktioner eller förändringar i aktiekurser.
| Värdepapper | Aktier (MM) |
Värde (MM$) |
Portfölj % av | ΔPortfölj % av |
|---|---|---|---|---|
| 21,94 | 21,94 | 2,0723 | 1,3670 | |
| 0,09 | 10,70 | 1,0107 | 1,0107 | |
| 0,26 | 12,66 | 1,1959 | 0,7766 | |
| 0,05 | 11,00 | 1,0393 | 0,7732 | |
| 0,37 | 15,09 | 1,4249 | 0,7213 | |
| 0,10 | 6,79 | 0,6414 | 0,6414 | |
| 0,04 | 6,36 | 0,6008 | 0,6008 | |
| 0,08 | 19,06 | 1,8000 | 0,5958 | |
| 0,11 | 5,08 | 0,4800 | 0,4800 | |
| 0,08 | 13,51 | 1,2754 | 0,3582 |
Största minskningarna detta kvartal
Vi använder förändringen i portföljallokeringen eftersom det är det mest meningsfulla måttet. Förändringar kan bero på transaktioner eller förändringar i aktiepriser.
| Värdepapper | Aktier (MM) |
Värde (MM$) |
Portfölj % av | ΔPortfölj % av |
|---|---|---|---|---|
| 0,17 | 9,93 | 0,9382 | −0,8183 | |
| 0,05 | 5,42 | 0,5117 | −0,5907 | |
| 0,12 | 13,03 | 1,2306 | −0,5544 | |
| 0,09 | 5,80 | 0,5476 | −0,4445 | |
| 0,15 | 12,30 | 1,1616 | −0,3806 | |
| 0,05 | 11,90 | 1,1238 | −0,3770 | |
| 0,21 | 14,44 | 1,3640 | −0,3760 | |
| 0,01 | 8,90 | 0,8406 | −0,3729 | |
| 0,83 | 10,50 | 0,9914 | −0,3655 | |
| 0,04 | 10,34 | 0,9768 | −0,3257 |
13F- och fond arkiveringar
Denna blankett lämnades in den 2025-07-22 för rapporteringsperioden 2025-05-31. Klicka på länksymbolen för att se hela transaktionshistoriken.
Uppgradera för att låsa upp premiumdata och exportera till Excel![]() .
.
| Värdepapper | Typ | Genomsnittligt aktiepris | Aktier (MM) |
ΔAktier (%) |
ΔAktier (%) |
Värde ($MM) |
Portfölj (%) |
ΔPortfölj (%) |
|
|---|---|---|---|---|---|---|---|---|---|
| GEV / GE Vernova Inc. | 0,05 | −22,02 | 25,76 | 10,04 | 2,4323 | 0,3204 | |||
| AME / AMETEK, Inc. | 0,14 | 5,55 | 25,73 | −0,33 | 2,4299 | 0,1005 | |||
| ROK / Rockwell Automation, Inc. | 0,08 | −0,86 | 24,46 | 8,94 | 2,3099 | 0,2841 | |||
| CCEP / COCA COLA EUROPACIFIC COMPANY GUAR REGS 11/27 1.5 | 0,25 | −0,86 | 23,23 | 5,49 | 2,1940 | 0,2070 | |||
| BJ / BJ's Wholesale Club Holdings, Inc. | 0,20 | −0,86 | 22,73 | 10,84 | 2,1469 | 0,2963 | |||
| US38141W2733 / Goldman Sachs Financial Square Funds - Government Fund | 21,94 | 180,72 | 21,94 | 180,71 | 2,0723 | 1,3670 | |||
| FIS / Fidelity National Information Services, Inc. | 0,25 | −23,26 | 20,23 | −14,10 | 1,9103 | −0,2143 | |||
| NI / NiSource Inc. | 0,50 | −0,86 | 19,86 | −3,94 | 1,8751 | 0,0100 | |||
| MLM / Martin Marietta Materials, Inc. | 0,04 | −0,86 | 19,75 | 12,35 | 1,8648 | 0,2790 | |||
| LHX / L3Harris Technologies, Inc. | 0,08 | 20,47 | 19,06 | 42,81 | 1,8000 | 0,5958 | |||
| DT / Dynatrace, Inc. | 0,31 | 13,12 | 16,87 | 6,72 | 1,5932 | 0,1668 | |||
| RJF / Raymond James Financial, Inc. | 0,11 | −0,86 | 16,79 | −5,79 | 1,5857 | −0,0224 | |||
| STLD / Steel Dynamics, Inc. | 0,13 | −0,86 | 16,46 | −9,67 | 1,5541 | −0,0897 | |||
| PSX / Phillips 66 | 0,14 | 18,89 | 16,12 | 4,03 | 1,5226 | 0,1243 | |||
| URI / United Rentals, Inc. | 0,02 | −0,86 | 15,87 | 9,33 | 1,4983 | 0,1890 | |||
| EXE / Expand Energy Corporation | 0,14 | −0,86 | 15,75 | 16,43 | 1,4871 | 0,2668 | |||
| ALL / The Allstate Corporation | 0,07 | −18,14 | 15,68 | −13,74 | 1,4809 | −0,1592 | |||
| MNDY / monday.com Ltd. | 0,05 | −0,86 | 15,42 | −0,63 | 1,4561 | 0,0562 | |||
| CMS / CMS Energy Corporation | 0,22 | −0,86 | 15,38 | −4,69 | 1,4526 | −0,0035 | |||
| VICI / VICI Properties Inc. | 0,48 | −0,86 | 15,15 | −3,24 | 1,4309 | 0,0180 | |||
| FAST / Fastenal Company | 0,37 | 98,28 | 15,15 | 8,24 | 1,4305 | 0,1678 | |||
| CFG / Citizens Financial Group, Inc. | 0,37 | 119,48 | 15,09 | 93,49 | 1,4249 | 0,7213 | |||
| PEG / Public Service Enterprise Group Incorporated | 0,18 | −0,86 | 14,82 | −1,01 | 1,3992 | 0,0488 | |||
| COO / The Cooper Companies, Inc. | 0,21 | −0,86 | 14,44 | −25,10 | 1,3640 | −0,3760 | |||
| AVB / AvalonBay Communities, Inc. | 0,07 | −0,86 | 14,44 | −9,37 | 1,3640 | −0,0739 | |||
| PPL / PPL Corporation | 0,41 | 22,69 | 14,16 | 21,08 | 1,3370 | 0,2821 | |||
| DLR / Digital Realty Trust, Inc. | 0,08 | 21,08 | 13,51 | 32,86 | 1,2754 | 0,3582 | |||
| MCHP / Microchip Technology Incorporated | 0,23 | −14,87 | 13,25 | −16,06 | 1,2517 | −0,1730 | |||
| MTB / M&T Bank Corporation | 0,07 | −0,86 | 13,08 | −5,56 | 1,2351 | −0,0144 | |||
| LEN / Lennar Corporation | 0,12 | −25,72 | 13,03 | −34,13 | 1,2306 | −0,5544 | |||
| NDAQ / Nasdaq, Inc. | 0,15 | −0,86 | 12,84 | 0,05 | 1,2126 | 0,0546 | |||
| RPM / RPM International Inc. | 0,11 | 12,65 | 12,78 | 3,52 | 1,2068 | 0,0929 | |||
| IP / International Paper Company | 0,26 | 221,20 | 12,66 | 172,56 | 1,1959 | 0,7766 | |||
| UAL / United Airlines Holdings, Inc. | 0,15 | −15,02 | 12,30 | −28,04 | 1,1616 | −0,3806 | |||
| EXR / Extra Space Storage Inc. | 0,08 | −0,86 | 12,28 | −1,78 | 1,1593 | 0,0316 | |||
| PCG / PG&E Corporation | 0,73 | −0,86 | 12,24 | 2,42 | 1,1558 | 0,0776 | |||
| LNG / Cheniere Energy, Inc. | 0,05 | −31,00 | 11,90 | −28,46 | 1,1238 | −0,3770 | |||
| IR / Ingersoll Rand Inc. | 0,14 | −0,86 | 11,55 | −4,53 | 1,0906 | −0,0009 | |||
| KVUE / Kenvue Inc. | 0,46 | 41,88 | 11,07 | 43,52 | 1,0452 | 0,3493 | |||
| UNM / Unum Group | 0,13 | −20,43 | 11,02 | −20,99 | 1,0410 | −0,2178 | |||
| BURL / Burlington Stores, Inc. | 0,05 | 307,58 | 11,00 | 273,14 | 1,0393 | 0,7732 | |||
| PRU / Prudential Financial, Inc. | 0,10 | −0,86 | 10,84 | −10,52 | 1,0236 | −0,0693 | |||
| WTFC / Wintrust Financial Corporation | 0,09 | 10,70 | 1,0107 | 1,0107 | |||||
| PR / Permian Resources Corporation | 0,83 | −22,00 | 10,50 | −30,19 | 0,9914 | −0,3655 | |||
| PFGC / Performance Food Group Company | 0,12 | −0,86 | 10,47 | 4,28 | 0,9891 | 0,0829 | |||
| HBAN / Huntington Bancshares Incorporated | 0,66 | −0,86 | 10,38 | −5,91 | 0,9800 | −0,0152 | |||
| JNPR / Juniper Networks, Inc. | 0,29 | 44,46 | 10,37 | 43,37 | 0,9797 | 0,3269 | |||
| COR / Cencora, Inc. | 0,04 | −37,62 | 10,34 | −28,35 | 0,9768 | −0,3257 | |||
| DTM / DT Midstream, Inc. | 0,10 | −16,72 | 10,26 | −17,80 | 0,9692 | −0,0472 | |||
| MRVL / Marvell Technology, Inc. | 0,17 | −22,15 | 9,93 | −48,97 | 0,9382 | −0,8183 | |||
| ETR / Entergy Corporation | 0,12 | −0,86 | 9,88 | −5,44 | 0,9330 | −0,0097 | |||
| FANG / Diamondback Energy, Inc. | 0,07 | −16,11 | 9,71 | −28,99 | 0,9171 | −0,3168 | |||
| WLK / Westlake Corporation | 0,14 | 12,43 | 9,61 | −28,88 | 0,9071 | −0,3116 | |||
| ORA / Ormat Technologies, Inc. | 0,13 | −0,86 | 9,48 | 5,52 | 0,8956 | 0,0846 | |||
| AJG / Arthur J. Gallagher & Co. | 0,03 | −0,86 | 9,48 | 1,98 | 0,8950 | 0,0565 | |||
| ACGL / Arch Capital Group Ltd. | 0,09 | −0,86 | 9,00 | 1,41 | 0,8497 | 0,0492 | |||
| MTD / Mettler-Toledo International Inc. | 0,01 | −27,10 | 8,90 | −33,82 | 0,8406 | −0,3729 | |||
| OMC / Omnicom Group Inc. | 0,11 | −0,86 | 8,38 | −12,03 | 0,7918 | −0,0681 | |||
| HPE / Hewlett Packard Enterprise Company | 0,48 | −0,86 | 8,30 | −13,53 | 0,7837 | −0,0822 | |||
| BAH / Booz Allen Hamilton Holding Corporation | 0,08 | −22,25 | 8,21 | −1,58 | 0,7754 | 0,1017 | |||
| GL / Globe Life Inc. | 0,07 | 13,91 | 8,12 | 8,93 | 0,7673 | 0,0943 | |||
| RCL / Royal Caribbean Cruises Ltd. | 0,03 | 9,45 | 8,01 | 14,28 | 0,7565 | 0,1241 | |||
| ELS / Equity LifeStyle Properties, Inc. | 0,12 | −0,86 | 7,91 | −8,10 | 0,7465 | −0,0296 | |||
| CPT / Camden Property Trust | 0,07 | −0,86 | 7,82 | −6,11 | 0,7385 | −0,0130 | |||
| AMH / American Homes 4 Rent | 0,21 | −0,86 | 7,79 | 1,39 | 0,7353 | 0,0424 | |||
| FHN / First Horizon Corporation | 0,38 | 99,87 | 7,58 | 84,48 | 0,7161 | 0,3452 | |||
| WST / West Pharmaceutical Services, Inc. | 0,04 | −21,44 | 7,48 | −28,71 | 0,7063 | −0,2402 | |||
| AFG / American Financial Group, Inc. | 0,06 | −0,86 | 7,46 | −2,67 | 0,7050 | 0,0130 | |||
| WWD / Woodward, Inc. | 0,03 | −0,86 | 7,46 | 13,47 | 0,7047 | 0,1114 | |||
| W / Wayfair Inc. | 0,18 | −0,86 | 7,38 | 3,38 | 0,6967 | 0,0528 | |||
| WCN / Waste Connections, Inc. | 0,04 | 9,72 | 6,92 | 13,96 | 0,6538 | 0,1057 | |||
| HUM / Humana Inc. | 0,03 | −0,86 | 6,89 | −14,54 | 0,6505 | −0,0767 | |||
| Aptiv PLC / EC (JE00BTDN8H13) | 0,10 | 6,79 | 0,6414 | 0,6414 | |||||
| ITT / ITT Inc. | 0,04 | −26,48 | 6,74 | −21,64 | 0,6363 | −0,1395 | |||
| DVN / Devon Energy Corporation | 0,22 | 36,01 | 6,61 | 13,65 | 0,6243 | 0,0994 | |||
| IEX / IDEX Corporation | 0,04 | −0,86 | 6,46 | −7,70 | 0,6099 | −0,0215 | |||
| TKO / TKO Group Holdings, Inc. | 0,04 | 6,36 | 0,6008 | 0,6008 | |||||
| VTR / Ventas, Inc. | 0,09 | −0,86 | 6,06 | −7,89 | 0,5720 | −0,0213 | |||
| EXC / Exelon Corporation | 0,13 | −0,86 | 5,88 | −1,71 | 0,5550 | 0,0155 | |||
| US21871X1090 / Corebridge Financial, Inc. | 0,18 | −0,86 | 5,83 | −6,78 | 0,5504 | −0,0137 | |||
| SWK / Stanley Black & Decker, Inc. | 0,09 | −24,77 | 5,80 | −51,92 | 0,5476 | −0,4445 | |||
| PNFP / Pinnacle Financial Partners, Inc. | 0,05 | −52,32 | 5,42 | −55,66 | 0,5117 | −0,5907 | |||
| KNTK / Kinetik Holdings Inc. | 0,11 | 5,08 | 0,4800 | 0,4800 | |||||
| BKV / BKV Corporation | 0,23 | −0,86 | 4,97 | 5,57 | 0,4689 | 0,0445 | |||
| NRA / NRG Energy, Inc. | 0,03 | −0,86 | 4,86 | 46,23 | 0,4585 | 0,1589 | |||
| LW / Lamb Weston Holdings, Inc. | 0,09 | −0,86 | 4,81 | 6,61 | 0,4542 | 0,0472 | |||
| WDC / Western Digital Corporation | 0,09 | 152,65 | 4,58 | 166,18 | 0,4327 | 0,2774 | |||
| A / Agilent Technologies, Inc. | 0,04 | −0,86 | 4,46 | −13,25 | 0,4210 | −0,0427 | |||
| TAP / Molson Coors Beverage Company | 0,08 | −0,86 | 4,30 | −13,32 | 0,4062 | −0,0415 | |||
| UGI / UGI Corporation | 0,12 | −0,86 | 4,26 | 4,67 | 0,4023 | 0,0350 | |||
| GPN / Global Payments Inc. | 0,05 | −0,86 | 3,81 | −28,80 | 0,3596 | −0,1229 | |||
| FND / Floor & Decor Holdings, Inc. | 0,05 | −0,86 | 3,76 | −26,44 | 0,3553 | −0,1062 | |||
| CC / The Chemours Company | 0,35 | 40,01 | 3,56 | −5,14 | 0,3363 | −0,0024 | |||
| SAIA / Saia, Inc. | 0,01 | −0,87 | 3,44 | −35,99 | 0,3253 | −0,1602 | |||
| MSTR / Strategy Inc | 0,01 | −0,87 | 3,43 | 43,25 | 0,3235 | 0,1077 | |||
| OVV / Ovintiv Inc. | 0,09 | −0,86 | 3,32 | −18,30 | 0,3134 | −0,0530 | |||
| RPRX / Royalty Pharma plc | 0,09 | −0,86 | 2,80 | −3,11 | 0,2648 | 0,0037 | |||
| LYB / LyondellBasell Industries N.V. | 0,05 | −0,86 | 2,59 | −27,11 | 0,2443 | −0,0759 | |||
| OGN / Organon & Co. | 0,14 | −0,86 | 1,29 | −38,69 | 0,1216 | −0,0679 | |||
| SNDK / Sandisk Corporation | 0,01 | −0,86 | 0,44 | −20,22 | 0,0414 | −0,0082 |