Grundläggande statistik
| Portföljvärde | $ 434 325 |
| Aktuella positioner | 123 |
Senaste innehav, resultat, förvaltat kapital (från 13F, 13D)
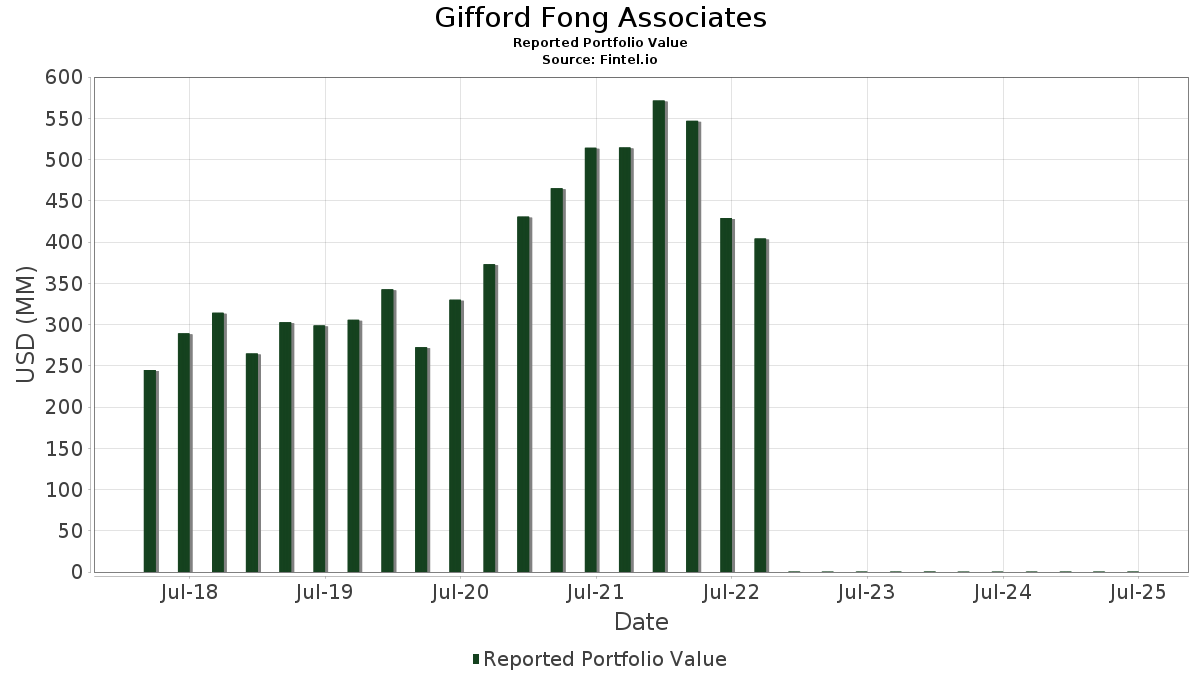
Gifford Fong Associates har redovisat 123 totala innehav i sina senaste SEC-arkiveringar. Det senaste portföljvärdet beräknas vara $ 434 325 USD. Faktiskt förvaltade tillgångar (AUM) är detta värde plus likvida medel (som inte redovisas). Gifford Fong Associatess största innehav är NVIDIA Corporation (US:NVDA) , Amazon.com, Inc. (US:AMZN) , Microsoft Corporation (US:MSFT) , Apple Inc. (US:AAPL) , and Meta Platforms, Inc. (US:META) .
Största ökningarna detta kvartal
Vi använder förändringen i portföljallokeringen eftersom det är det mest meningsfulla måttet. Förändringar kan bero på transaktioner eller förändringar i aktiekurser.
| Värdepapper | Aktier (MM) |
Värde (MM$) |
Portfölj % av | ΔPortfölj % av |
|---|---|---|---|---|
| 0,28 | 0,04 | 10,0473 | 1,9252 | |
| 0,03 | 0,02 | 3,9284 | 0,7246 | |
| 0,02 | 0,02 | 3,8236 | 0,5972 | |
| 0,04 | 0,01 | 1,8751 | 0,5793 | |
| 0,01 | 0,01 | 1,1666 | 0,4394 | |
| 0,04 | 0,01 | 2,2697 | 0,3624 | |
| 0,05 | 0,01 | 1,5785 | 0,3435 | |
| 0,10 | 0,02 | 4,8892 | 0,3073 | |
| 0,13 | 0,01 | 2,0296 | 0,2900 | |
| 0,01 | 0,01 | 1,3036 | 0,2164 |
Största minskningarna detta kvartal
Vi använder förändringen i portföljallokeringen eftersom det är det mest meningsfulla måttet. Förändringar kan bero på transaktioner eller förändringar i aktiepriser.
| Värdepapper | Aktier (MM) |
Värde (MM$) |
Portfölj % av | ΔPortfölj % av |
|---|---|---|---|---|
| 0,01 | 0,00 | 0,2298 | −0,7181 | |
| 0,08 | 0,02 | 3,8342 | −0,6517 | |
| 0,03 | 0,01 | 2,9639 | −0,5474 | |
| 0,09 | 0,00 | 0,6242 | −0,3869 | |
| 0,07 | 0,00 | 0,6700 | −0,3712 | |
| 0,01 | 0,00 | 0,4250 | −0,3463 | |
| 0,06 | 0,01 | 1,5406 | −0,2961 | |
| 0,03 | 0,01 | 1,1924 | −0,2621 | |
| 0,04 | 0,00 | 0,8530 | −0,2255 | |
| 0,02 | 0,00 | 0,7319 | −0,1921 |
13F- och fond arkiveringar
Denna blankett lämnades in den 2025-08-13 för rapporteringsperioden 2025-06-30. Klicka på länksymbolen för att se hela transaktionshistoriken.
Uppgradera för att låsa upp premiumdata och exportera till Excel![]() .
.
| Värdepapper | Typ | Genomsnittligt aktiepris | Aktier (MM) |
ΔAktier (%) |
ΔAktier (%) |
Värde ($MM) |
Portfölj (%) |
ΔPortfölj (%) |
|
|---|---|---|---|---|---|---|---|---|---|
| NVDA / NVIDIA Corporation | 0,28 | −8,30 | 0,04 | 34,38 | 10,0473 | 1,9252 | |||
| AMZN / Amazon.com, Inc. | 0,10 | 0,00 | 0,02 | 16,67 | 4,8892 | 0,3073 | |||
| MSFT / Microsoft Corporation | 0,03 | 0,00 | 0,02 | 41,67 | 3,9284 | 0,7246 | |||
| AAPL / Apple Inc. | 0,08 | 0,00 | 0,02 | −11,11 | 3,8342 | −0,6517 | |||
| META / Meta Platforms, Inc. | 0,02 | 0,00 | 0,02 | 33,33 | 3,8236 | 0,5972 | |||
| BRK.B / Berkshire Hathaway Inc. | 0,03 | 0,00 | 0,01 | −14,29 | 2,9639 | −0,5474 | |||
| CRM / Salesforce, Inc. | 0,04 | 0,00 | 0,01 | 0,00 | 2,7003 | −0,1714 | |||
| JPM / JPMorgan Chase & Co. | 0,04 | 0,00 | 0,01 | 25,00 | 2,3561 | 0,2020 | |||
| GE / General Electric Company | 0,04 | 0,00 | 0,01 | 28,57 | 2,2697 | 0,3624 | |||
| SYF / Synchrony Financial | 0,13 | 0,00 | 0,01 | 33,33 | 2,0296 | 0,2900 | |||
| GOOG / Alphabet Inc. | 0,05 | 0,00 | 0,01 | 14,29 | 1,8811 | 0,0910 | |||
| ORCL / Oracle Corporation | 0,04 | 0,00 | 0,01 | 60,00 | 1,8751 | 0,5793 | |||
| SHOP / Shopify Inc. | 0,07 | 0,00 | 0,01 | 33,33 | 1,8592 | 0,1962 | |||
| WFC / Wells Fargo & Company | 0,09 | 0,00 | 0,01 | 16,67 | 1,6244 | 0,0517 | |||
| AMD / Advanced Micro Devices, Inc. | 0,05 | 0,00 | 0,01 | 50,00 | 1,5785 | 0,3435 | |||
| XOM / Exxon Mobil Corporation | 0,06 | 0,00 | 0,01 | −14,29 | 1,5406 | −0,2961 | |||
| MA / Mastercard Incorporated | 0,01 | 0,00 | 0,01 | 0,00 | 1,5304 | −0,0828 | |||
| WMT / Walmart Inc. | 0,07 | 0,00 | 0,01 | 20,00 | 1,4756 | 0,0438 | |||
| V / Visa Inc. | 0,02 | 0,00 | 0,01 | 0,00 | 1,4204 | −0,0946 | |||
| GSCE / GS Connect S&P GSCI Enhanced Commodity Total Return ETN | 0,01 | 0,00 | 0,01 | 25,00 | 1,3036 | 0,2164 | |||
| PBI / Pitney Bowes Inc. | 0,51 | 0,00 | 0,01 | 25,00 | 1,2838 | 0,1331 | |||
| GOOGL / Alphabet Inc. | 0,03 | 0,00 | 0,01 | 25,00 | 1,2636 | 0,0656 | |||
| C / Citigroup Inc. | 0,06 | 0,00 | 0,01 | 25,00 | 1,2046 | 0,1189 | |||
| ABBV / AbbVie Inc. | 0,03 | 0,00 | 0,01 | 0,00 | 1,1924 | −0,2621 | |||
| OXY / Occidental Petroleum Corporation | 0,12 | 27,58 | 0,01 | 25,00 | 1,1745 | 0,0056 | |||
| GEV / GE Vernova Inc. | 0,01 | 0,00 | 0,01 | 150,00 | 1,1666 | 0,4394 | |||
| COST / Costco Wholesale Corporation | 0,01 | 0,00 | 0,00 | 0,00 | 1,1434 | −0,0369 | |||
| DIS / The Walt Disney Company | 0,04 | 0,00 | 0,00 | 33,33 | 1,0395 | 0,1456 | |||
| JNJ / Johnson & Johnson | 0,03 | 0,00 | 0,00 | 0,00 | 1,0163 | −0,1762 | |||
| MS / Morgan Stanley | 0,03 | 0,00 | 0,00 | 33,33 | 0,9730 | 0,1022 | |||
| IVZ / Invesco Ltd. | 0,26 | 0,00 | 0,00 | 33,33 | 0,9274 | −0,0364 | |||
| SPOT / Spotify Technology S.A. | 0,01 | 0,00 | 0,00 | 50,00 | 0,8834 | 0,1992 | |||
| FHN / First Horizon Corporation | 0,18 | 0,00 | 0,00 | 0,00 | 0,8791 | 0,0090 | |||
| AMGN / Amgen Inc. | 0,01 | 0,00 | 0,00 | −25,00 | 0,8749 | −0,1800 | |||
| F / Ford Motor Company | 0,35 | 0,00 | 0,00 | 0,00 | 0,8623 | 0,0009 | |||
| COP / ConocoPhillips | 0,04 | 0,00 | 0,00 | −25,00 | 0,8530 | −0,2255 | |||
| AXP / American Express Company | 0,01 | 0,00 | 0,00 | 50,00 | 0,8079 | 0,0715 | |||
| IBM / International Business Machines Corporation | 0,01 | 0,00 | 0,00 | 50,00 | 0,8077 | 0,0715 | |||
| LOW / Lowe's Companies, Inc. | 0,02 | 0,00 | 0,00 | 0,00 | 0,7826 | −0,1064 | |||
| BEN / Franklin Resources, Inc. | 0,14 | 0,00 | 0,00 | 50,00 | 0,7713 | 0,0986 | |||
| HON / Honeywell International Inc. | 0,01 | 0,00 | 0,00 | 50,00 | 0,7561 | 0,0132 | |||
| TJX / The TJX Companies, Inc. | 0,03 | 0,00 | 0,00 | 0,00 | 0,7393 | −0,0486 | |||
| CVX / Chevron Corporation | 0,02 | 0,00 | 0,00 | 0,00 | 0,7319 | −0,1921 | |||
| CMCSA / Comcast Corporation | 0,09 | 0,00 | 0,00 | 0,00 | 0,7232 | −0,0847 | |||
| ADP / Automatic Data Processing, Inc. | 0,01 | 0,00 | 0,00 | 0,00 | 0,7101 | −0,0500 | |||
| CAT / Caterpillar Inc. | 0,01 | 0,00 | 0,00 | 50,00 | 0,6972 | 0,0573 | |||
| DE / Deere & Company | 0,01 | 0,00 | 0,00 | 50,00 | 0,6907 | 0,0018 | |||
| VZ / Verizon Communications Inc. | 0,07 | −27,10 | 0,00 | −50,00 | 0,6700 | −0,3712 | |||
| ALL / The Allstate Corporation | 0,01 | 0,00 | 0,00 | 0,00 | 0,6396 | −0,0715 | |||
| T / AT&T Inc. | 0,09 | −34,80 | 0,00 | −50,00 | 0,6242 | −0,3869 | |||
| PFE / Pfizer Inc. | 0,11 | 0,00 | 0,00 | 0,00 | 0,6223 | −0,0808 | |||
| PNW / Pinnacle West Capital Corporation | 0,03 | 0,00 | 0,00 | 0,00 | 0,6180 | −0,0931 | |||
| ABT / Abbott Laboratories | 0,02 | 0,00 | 0,00 | 0,00 | 0,6076 | −0,0326 | |||
| KO / The Coca-Cola Company | 0,04 | 0,00 | 0,00 | 0,00 | 0,6028 | −0,0565 | |||
| MU / Micron Technology, Inc. | 0,02 | 0,00 | 0,00 | 100,00 | 0,5618 | 0,1339 | |||
| AFL / Aflac Incorporated | 0,02 | 0,00 | 0,00 | 0,00 | 0,5001 | −0,0699 | |||
| TSLA / Tesla, Inc. | 0,01 | 0,00 | 0,00 | 100,00 | 0,4959 | 0,0586 | |||
| SBUX / Starbucks Corporation | 0,02 | 0,00 | 0,00 | −50,00 | 0,4430 | −0,0695 | |||
| TRV / The Travelers Companies, Inc. | 0,01 | 0,00 | 0,00 | 0,00 | 0,4312 | −0,0293 | |||
| PNC / The PNC Financial Services Group, Inc. | 0,01 | 0,00 | 0,00 | 0,00 | 0,4292 | −0,0082 | |||
| UNH / UnitedHealth Group Incorporated | 0,01 | 0,00 | 0,00 | −66,67 | 0,4250 | −0,3463 | |||
| CSCO / Cisco Systems, Inc. | 0,03 | 0,00 | 0,00 | 0,00 | 0,4239 | 0,0163 | |||
| BA / The Boeing Company | 0,01 | 0,00 | 0,00 | 0,00 | 0,4213 | 0,0506 | |||
| MRK / Merck & Co., Inc. | 0,02 | 0,00 | 0,00 | −50,00 | 0,4174 | −0,0941 | |||
| PH / Parker-Hannifin Corporation | 0,00 | 0,00 | 0,00 | 0,00 | 0,4020 | 0,0238 | |||
| BK / The Bank of New York Mellon Corporation | 0,02 | 0,00 | 0,00 | 0,00 | 0,3958 | 0,0019 | |||
| PEP / PepsiCo, Inc. | 0,01 | 0,00 | 0,00 | 0,00 | 0,3953 | −0,0896 | |||
| BMY / Bristol-Myers Squibb Company | 0,04 | 0,00 | 0,00 | −50,00 | 0,3827 | −0,1620 | |||
| TXN / Texas Instruments Incorporated | 0,01 | 0,00 | 0,00 | 0,00 | 0,3824 | 0,0247 | |||
| AIG / American International Group, Inc. | 0,02 | 0,00 | 0,00 | 0,00 | 0,3764 | −0,0368 | |||
| INTC / Intel Corporation | 0,07 | 0,00 | 0,00 | 0,00 | 0,3424 | −0,0328 | |||
| MMM / 3M Company | 0,01 | 0,00 | 0,00 | 0,00 | 0,3417 | −0,0146 | |||
| PSA / Public Storage | 0,01 | 0,00 | 0,00 | 0,00 | 0,3378 | −0,0344 | |||
| RTX / RTX Corporation | 0,01 | 0,00 | 0,00 | 0,00 | 0,3362 | 0,0065 | |||
| PRU / Prudential Financial, Inc. | 0,01 | 0,00 | 0,00 | 0,00 | 0,3339 | −0,0413 | |||
| GEHC / GE HealthCare Technologies Inc. | 0,02 | 0,00 | 0,00 | 0,00 | 0,3242 | −0,0575 | |||
| PGR / The Progressive Corporation | 0,01 | 0,00 | 0,00 | 0,00 | 0,3071 | −0,0449 | |||
| MET / MetLife, Inc. | 0,01 | 0,00 | 0,00 | 0,00 | 0,2777 | −0,0219 | |||
| UPS / United Parcel Service, Inc. | 0,01 | 0,00 | 0,00 | 0,00 | 0,2742 | −0,0487 | |||
| ZM / Zoom Communications Inc. | 0,01 | 0,00 | 0,00 | 0,00 | 0,2694 | −0,0060 | |||
| SPG / Simon Property Group, Inc. | 0,01 | 0,00 | 0,00 | 0,00 | 0,2590 | −0,0303 | |||
| LUMN / Lumen Technologies, Inc. | 0,25 | 0,00 | 0,00 | 0,2521 | 0,0083 | ||||
| NKE / NIKE, Inc. | 0,01 | 0,00 | 0,00 | 0,2454 | 0,0086 | ||||
| SHW / The Sherwin-Williams Company | 0,00 | 0,00 | 0,00 | 0,00 | 0,2371 | −0,0236 | |||
| GILD / Gilead Sciences, Inc. | 0,01 | −73,53 | 0,00 | −100,00 | 0,2298 | −0,7181 | |||
| CIEN / Ciena Corporation | 0,01 | 0,00 | 0,00 | 0,2296 | 0,0452 | ||||
| ADI / Analog Devices, Inc. | 0,00 | 0,00 | 0,00 | 0,2192 | 0,0184 | ||||
| CL / Colgate-Palmolive Company | 0,01 | 0,00 | 0,00 | 0,2176 | −0,0248 | ||||
| BTL / Baxter International Inc. | 0,03 | 0,00 | 0,00 | 0,2022 | −0,0449 | ||||
| DELL / Dell Technologies Inc. | 0,01 | 0,00 | 0,00 | 0,1962 | 0,0387 | ||||
| QCOM / QUALCOMM Incorporated | 0,01 | 0,00 | 0,00 | 0,1833 | −0,0078 | ||||
| ITT / ITT Inc. | 0,01 | 0,00 | 0,00 | 0,1805 | 0,0198 | ||||
| WRB / W. R. Berkley Corporation | 0,01 | 0,00 | 0,00 | 0,1713 | −0,0078 | ||||
| CTVA / Corteva, Inc. | 0,01 | 0,00 | 0,00 | 0,1685 | 0,0148 | ||||
| CARR / Carrier Global Corporation | 0,01 | 0,00 | 0,00 | 0,1685 | 0,0108 | ||||
| BIIB / Biogen Inc. | 0,01 | 0,00 | 0,00 | 0,1662 | −0,0296 | ||||
| EOG / EOG Resources, Inc. | 0,01 | 0,00 | 0,00 | 0,1653 | −0,0260 | ||||
| BAC / Bank of America Corporation | 0,02 | 0,00 | 0,00 | 0,1651 | 0,0078 | ||||
| BHC / Bausch Health Companies Inc. | 0,10 | 0,00 | 0,00 | 0,1533 | −0,0076 | ||||
| HSY / The Hershey Company | 0,00 | 0,00 | 0,00 | 0,1529 | −0,0173 | ||||
| RIG / Transocean Ltd. | 0,25 | 0,00 | 0,00 | 0,1492 | −0,0481 | ||||
| L / Loews Corporation | 0,01 | 0,00 | 0,00 | 0,1414 | −0,0119 | ||||
| HRL / Hormel Foods Corporation | 0,02 | 0,00 | 0,00 | 0,1393 | −0,0147 | ||||
| GL / Globe Life Inc. | 0,00 | 0,00 | 0,00 | 0,1287 | −0,0188 | ||||
| USB / U.S. Bancorp | 0,01 | 0,00 | 0,00 | 0,1250 | −0,0011 | ||||
| KEY / KeyCorp | 0,03 | 0,00 | 0,00 | 0,1204 | 0,0010 | ||||
| APA / APA Corporation | 0,03 | 0,00 | 0,00 | 0,1052 | −0,0256 | ||||
| DBK / Deutsche Bank Aktiengesellschaft | 0,01 | −66,67 | 0,00 | −100,00 | 0,1011 | −0,1656 | |||
| NUE / Nucor Corporation | 0,00 | 0,00 | 0,00 | 0,0896 | −0,0003 | ||||
| WAB / Westinghouse Air Brake Technologies Corporation | 0,00 | 0,00 | 0,00 | 0,0870 | 0,0054 | ||||
| DD / DuPont de Nemours, Inc. | 0,00 | 0,00 | 0,00 | 0,0737 | −0,0129 | ||||
| IFF / International Flavors & Fragrances Inc. | 0,00 | 0,00 | 0,00 | 0,0629 | −0,0088 | ||||
| DOW / Dow Inc. | 0,01 | 0,00 | 0,00 | 0,0599 | −0,0255 | ||||
| BB / BlackBerry Limited | 0,05 | 0,00 | 0,00 | 0,0527 | 0,0057 | ||||
| SWK / Stanley Black & Decker, Inc. | 0,00 | 0,00 | 0,00 | 0,0467 | −0,0107 | ||||
| SOLV / Solventum Corporation | 0,00 | 0,00 | 0,00 | 0,0426 | −0,0034 | ||||
| WBA / Walgreens Boots Alliance, Inc. | 0,01 | −50,00 | 0,00 | 0,0396 | −0,0437 | ||||
| HAL / Halliburton Company | 0,01 | 0,00 | 0,00 | 0,0375 | −0,0130 | ||||
| WBD / Warner Bros. Discovery, Inc. | 0,01 | 0,00 | 0,00 | 0,0364 | −0,0004 | ||||
| NOV / NOV Inc. | 0,01 | 0,00 | 0,00 | 0,0343 | −0,0112 | ||||
| VTRS / Viatris Inc. | 0,02 | 0,00 | 0,00 | 0,0318 | −0,0018 | ||||
| CVS / CVS Health Corporation | 0,00 | 0,00 | 0,00 | 0,0267 | −0,0014 | ||||
| EMR / Emerson Electric Co. | 0,00 | 0,00 | 0,00 | 0,0055 | 0,0005 | ||||
| PM / Philip Morris International Inc. | 0,00 | −100,00 | 0,00 | 0,0000 | |||||
| X / United States Steel Corporation | 0,00 | −100,00 | 0,00 | 0,0000 | |||||
| OXY.WS / Occidental Petroleum Corporation - Equity Warrant | 0,00 | −100,00 | 0,00 | 0,0000 |