Grundläggande statistik
| Portföljvärde | $ 521 944 |
| Aktuella positioner | 70 |
Senaste innehav, resultat, förvaltat kapital (från 13F, 13D)
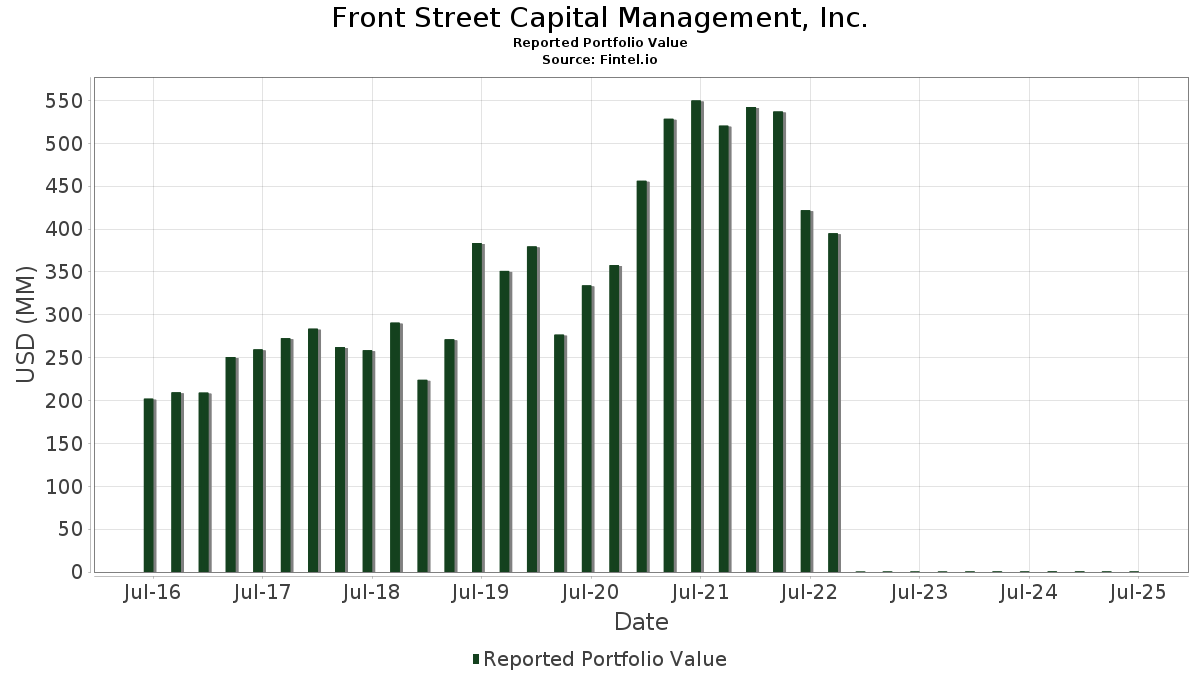
Front Street Capital Management, Inc. har redovisat 70 totala innehav i sina senaste SEC-arkiveringar. Det senaste portföljvärdet beräknas vara $ 521 944 USD. Faktiskt förvaltade tillgångar (AUM) är detta värde plus likvida medel (som inte redovisas). Front Street Capital Management, Inc.s största innehav är The Hershey Company (US:HSY) , Lumen Technologies, Inc. (US:LUMN) , Cognex Corporation (US:CGNX) , The Manitowoc Company, Inc. (US:MTW) , and Berkshire Hathaway Inc. (US:BRK.A) . Front Street Capital Management, Inc.s nya positioner inkluderar Azenta, Inc. (US:AZTA) , Applied Materials, Inc. (US:AMAT) , Standard BioTools Inc. (US:LAB) , Crane Company (US:CR) , and .
Största ökningarna detta kvartal
Vi använder förändringen i portföljallokeringen eftersom det är det mest meningsfulla måttet. Förändringar kan bero på transaktioner eller förändringar i aktiekurser.
| Värdepapper | Aktier (MM) |
Värde (MM$) |
Portfölj % av | ΔPortfölj % av |
|---|---|---|---|---|
| 0,06 | 0,03 | 5,7090 | 2,3145 | |
| 3,28 | 0,04 | 7,5462 | 2,1353 | |
| 0,23 | 0,06 | 11,4618 | 2,1337 | |
| 11,97 | 0,05 | 10,0442 | 1,1943 | |
| 0,11 | 0,01 | 1,9839 | 0,6836 | |
| 0,12 | 0,01 | 2,0441 | 0,5612 | |
| 0,26 | 0,01 | 2,3223 | 0,4429 | |
| 0,29 | 0,01 | 1,7956 | 0,4216 | |
| 0,07 | 0,00 | 0,6238 | 0,4083 | |
| 0,10 | 0,01 | 1,5628 | 0,4061 |
Största minskningarna detta kvartal
Vi använder förändringen i portföljallokeringen eftersom det är det mest meningsfulla måttet. Förändringar kan bero på transaktioner eller förändringar i aktiepriser.
| Värdepapper | Aktier (MM) |
Värde (MM$) |
Portfölj % av | ΔPortfölj % av |
|---|---|---|---|---|
| 0,01 | 0,00 | 0,7574 | −6,8673 | |
| 0,07 | 0,03 | 6,6344 | −3,2696 | |
| 0,21 | 0,01 | 1,2480 | −0,6451 | |
| 0,00 | 0,00 | 0,1780 | −0,4777 | |
| 0,01 | 0,00 | 0,3313 | −0,3143 | |
| 0,00 | 0,00 | 0,3353 | −0,2655 | |
| 0,06 | 0,00 | 0,9438 | −0,2128 | |
| 0,12 | 0,02 | 4,6762 | −0,1641 | |
| 0,00 | 0,00 | 0,0075 | −0,1266 | |
| 0,03 | 0,01 | 1,2114 | −0,1261 |
13F- och fond arkiveringar
Denna blankett lämnades in den 2025-08-15 för rapporteringsperioden 2025-06-30. Klicka på länksymbolen för att se hela transaktionshistoriken.
Uppgradera för att låsa upp premiumdata och exportera till Excel![]() .
.
| Värdepapper | Typ | Genomsnittligt aktiepris | Aktier (MM) |
ΔAktier (%) |
ΔAktier (%) |
Värde ($MM) |
Portfölj (%) |
ΔPortfölj (%) |
|
|---|---|---|---|---|---|---|---|---|---|
| HSY / The Hershey Company | 0,23 | −4,88 | 0,06 | 22,92 | 11,4618 | 2,1337 | |||
| LUMN / Lumen Technologies, Inc. | 11,97 | 1,12 | 0,05 | 13,04 | 10,0442 | 1,1943 | |||
| CGNX / Cognex Corporation | 1,32 | −4,49 | 0,04 | 2,44 | 8,0514 | 0,1792 | |||
| MTW / The Manitowoc Company, Inc. | 3,28 | −0,78 | 0,04 | 39,29 | 7,5462 | 2,1353 | |||
| BRK.A / Berkshire Hathaway Inc. | 0,07 | −27,59 | 0,03 | −33,33 | 6,6344 | −3,2696 | |||
| GEV / GE Vernova Inc. | 0,06 | −3,41 | 0,03 | 70,59 | 5,7090 | 2,3145 | |||
| COST / Costco Wholesale Corporation | 0,03 | −2,94 | 0,03 | 0,00 | 4,9206 | 0,0981 | |||
| DHR / Danaher Corporation | 0,12 | −0,19 | 0,02 | −4,00 | 4,6762 | −0,1641 | |||
| ESAB / ESAB Corporation | 0,16 | −4,47 | 0,02 | 0,00 | 3,5845 | −0,0254 | |||
| JOE / The St. Joe Company | 0,35 | −1,94 | 0,02 | 0,00 | 3,2000 | 0,0026 | |||
| MLKN / MillerKnoll, Inc. | 0,65 | 6,58 | 0,01 | 9,09 | 2,4162 | 0,1919 | |||
| TEX / Terex Corporation | 0,26 | −0,47 | 0,01 | 33,33 | 2,3223 | 0,4429 | |||
| GLW / Corning Incorporated | 0,22 | −0,34 | 0,01 | 22,22 | 2,1920 | 0,2859 | |||
| NUE / Nucor Corporation | 0,09 | −0,24 | 0,01 | 10,00 | 2,1495 | 0,1569 | |||
| COHR / Coherent Corp. | 0,12 | −0,11 | 0,01 | 42,86 | 2,0441 | 0,5612 | |||
| LITE / Lumentum Holdings Inc. | 0,11 | −0,40 | 0,01 | 66,67 | 1,9839 | 0,6836 | |||
| ATS / ATS Corporation | 0,29 | 1,74 | 0,01 | 28,57 | 1,7956 | 0,4216 | |||
| CIEN / Ciena Corporation | 0,10 | −0,08 | 0,01 | 33,33 | 1,5628 | 0,4061 | |||
| MOD / Modine Manufacturing Company | 0,08 | 0,00 | 0,01 | 40,00 | 1,4707 | 0,3299 | |||
| VNT / Vontier Corporation | 0,19 | −9,19 | 0,01 | 0,00 | 1,3741 | 0,0331 | |||
| ENOV / Enovis Corporation | 0,21 | −20,04 | 0,01 | −33,33 | 1,2480 | −0,6451 | |||
| AAPL / Apple Inc. | 0,03 | −2,58 | 0,01 | −14,29 | 1,2114 | −0,1261 | |||
| PH / Parker-Hannifin Corporation | 0,01 | −1,12 | 0,01 | 20,00 | 1,1802 | 0,1463 | |||
| GEHC / GE HealthCare Technologies Inc. | 0,07 | −0,07 | 0,01 | 0,00 | 0,9919 | −0,0848 | |||
| GPN / Global Payments Inc. | 0,06 | −0,61 | 0,00 | −33,33 | 0,9438 | −0,2128 | |||
| MSFT / Microsoft Corporation | 0,01 | −10,85 | 0,00 | 0,00 | 0,9024 | 0,1319 | |||
| VLTO / Veralto Corporation | 0,04 | −0,20 | 0,00 | 0,00 | 0,8003 | 0,0297 | |||
| VOO / Vanguard Index Funds - Vanguard S&P 500 ETF | 0,01 | −91,05 | 0,00 | −92,31 | 0,7574 | −6,8673 | |||
| CMCO / Columbus McKinnon Corporation | 0,25 | 30,81 | 0,00 | 0,00 | 0,7323 | 0,1143 | |||
| IP / International Paper Company | 0,07 | 228,39 | 0,00 | 200,00 | 0,6238 | 0,4083 | |||
| MCD / McDonald's Corporation | 0,01 | −0,44 | 0,00 | −33,33 | 0,5409 | −0,0374 | |||
| TILE / Interface, Inc. | 0,10 | −0,92 | 0,00 | 100,00 | 0,3876 | 0,0183 | |||
| AZTA / Azenta, Inc. | 0,06 | 0,00 | 0,3571 | 0,3571 | |||||
| FFX / Fairfax Financial Holdings Limited | 0,00 | 0,00 | 0,00 | 0,00 | 0,3548 | 0,0720 | |||
| EXPD / Expeditors International of Washington, Inc. | 0,02 | 6,96 | 0,00 | 0,00 | 0,3510 | 0,0073 | |||
| MKL / Markel Group Inc. | 0,00 | −47,95 | 0,00 | −66,67 | 0,3353 | −0,2655 | |||
| PG / The Procter & Gamble Company | 0,01 | −47,06 | 0,00 | −66,67 | 0,3313 | −0,3143 | |||
| NVDA / NVIDIA Corporation | 0,01 | −6,56 | 0,00 | 0,2372 | 0,0632 | ||||
| VTI / Vanguard Index Funds - Vanguard Total Stock Market ETF | 0,00 | −75,55 | 0,00 | −100,00 | 0,1780 | −0,4777 | |||
| SPY / SPDR S&P 500 ETF | 0,00 | 0,00 | 0,00 | 0,1663 | 0,0164 | ||||
| GBCI / Glacier Bancorp, Inc. | 0,02 | 2,73 | 0,00 | 0,1621 | 0,0007 | ||||
| AMAT / Applied Materials, Inc. | 0,00 | 0,00 | 0,1439 | 0,1439 | |||||
| SBUX / Starbucks Corporation | 0,01 | 6,59 | 0,00 | 0,1418 | 0,0001 | ||||
| GOOGL / Alphabet Inc. | 0,00 | −14,76 | 0,00 | 0,1337 | −0,0036 | ||||
| AMZN / Amazon.com, Inc. | 0,00 | −25,41 | 0,00 | 0,1299 | −0,0194 | ||||
| BAC / Bank of America Corporation | 0,01 | −4,29 | 0,00 | 0,1217 | 0,0101 | ||||
| PYPL / PayPal Holdings, Inc. | 0,01 | −45,03 | 0,00 | 0,1169 | −0,0731 | ||||
| ROL / Rollins, Inc. | 0,01 | −6,26 | 0,00 | 0,1105 | −0,0018 | ||||
| GOOG / Alphabet Inc. | 0,00 | 5,05 | 0,00 | 0,1075 | 0,0173 | ||||
| KO / The Coca-Cola Company | 0,01 | −2,37 | 0,00 | 0,0950 | −0,0032 | ||||
| CVX / Chevron Corporation | 0,00 | 5,57 | 0,00 | 0,0935 | −0,0097 | ||||
| CL / Colgate-Palmolive Company | 0,01 | 0,00 | 0,00 | 0,0889 | −0,0023 | ||||
| NOC / Northrop Grumman Corporation | 0,00 | 0,00 | 0,00 | 0,0602 | −0,0013 | ||||
| VZ / Verizon Communications Inc. | 0,01 | −9,22 | 0,00 | 0,0596 | −0,0089 | ||||
| TSLA / Tesla, Inc. | 0,00 | 0,00 | 0,00 | 0,0594 | 0,0111 | ||||
| ETN / Eaton Corporation plc | 0,00 | −2,70 | 0,00 | 0,0592 | 0,0130 | ||||
| WFC / Wells Fargo & Company | 0,00 | −5,58 | 0,00 | 0,0584 | 0,0033 | ||||
| JPM / JPMorgan Chase & Co. | 0,00 | −1,12 | 0,00 | 0,0540 | 0,0079 | ||||
| QCOM / QUALCOMM Incorporated | 0,00 | 24,45 | 0,00 | 0,0504 | 0,0115 | ||||
| META / Meta Platforms, Inc. | 0,00 | 0,00 | 0,0490 | 0,0490 | |||||
| JNJ / Johnson & Johnson | 0,00 | 15,97 | 0,00 | 0,0489 | 0,0033 | ||||
| XOM / Exxon Mobil Corporation | 0,00 | 0,00 | 0,0416 | 0,0416 | |||||
| ADBE / Adobe Inc. | 0,00 | 8,20 | 0,00 | 0,0400 | 0,0034 | ||||
| AXP / American Express Company | 0,00 | 0,00 | 0,0397 | 0,0397 | |||||
| RTX / RTX Corporation | 0,00 | 0,00 | 0,0391 | 0,0391 | |||||
| ROG / Rogers Corporation | 0,00 | 0,00 | 0,0385 | 0,0385 | |||||
| LAB / Standard BioTools Inc. | 0,12 | 0,00 | 0,0278 | 0,0278 | |||||
| CR / Crane Company | 0,00 | 0,00 | 0,0274 | 0,0274 | |||||
| ITW / Illinois Tool Works Inc. | 0,00 | 0,00 | 0,0238 | 0,0238 | |||||
| KE / Kimball Electronics, Inc. | 0,00 | −95,29 | 0,00 | 0,0075 | −0,1266 | ||||
| BDC / Belden Inc. | 0,00 | −100,00 | 0,00 | 0,0000 | |||||
| SWPPX / Schwab Capital Trust - Schwab S&P 500 Index Fund | 0,00 | −100,00 | 0,00 | 0,0000 | |||||
| VANGUARD FTSE SOCIAL INDEX ADMIRAL / (921910717) | 0,00 | −100,00 | 0,00 | 0,0000 |