Grundläggande statistik
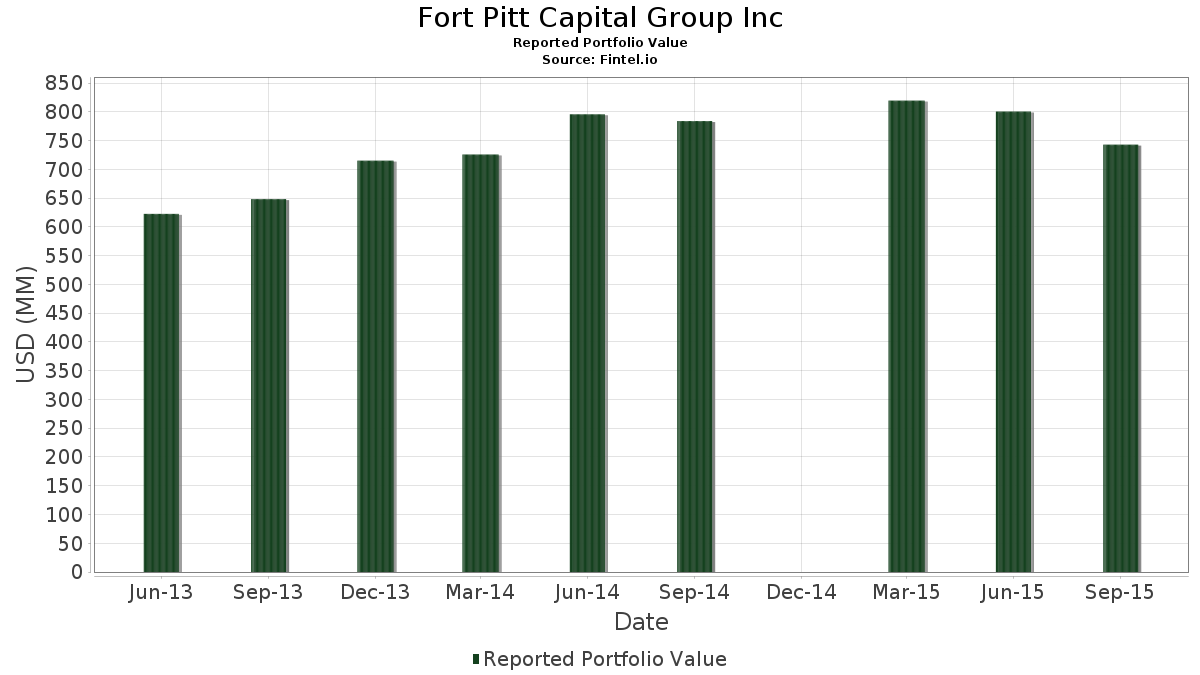
| Portföljvärde | $ 742 932 000 |
| Aktuella positioner | 96 |
Senaste innehav, resultat, förvaltat kapital (från 13F, 13D)
Fort Pitt Capital Group Inc har redovisat 96 totala innehav i sina senaste SEC-arkiveringar. Det senaste portföljvärdet beräknas vara $ 742 932 000 USD. Faktiskt förvaltade tillgångar (AUM) är detta värde plus likvida medel (som inte redovisas). Fort Pitt Capital Group Incs största innehav är The Boeing Company (US:BA) , Microsoft Corporation (US:MSFT) , AT&T Inc. (US:T) , Verizon Communications Inc. (US:VZ) , and General Electric Company (US:GE) .
Största ökningarna detta kvartal
Vi använder förändringen i portföljallokeringen eftersom det är det mest meningsfulla måttet. Förändringar kan bero på transaktioner eller förändringar i aktiekurser.
| Värdepapper | Aktier (MM) |
Värde (MM$) |
Portfölj % av | ΔPortfölj % av |
|---|---|---|---|---|
| 0,17 | 6,85 | 0,9215 | 0,7485 | |
| 0,35 | 23,64 | 3,1823 | 0,6399 | |
| 1,15 | 29,02 | 3,9063 | 0,4146 | |
| 0,57 | 23,69 | 3,1884 | 0,4101 | |
| 0,37 | 24,99 | 3,3634 | 0,3907 | |
| 0,19 | 19,39 | 2,6093 | 0,3383 | |
| 0,69 | 30,75 | 4,1395 | 0,2932 | |
| 0,93 | 25,48 | 3,4291 | 0,2921 | |
| 0,21 | 22,76 | 3,0641 | 0,2921 | |
| 0,93 | 17,46 | 2,3508 | 0,2222 |
Största minskningarna detta kvartal
Vi använder förändringen i portföljallokeringen eftersom det är det mest meningsfulla måttet. Förändringar kan bero på transaktioner eller förändringar i aktiepriser.
| Värdepapper | Aktier (MM) |
Värde (MM$) |
Portfölj % av | ΔPortfölj % av |
|---|---|---|---|---|
| 0,00 | 0,00 | −0,6236 | ||
| 0,25 | 3,86 | 0,5192 | −0,6002 | |
| 0,00 | 0,00 | −0,5950 | ||
| 0,51 | 14,12 | 1,9004 | −0,5510 | |
| 0,23 | 22,05 | 2,9686 | −0,4074 | |
| 0,32 | 9,91 | 1,3338 | −0,2875 | |
| 0,55 | 16,07 | 2,1628 | −0,2354 | |
| 0,89 | 7,69 | 1,0355 | −0,2330 | |
| 0,09 | 8,06 | 1,0846 | −0,2260 | |
| 0,13 | 13,13 | 1,7668 | −0,1872 |
13F- och fond arkiveringar
Denna blankett lämnades in den 2015-10-27 för rapporteringsperioden 2015-09-30. Klicka på länksymbolen för att se hela transaktionshistoriken.
Uppgradera för att låsa upp premiumdata och exportera till Excel![]() .
.
| Värdepapper | Typ | Genomsnittligt aktiepris | Aktier (MM) |
ΔAktier (%) |
ΔAktier (%) |
Värde ($MM) |
Portfölj (%) |
ΔPortfölj (%) |
|
|---|---|---|---|---|---|---|---|---|---|
| BA / The Boeing Company | 0,25 | −0,31 | 33,17 | −5,89 | 4,4643 | 0,0614 | |||
| MSFT / Microsoft Corporation | 0,69 | −0,36 | 30,75 | −0,11 | 4,1395 | 0,2932 | |||
| T / AT&T Inc. | 0,92 | −0,04 | 30,05 | −8,31 | 4,0448 | −0,0496 | |||
| VZ / Verizon Communications Inc. | 0,69 | −0,05 | 30,01 | −6,70 | 4,0393 | 0,0211 | |||
| GE / General Electric Company | 1,15 | 9,39 | 29,02 | 3,83 | 3,9063 | 0,4146 | |||
| SNDK / Sandisk Corporation | 0,48 | −0,30 | 26,11 | −6,96 | 3,5138 | 0,0086 | |||
| PNC / The PNC Financial Services Group, Inc. | 0,29 | −0,13 | 25,50 | −6,87 | 3,4330 | 0,0119 | |||
| CAIAF / CA Immobilien Anlagen AG | 0,93 | 8,85 | 25,48 | 1,45 | 3,4291 | 0,2921 | |||
| MDT / Medtronic plc | 0,37 | 16,24 | 24,99 | 5,01 | 3,3634 | 0,3907 | |||
| SCHB / Schwab Strategic Trust - Schwab U.S. Broad Market ETF | 0,53 | −1,08 | 24,80 | −8,67 | 3,3377 | −0,0541 | |||
| L / Loews Corporation | 0,68 | −0,38 | 24,59 | −6,52 | 3,3104 | 0,0238 | |||
| AJG / Arthur J. Gallagher & Co. | 0,57 | 22,04 | 23,69 | 6,51 | 3,1884 | 0,4101 | |||
| VFC / V.F. Corporation | 0,35 | 18,78 | 23,64 | 16,17 | 3,1823 | 0,6399 | |||
| KMB / Kimberly-Clark Corporation | 0,21 | −0,30 | 22,76 | 2,59 | 3,0641 | 0,2921 | |||
| HON / Honeywell International Inc. | 0,23 | −12,11 | 22,05 | −18,39 | 2,9686 | −0,4074 | |||
| XLNX / Xilinx, Inc. | 0,51 | 0,15 | 21,66 | −3,84 | 2,9157 | 0,1014 | |||
| NTCT / NetScout Systems, Inc. | 0,59 | −0,69 | 20,74 | −4,22 | 2,7916 | 0,0866 | |||
| ROK / Rockwell Automation, Inc. | 0,19 | 30,99 | 19,39 | 6,64 | 2,6093 | 0,3383 | |||
| HW / Headwaters Inc. | 0,93 | −0,66 | 17,46 | 2,50 | 2,3508 | 0,2222 | |||
| URBN / Urban Outfitters, Inc. | 0,55 | −0,29 | 16,07 | −16,30 | 2,1628 | −0,2354 | |||
| MMC / Marsh & McLennan Companies, Inc. | 0,30 | −0,38 | 15,49 | −8,25 | 2,0844 | −0,0242 | |||
| KMI / Kinder Morgan, Inc. | 0,51 | −0,21 | 14,12 | −28,05 | 1,9004 | −0,5510 | |||
| TXN / Texas Instruments Incorporated | 0,27 | −1,05 | 13,56 | −4,88 | 1,8252 | 0,0442 | |||
| INTC / Intel Corporation | 0,45 | −1,32 | 13,49 | −2,21 | 1,8155 | 0,0924 | |||
| PH / Parker-Hannifin Corporation | 0,13 | 0,33 | 13,13 | −16,08 | 1,7668 | −0,1872 | |||
| AMGN / Amgen Inc. | 0,08 | −0,27 | 11,56 | −10,14 | 1,5556 | −0,0511 | |||
| IBM / International Business Machines Corporation | 0,08 | 0,12 | 10,97 | −10,77 | 1,4760 | −0,0593 | |||
| NTAP / NetApp, Inc. | 0,36 | −0,48 | 10,71 | −6,66 | 1,4416 | 0,0082 | |||
| 018490100 / Allergan plc | 0,04 | −0,15 | 10,13 | −10,57 | 1,3635 | −0,0515 | |||
| BP / BP p.l.c. - Depositary Receipt (Common Stock) | 0,32 | −0,16 | 9,91 | −23,65 | 1,3338 | −0,2875 | |||
| IPAR / Interparfums, Inc. | 0,36 | 53,69 | 8,96 | 12,37 | 1,2056 | 0,2098 | |||
| PPG / PPG Industries, Inc. | 0,09 | 0,48 | 8,06 | −23,19 | 1,0846 | −0,2260 | |||
| WEN / The Wendy's Company | 0,89 | −1,20 | 7,69 | −24,24 | 1,0355 | −0,2330 | |||
| ERIE / Erie Indemnity Company | 0,09 | −0,32 | 7,61 | 0,73 | 1,0238 | 0,0805 | |||
| ABT / Abbott Laboratories | 0,17 | 503,08 | 6,85 | 394,30 | 0,9215 | 0,7485 | |||
| BK / The Bank of New York Mellon Corporation | 0,17 | −0,20 | 6,50 | −6,90 | 0,8755 | 0,0027 | |||
| SCHW / The Charles Schwab Corporation | 0,23 | −0,27 | 6,45 | −12,76 | 0,8687 | −0,0555 | |||
| PFE / Pfizer Inc. | 0,19 | 1,75 | 6,09 | −4,68 | 0,8193 | 0,0215 | |||
| EMC / Global X Funds - Global X Emerging Markets Great Consumer ETF | 0,25 | −1,28 | 5,97 | −9,62 | 0,8038 | −0,0217 | |||
| AXLL / Axiall Corporation | 0,25 | −1,09 | 3,86 | −56,95 | 0,5192 | −0,6002 | |||
| IR / Ingersoll Rand Inc. | 0,07 | −0,62 | 3,68 | −25,16 | 0,4956 | −0,1190 | |||
| MATW / Matthews International Corporation | 0,07 | −0,19 | 3,56 | −8,01 | 0,4793 | −0,0043 | |||
| VOXX / VOXX International Corporation | 0,48 | −1,84 | 3,56 | −12,03 | 0,4793 | −0,0264 | |||
| IHRMF / iShares Public Limited Company - iShares MSCI Japan UCITS ETF USD (Dist) | 0,31 | −1,24 | 3,56 | −11,89 | 0,4788 | −0,0256 | |||
| US9021041085 / II-VI, Inc. | 0,22 | −0,50 | 3,49 | −15,71 | 0,4694 | −0,0475 | |||
| XOM / Exxon Mobil Corporation | 0,04 | −5,08 | 3,23 | −15,17 | 0,4342 | −0,0409 | |||
| FNB / F.N.B. Corporation | 0,23 | −1,01 | 2,99 | −10,49 | 0,4030 | −0,0149 | |||
| ZTS / Zoetis Inc. | 0,06 | 0,37 | 2,62 | −14,28 | 0,3524 | −0,0291 | |||
| JNJ / Johnson & Johnson | 0,02 | 1,03 | 2,00 | −3,25 | 0,2687 | 0,0109 | |||
| AAPL / Apple Inc. | 0,02 | −8,90 | 1,75 | −19,88 | 0,2360 | −0,0374 | |||
| ANSS / ANSYS, Inc. | 0,02 | −0,85 | 1,55 | −4,26 | 0,2086 | 0,0064 | |||
| CSCO / Cisco Systems, Inc. | 0,06 | −0,66 | 1,51 | −5,03 | 0,2031 | 0,0046 | |||
| ABBV / AbbVie Inc. | 0,03 | −1,72 | 1,47 | −20,39 | 0,1976 | −0,0328 | |||
| USAP / Universal Stainless & Alloy Products, Inc. | 0,13 | 94,36 | 1,40 | 4,62 | 0,1888 | 0,0213 | |||
| PG / The Procter & Gamble Company | 0,02 | 0,02 | 1,33 | −8,02 | 0,1792 | −0,0016 | |||
| NSC / Norfolk Southern Corporation | 0,02 | 0,00 | 1,23 | −12,56 | 0,1658 | −0,0102 | |||
| BRK.B / Berkshire Hathaway Inc. | 0,01 | 0,00 | 1,18 | −4,22 | 0,1588 | 0,0049 | |||
| WMT / Walmart Inc. | 0,02 | 0,23 | 1,17 | −8,36 | 0,1579 | −0,0020 | |||
| PEP / PepsiCo, Inc. | 0,01 | 0,28 | 1,13 | 1,26 | 0,1518 | 0,0127 | |||
| MMM / 3M Company | 0,01 | 0,81 | 1,12 | −7,43 | 0,1510 | −0,0004 | |||
| MO / Altria Group, Inc. | 0,02 | 5,91 | 1,01 | 17,80 | 0,1354 | 0,0287 | |||
| MRK / Merck & Co., Inc. | 0,02 | −0,54 | 1,00 | −13,68 | 0,1350 | −0,0102 | |||
| KO / The Coca-Cola Company | 0,02 | 3,13 | 0,92 | 5,52 | 0,1236 | 0,0149 | |||
| BRK.A / Berkshire Hathaway Inc. | 0,00 | 0,00 | 0,78 | −4,64 | 0,1051 | 0,0028 | |||
| PM / Philip Morris International Inc. | 0,01 | 0,03 | 0,78 | −1,02 | 0,1043 | 0,0065 | |||
| IVV / iShares Trust - iShares Core S&P 500 ETF | 0,00 | 0,08 | 0,73 | −6,99 | 0,0985 | 0,0002 | |||
| AVNS / Avanos Medical, Inc. | 0,02 | −0,53 | 0,70 | −30,12 | 0,0946 | −0,0311 | |||
| CVX / Chevron Corporation | 0,01 | 2,35 | 0,69 | −16,30 | 0,0926 | −0,0101 | |||
| CAT / Caterpillar Inc. | 0,01 | −4,42 | 0,64 | −26,36 | 0,0857 | −0,0223 | |||
| LQD / iShares Trust - iShares iBoxx $ Investment Grade Corporate Bond ETF | 0,01 | 0,00 | 0,62 | 0,33 | 0,0830 | 0,0062 | |||
| AXP / American Express Company | 0,01 | 1,00 | 0,60 | −3,70 | 0,0806 | 0,0029 | |||
| USB / U.S. Bancorp | 0,01 | 0,66 | 0,59 | −4,98 | 0,0795 | 0,0018 | |||
| CL / Colgate-Palmolive Company | 0,01 | 0,02 | 0,58 | −2,87 | 0,0775 | 0,0034 | |||
| JPM / JPMorgan Chase & Co. | 0,01 | 1,96 | 0,56 | −8,26 | 0,0747 | −0,0009 | |||
| GTLS / Chart Industries, Inc. | 0,03 | 0,53 | 0,55 | −45,96 | 0,0739 | −0,0530 | |||
| SPY / SPDR S&P 500 ETF | 0,00 | 19,86 | 0,45 | 11,50 | 0,0600 | 0,0101 | |||
| COL / Rockwell Collins, Inc. | 0,00 | 0,00 | 0,40 | −11,38 | 0,0534 | −0,0025 | |||
| WFC / Wells Fargo & Company | 0,01 | 0,00 | 0,39 | −8,75 | 0,0520 | −0,0009 | |||
| RAI / Reynolds American, Inc. | 0,01 | 55,26 | 0,35 | −8,05 | 0,0476 | −0,0004 | |||
| DIS / The Walt Disney Company | 0,00 | −0,66 | 0,32 | −11,26 | 0,0435 | −0,0020 | |||
| YUM / Yum! Brands, Inc. | 0,00 | 0,00 | 0,30 | −11,24 | 0,0404 | −0,0018 | |||
| CB / Chubb Limited | 0,00 | 0,00 | 0,30 | 28,57 | 0,0400 | 0,0111 | |||
| GOOGL / Alphabet Inc. | 0,00 | −18,02 | 0,30 | −3,27 | 0,0398 | 0,0016 | |||
| APD / Air Products and Chemicals, Inc. | 0,00 | 0,00 | 0,28 | −6,60 | 0,0381 | 0,0002 | |||
| TJX / The TJX Companies, Inc. | 0,00 | 0,00 | 0,28 | 8,14 | 0,0376 | 0,0053 | |||
| GOOG / Alphabet Inc. | 0,00 | −18,28 | 0,27 | −4,56 | 0,0366 | 0,0010 | |||
| D / Dominion Energy, Inc. | 0,00 | 0,00 | 0,27 | 5,02 | 0,0366 | 0,0043 | |||
| AMP / Ameriprise Financial, Inc. | 0,00 | 0,00 | 0,27 | −12,50 | 0,0358 | −0,0022 | |||
| HD / The Home Depot, Inc. | 0,00 | 7,96 | 0,24 | 12,26 | 0,0320 | 0,0056 | |||
| IJK / iShares Trust - iShares S&P Mid-Cap 400 Growth ETF | 0,00 | 0,00 | 0,23 | −7,38 | 0,0304 | −0,0001 | |||
| DOW / Dow Inc. | 0,00 | −4,13 | 0,22 | −27,74 | 0,0302 | −0,0086 | |||
| UPS / United Parcel Service, Inc. | 0,00 | 0,21 | 0,0289 | 0,0289 | |||||
| IWM / iShares Trust - iShares Russell 2000 ETF | 0,00 | −9,53 | 0,21 | −20,97 | 0,0284 | −0,0050 | |||
| IWV / iShares Trust - iShares Russell 3000 ETF | 0,00 | 0,00 | 0,20 | −8,26 | 0,0269 | −0,0003 | |||
| FSYS / Fuel Systems Solutions, Inc. | 0,02 | −0,92 | 0,10 | −35,58 | 0,0141 | −0,0062 | |||
| GIM / Templeton Global Income Fund | 0,01 | 0,00 | 0,06 | −12,86 | 0,0082 | −0,0005 | |||
| G0083B108 / Actavis | 0,00 | 0,00 | 0,0000 | ||||||
| JOY / Joy Global, Inc. | 0,00 | −100,00 | 0,00 | −100,00 | −0,6236 | ||||
| WM / Waste Management, Inc. | 0,00 | 0,00 | 0,0000 | 0,0000 | |||||
| EBAY / eBay Inc. | 0,00 | −100,00 | 0,00 | −100,00 | −0,0271 | ||||
| EMR / Emerson Electric Co. | 0,00 | −100,00 | 0,00 | −100,00 | −0,0299 | ||||
| IJR / iShares Trust - iShares Core S&P Small-Cap ETF | 0,00 | −100,00 | 0,00 | −100,00 | −0,0266 | ||||
| 441060100 / Hospira | 0,00 | −100,00 | 0,00 | −100,00 | −0,5950 | ||||
| EQT / EQT Corporation | 0,00 | −100,00 | 0,00 | −100,00 | −0,0281 | ||||
| PEG / Public Service Enterprise Group Incorporated | 0,00 | 0,00 | 0,0000 | 0,0000 | |||||
| NSRGY / Nestlé S.A. - Depositary Receipt (Common Stock) | 0,00 | 0,00 | 0,0000 | 0,0000 | |||||
| US00C4U1L353 / Mylan N.V. | 0,00 | 0,00 | 0,0000 | 0,0000 | |||||
| PPL / PPL Corporation | 0,00 | 0,00 | 0,0000 | 0,0000 | |||||
| BAX / Baxter International Inc. | 0,00 | −100,00 | 0,00 | −100,00 | −0,0367 | ||||
| CMCSA / Comcast Corporation | 0,00 | 0,00 | 0,0000 | 0,0000 | |||||
| / Windstream Holdings, Inc | 0,00 | 0,00 | 0,0000 | 0,0000 |