Grundläggande statistik
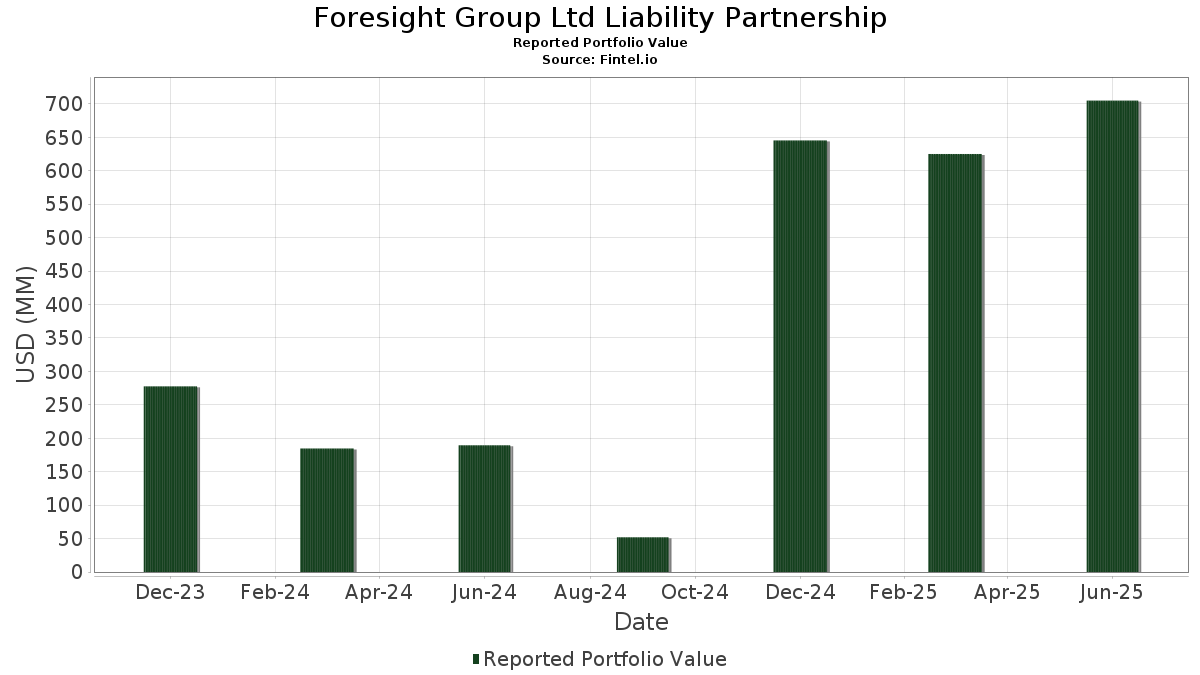
| Portföljvärde | $ 704 857 232 |
| Aktuella positioner | 60 |
Senaste innehav, resultat, förvaltat kapital (från 13F, 13D)
Foresight Group Ltd Liability Partnership har redovisat 60 totala innehav i sina senaste SEC-arkiveringar. Det senaste portföljvärdet beräknas vara $ 704 857 232 USD. Faktiskt förvaltade tillgångar (AUM) är detta värde plus likvida medel (som inte redovisas). Foresight Group Ltd Liability Partnerships största innehav är Autodesk, Inc. (US:ADSK) , TE Connectivity plc (US:TEL) , Trimble Inc. (US:TRMB) , Xylem Inc. (US:XYL) , and Ecolab Inc. (US:ECL) . Foresight Group Ltd Liability Partnerships nya positioner inkluderar Novo Nordisk A/S - Depositary Receipt (Common Stock) (US:NVO) , Easterly Government Properties, Inc. (US:DEA) , Lantheus Holdings, Inc. (US:LNTH) , .
Största ökningarna detta kvartal
Vi använder förändringen i portföljallokeringen eftersom det är det mest meningsfulla måttet. Förändringar kan bero på transaktioner eller förändringar i aktiekurser.
| Värdepapper | Aktier (MM) |
Värde (MM$) |
Portfölj % av | ΔPortfölj % av |
|---|---|---|---|---|
| 0,12 | 8,64 | 1,2258 | 1,2258 | |
| 0,38 | 8,39 | 1,1906 | 1,1906 | |
| 0,07 | 5,61 | 0,7958 | 0,7958 | |
| 0,07 | 11,95 | 1,6948 | 0,4566 | |
| 0,11 | 33,14 | 4,7020 | 0,4153 | |
| 0,28 | 15,43 | 2,1895 | 0,4099 | |
| 0,03 | 12,83 | 1,8209 | 0,4051 | |
| 0,11 | 16,23 | 2,3027 | 0,3911 | |
| 0,38 | 12,15 | 1,7241 | 0,3669 | |
| 0,03 | 11,54 | 1,6376 | 0,3350 |
Största minskningarna detta kvartal
Vi använder förändringen i portföljallokeringen eftersom det är det mest meningsfulla måttet. Förändringar kan bero på transaktioner eller förändringar i aktiepriser.
| Värdepapper | Aktier (MM) |
Värde (MM$) |
Portfölj % av | ΔPortfölj % av |
|---|---|---|---|---|
| 0,05 | 21,25 | 3,0147 | −1,0892 | |
| 0,05 | 24,76 | 3,5124 | −0,9682 | |
| 0,12 | 25,29 | 3,5878 | −0,7418 | |
| 0,20 | 27,17 | 3,8541 | −0,6063 | |
| 0,01 | 1,39 | 0,1969 | −0,4079 | |
| 1,15 | 19,96 | 2,8320 | −0,3860 | |
| 0,08 | 11,66 | 1,6546 | −0,3421 | |
| 0,16 | 9,54 | 1,3537 | −0,3372 | |
| 0,11 | 30,58 | 4,3387 | −0,2972 | |
| 0,12 | 16,53 | 2,3453 | −0,2857 |
13F- och fond arkiveringar
Denna blankett lämnades in den 2025-08-13 för rapporteringsperioden 2025-06-30. Klicka på länksymbolen för att se hela transaktionshistoriken.
Uppgradera för att låsa upp premiumdata och exportera till Excel![]() .
.
| Värdepapper | Typ | Genomsnittligt aktiepris | Aktier (MM) |
ΔAktier (%) |
ΔAktier (%) |
Värde ($MM) |
Portfölj (%) |
ΔPortfölj (%) |
|
|---|---|---|---|---|---|---|---|---|---|
| ADSK / Autodesk, Inc. | 0,11 | −7,83 | 33,14 | 8,99 | 4,7020 | 0,4153 | |||
| TEL / TE Connectivity plc | 0,19 | −15,73 | 32,17 | 0,58 | 4,5639 | 0,0553 | |||
| TRMB / Trimble Inc. | 0,42 | −9,62 | 31,73 | 4,60 | 4,5021 | 0,2254 | |||
| XYL / Xylem Inc. | 0,24 | −11,53 | 30,91 | −4,23 | 4,3850 | −0,1643 | |||
| ECL / Ecolab Inc. | 0,11 | −12,50 | 30,58 | −7,01 | 4,3387 | −0,2972 | |||
| MSA / MSA Safety Incorporated | 0,17 | −6,09 | 29,13 | 7,25 | 4,1329 | 0,3038 | |||
| STE / STERIS plc | 0,11 | −1,24 | 27,17 | 4,67 | 3,8546 | 0,1954 | |||
| AZN / AstraZeneca PLC - Depositary Receipt (Common Stock) | 0,20 | −10,07 | 27,17 | −14,14 | 3,8541 | −0,6063 | |||
| AMT / American Tower Corporation | 0,12 | −18,63 | 25,29 | −17,66 | 3,5878 | −0,7418 | |||
| LIN / Linde plc | 0,05 | −22,70 | 24,76 | −22,11 | 3,5124 | −0,9682 | |||
| SW / Smurfit Westrock Plc | 0,57 | −1,19 | 24,63 | −5,38 | 3,4941 | −0,1750 | |||
| A / Agilent Technologies, Inc. | 0,20 | −15,49 | 23,39 | 10,05 | 3,3182 | 0,3221 | |||
| TMO / Thermo Fisher Scientific Inc. | 0,05 | −10,43 | 21,25 | −27,01 | 3,0147 | −1,0892 | |||
| DLR / Digital Realty Trust, Inc. | 0,12 | −10,18 | 20,98 | 8,42 | 2,9771 | 0,2487 | |||
| DOC / Healthpeak Properties, Inc. | 1,15 | 1,61 | 19,96 | −12,56 | 2,8320 | −0,3860 | |||
| EQIX / Equinix, Inc. | 0,02 | 9,49 | 18,71 | 7,06 | 2,6539 | 0,1908 | |||
| AWK / American Water Works Company, Inc. | 0,12 | −6,07 | 16,53 | −11,43 | 2,3453 | −0,2857 | |||
| SLAB / Silicon Laboratories Inc. | 0,11 | −8,57 | 16,23 | 19,69 | 2,3027 | 0,3911 | |||
| NXT / Nextracker Inc. | 0,28 | −5,25 | 15,43 | 22,25 | 2,1895 | 0,4099 | |||
| LOPE / Grand Canyon Education, Inc. | 0,08 | −9,32 | 14,27 | −0,94 | 2,0249 | −0,0062 | |||
| VLTO / Veralto Corporation | 0,14 | −3,32 | 14,18 | 0,15 | 2,0123 | 0,0158 | |||
| WMS / Advanced Drainage Systems, Inc. | 0,11 | −1,12 | 13,14 | 4,63 | 1,8643 | 0,0939 | |||
| TT / Trane Technologies plc | 0,03 | −1,59 | 12,83 | 27,79 | 1,8209 | 0,4051 | |||
| POWI / Power Integrations, Inc. | 0,22 | −1,07 | 12,34 | 9,51 | 1,7512 | 0,1623 | |||
| ATS / ATS Corporation | 0,38 | −1,16 | 12,15 | 26,23 | 1,7241 | 0,3669 | |||
| FSLR / First Solar, Inc. | 0,07 | 3,87 | 11,95 | 36,00 | 1,6948 | 0,4566 | |||
| ICLR / ICON Public Limited Company | 0,08 | −0,83 | 11,66 | −17,66 | 1,6546 | −0,3421 | |||
| ROK / Rockwell Automation, Inc. | 0,03 | −2,83 | 11,54 | 24,93 | 1,6376 | 0,3350 | |||
| CWEN / Clearway Energy, Inc. | 0,35 | −2,56 | 11,32 | 3,58 | 1,6058 | 0,0654 | |||
| DHR / Danaher Corporation | 0,06 | −1,27 | 10,95 | −4,86 | 1,5542 | −0,0690 | |||
| VTR / Ventas, Inc. | 0,16 | 40,15 | 9,99 | 28,30 | 1,4175 | 0,3198 | |||
| GMAB / Genmab A/S - Depositary Receipt (Common Stock) | 0,05 | −1,47 | 9,93 | 5,07 | 1,4092 | 0,0765 | |||
| GMED / Globus Medical, Inc. | 0,16 | −1,34 | 9,54 | −20,45 | 1,3537 | −0,3372 | |||
| NVO / Novo Nordisk A/S - Depositary Receipt (Common Stock) | 0,12 | 8,64 | 1,2258 | 1,2258 | |||||
| DEA / Easterly Government Properties, Inc. | 0,38 | 8,39 | 1,1906 | 1,1906 | |||||
| CCI / Crown Castle Inc. | 0,08 | 12,58 | 8,31 | 9,69 | 1,1786 | 0,1109 | |||
| BEPC / Brookfield Renewable Corporation | 0,22 | −3,68 | 7,16 | 12,94 | 1,0155 | 0,1220 | |||
| APTV / Aptiv PLC | 0,10 | −0,93 | 7,13 | 13,59 | 1,0113 | 0,1266 | |||
| LNTH / Lantheus Holdings, Inc. | 0,07 | 5,61 | 0,7958 | 0,7958 | |||||
| PCH / PotlatchDeltic Corporation | 0,06 | −12,37 | 2,32 | −23,84 | 0,3286 | −0,1002 | |||
| WY / Weyerhaeuser Company | 0,09 | −9,70 | 2,27 | −20,56 | 0,3224 | −0,0808 | |||
| AMH / American Homes 4 Rent | 0,05 | −9,65 | 1,87 | −13,64 | 0,2650 | −0,0398 | |||
| MAA / Mid-America Apartment Communities, Inc. | 0,01 | −7,02 | 1,56 | −17,14 | 0,2215 | −0,0441 | |||
| KRC / Kilroy Realty Corporation | 0,04 | 0,00 | 1,45 | 4,61 | 0,2061 | 0,0103 | |||
| COLD / Americold Realty Trust, Inc. | 0,08 | 0,00 | 1,39 | −22,92 | 0,1971 | −0,0571 | |||
| PLD / Prologis, Inc. | 0,01 | −66,16 | 1,39 | −67,67 | 0,1969 | −0,4079 | |||
| ARE / Alexandria Real Estate Equities, Inc. | 0,02 | −21,59 | 1,25 | −39,85 | 0,1774 | −0,1156 | |||
| STAG / STAG Industrial, Inc. | 0,03 | −48,63 | 1,23 | −47,74 | 0,1742 | −0,1569 | |||
| ADC / Agree Realty Corporation | 0,02 | 0,00 | 1,22 | −5,65 | 0,1731 | −0,0091 | |||
| PECO / Phillips Edison & Company, Inc. | 0,03 | 0,00 | 1,16 | −2,92 | 0,1650 | −0,0038 | |||
| JCI / Johnson Controls International plc | 0,01 | −20,44 | 1,09 | 4,91 | 0,1547 | 0,0082 | |||
| DE / Deere & Company | 0,00 | 0,00 | 1,02 | 10,31 | 0,1442 | 0,0143 | |||
| GXO / GXO Logistics, Inc. | 0,02 | 0,00 | 0,92 | 24,63 | 0,1300 | 0,0263 | |||
| VRT / Vertiv Holdings Co | 0,01 | 21,76 | 0,79 | 108,42 | 0,1125 | 0,0589 | |||
| BFAM / Bright Horizons Family Solutions Inc. | 0,01 | 0,00 | 0,73 | −3,43 | 0,1040 | −0,0030 | |||
| OC / Owens Corning | 0,00 | 6,10 | 0,66 | 2,64 | 0,0940 | 0,0031 | |||
| VITL / Vital Farms, Inc. | 0,02 | 0,00 | 0,65 | 30,44 | 0,0919 | 0,0219 | |||
| RYN / Rayonier Inc. | 0,03 | 0,00 | 0,61 | −20,52 | 0,0869 | −0,0218 | |||
| DBRG / DigitalBridge Group, Inc. | 0,06 | 0,00 | 0,58 | 15,63 | 0,0820 | 0,0116 | |||
| CMC / Commercial Metals Company | 0,01 | 0,00 | 0,49 | 8,26 | 0,0689 | 0,0057 | |||
| CSX / CSX Corporation | 0,00 | −100,00 | 0,00 | 0,0000 | |||||
| BXP / Boston Properties, Inc. | 0,00 | −100,00 | 0,00 | 0,0000 | |||||
| EASTERLY GOVT PPTYS INC / (27616P103) | 0,00 | −100,00 | 0,00 | 0,0000 | |||||
| HR / Healthcare Realty Trust Incorporated | 0,00 | −100,00 | 0,00 | 0,0000 | |||||
| LNG / Cheniere Energy, Inc. | 0,00 | −100,00 | 0,00 | 0,0000 |