Grundläggande statistik
| Portföljvärde | $ 64 578 843 |
| Aktuella positioner | 165 |
Senaste innehav, resultat, förvaltat kapital (från 13F, 13D)
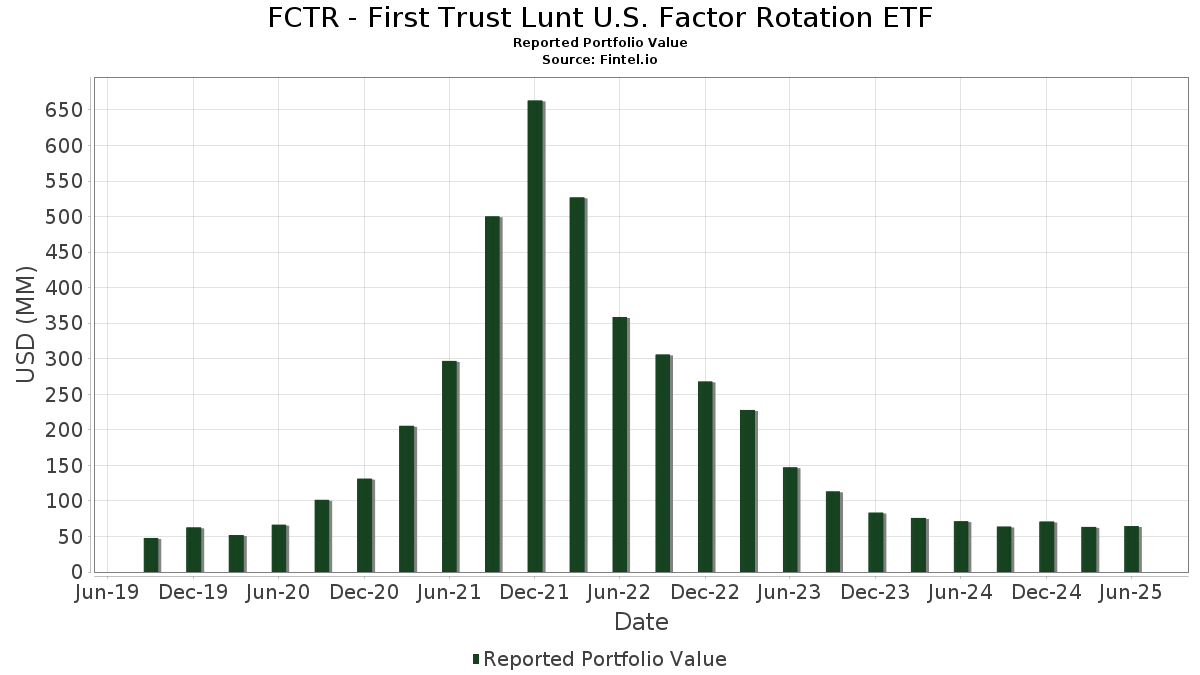
FCTR - First Trust Lunt U.S. Factor Rotation ETF har redovisat 165 totala innehav i sina senaste SEC-arkiveringar. Det senaste portföljvärdet beräknas vara $ 64 578 843 USD. Faktiskt förvaltade tillgångar (AUM) är detta värde plus likvida medel (som inte redovisas). FCTR - First Trust Lunt U.S. Factor Rotation ETFs största innehav är AppLovin Corporation (US:APP) , Republic Services, Inc. (US:RSG) , Visa Inc. (US:V) , Mastercard Incorporated (US:MA) , and Howmet Aerospace Inc. (US:HWM) . FCTR - First Trust Lunt U.S. Factor Rotation ETFs nya positioner inkluderar Sprouts Farmers Market, Inc. (US:SFM) , Tapestry, Inc. (US:TPR) , Guidewire Software, Inc. (US:GWRE) , Comfort Systems USA, Inc. (US:FIX) , and Toast, Inc. (US:TOST) .
Största ökningarna detta kvartal
Vi använder förändringen i portföljallokeringen eftersom det är det mest meningsfulla måttet. Förändringar kan bero på transaktioner eller förändringar i aktiekurser.
| Värdepapper | Aktier (MM) |
Värde (MM$) |
Portfölj % av | ΔPortfölj % av |
|---|---|---|---|---|
| 0,00 | 1,19 | 1,8351 | 1,5616 | |
| 0,01 | 0,85 | 1,3220 | 1,3220 | |
| 0,01 | 0,75 | 1,1615 | 1,1615 | |
| 0,00 | 0,70 | 1,0857 | 1,0857 | |
| 0,00 | 0,96 | 1,4887 | 0,9489 | |
| 0,00 | 0,98 | 1,5210 | 0,9337 | |
| 0,00 | 0,99 | 1,5277 | 0,8485 | |
| 0,00 | 0,52 | 0,8047 | 0,8047 | |
| 0,00 | 0,51 | 0,7878 | 0,7878 | |
| 0,00 | 0,46 | 0,7148 | 0,7148 |
Största minskningarna detta kvartal
Vi använder förändringen i portföljallokeringen eftersom det är det mest meningsfulla måttet. Förändringar kan bero på transaktioner eller förändringar i aktiepriser.
| Värdepapper | Aktier (MM) |
Värde (MM$) |
Portfölj % av | ΔPortfölj % av |
|---|---|---|---|---|
| 0,00 | 0,63 | 0,9707 | −2,5113 | |
| 0,00 | 0,33 | 0,5081 | −1,0837 | |
| 0,00 | 0,34 | 0,5215 | −1,0000 | |
| 0,00 | 0,39 | 0,6074 | −0,9738 | |
| 0,00 | 0,22 | 0,3436 | −0,9038 | |
| 0,00 | 0,35 | 0,5348 | −0,8143 | |
| 0,00 | 0,25 | 0,3857 | −0,7730 | |
| 0,00 | 0,35 | 0,5433 | −0,7051 | |
| 0,00 | 0,38 | 0,5830 | −0,6792 | |
| 0,01 | 1,77 | 2,7465 | −0,6275 |
13F- och fond arkiveringar
Denna blankett lämnades in den 2025-08-26 för rapporteringsperioden 2025-06-30. Klicka på länksymbolen för att se hela transaktionshistoriken.
Uppgradera för att låsa upp premiumdata och exportera till Excel![]() .
.
| Värdepapper | Typ | Genomsnittligt aktiepris | Aktier (MM) |
ΔAktier (%) |
ΔAktier (%) |
Värde ($MM) |
Portfölj (%) |
ΔPortfölj (%) |
|
|---|---|---|---|---|---|---|---|---|---|
| APP / AppLovin Corporation | 0,01 | −37,24 | 1,77 | −17,11 | 2,7465 | −0,6275 | |||
| RSG / Republic Services, Inc. | 0,00 | 571,23 | 1,19 | 584,97 | 1,8351 | 1,5616 | |||
| V / Visa Inc. | 0,00 | 12,84 | 1,12 | 14,30 | 1,7338 | 0,1890 | |||
| MA / Mastercard Incorporated | 0,00 | 7,95 | 1,03 | 10,63 | 1,5957 | 0,1270 | |||
| HWM / Howmet Aerospace Inc. | 0,01 | 17,28 | 1,01 | 68,23 | 1,5585 | 0,6151 | |||
| TPL / Texas Pacific Land Corporation | 0,00 | 187,38 | 0,99 | 129,30 | 1,5277 | 0,8485 | |||
| HEI / HEICO Corporation | 0,00 | −47,39 | 0,98 | 65,04 | 1,5210 | 0,9337 | |||
| NFLX / Netflix, Inc. | 0,00 | 95,64 | 0,96 | 180,99 | 1,4887 | 0,9489 | |||
| VRSK / Verisk Analytics, Inc. | 0,00 | 40,28 | 0,93 | 46,98 | 1,4343 | 0,4393 | |||
| CTAS / Cintas Corporation | 0,00 | 29,26 | 0,91 | 40,09 | 1,4131 | 0,3862 | |||
| BRO / Brown & Brown, Inc. | 0,01 | 41,73 | 0,89 | 26,28 | 1,3777 | 0,2667 | |||
| SFM / Sprouts Farmers Market, Inc. | 0,01 | 0,85 | 1,3220 | 1,3220 | |||||
| TPR / Tapestry, Inc. | 0,01 | 0,75 | 1,1615 | 1,1615 | |||||
| DASH / DoorDash, Inc. | 0,00 | 55,04 | 0,72 | 109,36 | 1,1095 | 0,5691 | |||
| CAH / Cardinal Health, Inc. | 0,00 | 0,70 | 1,0857 | 1,0857 | |||||
| TT / Trane Technologies plc | 0,00 | 16,52 | 0,68 | 51,33 | 1,0606 | 0,3464 | |||
| ECL / Ecolab Inc. | 0,00 | −80,91 | 0,66 | −78,09 | 1,0225 | 0,5682 | |||
| FDS / FactSet Research Systems Inc. | 0,00 | 16,80 | 0,64 | 14,98 | 0,9868 | 0,1121 | |||
| MCO / Moody's Corporation | 0,00 | 138,67 | 0,63 | 157,38 | 0,9731 | 0,5875 | |||
| PLTR / Palantir Technologies Inc. | 0,00 | −82,42 | 0,63 | −71,64 | 0,9707 | −2,5113 | |||
| ICE / Intercontinental Exchange, Inc. | 0,00 | −2,59 | 0,60 | 3,63 | 0,9295 | 0,0157 | |||
| SPGI / S&P Global Inc. | 0,00 | 75,51 | 0,59 | 82,24 | 0,9070 | 0,3998 | |||
| PGR / The Progressive Corporation | 0,00 | 62,84 | 0,56 | 53,41 | 0,8726 | 0,2937 | |||
| NET / Cloudflare, Inc. | 0,00 | −23,95 | 0,56 | 32,24 | 0,8705 | 0,1996 | |||
| CL / Colgate-Palmolive Company | 0,01 | −12,67 | 0,56 | −15,28 | 0,8671 | −0,1754 | |||
| BAH / Booz Allen Hamilton Holding Corporation | 0,01 | 363,45 | 0,55 | 196,26 | 0,8585 | 0,5654 | |||
| RCL / Royal Caribbean Cruises Ltd. | 0,00 | 6,65 | 0,55 | 62,80 | 0,8480 | 0,3166 | |||
| ITW / Illinois Tool Works Inc. | 0,00 | 7,82 | 0,54 | 7,55 | 0,8388 | 0,0440 | |||
| PANW / Palo Alto Networks, Inc. | 0,00 | 59,15 | 0,52 | 90,81 | 0,8048 | 0,3753 | |||
| AZO / AutoZone, Inc. | 0,00 | 0,52 | 0,8047 | 0,8047 | |||||
| TRGP / Targa Resources Corp. | 0,00 | 19,48 | 0,51 | 3,86 | 0,7919 | 0,0144 | |||
| GWRE / Guidewire Software, Inc. | 0,00 | 0,51 | 0,7878 | 0,7878 | |||||
| RBLX / Roblox Corporation | 0,00 | −19,01 | 0,51 | 46,40 | 0,7874 | 0,2386 | |||
| ADP / Automatic Data Processing, Inc. | 0,00 | −33,62 | 0,49 | −33,02 | 0,7645 | −0,3978 | |||
| AXON / Axon Enterprise, Inc. | 0,00 | −62,70 | 0,49 | −41,33 | 0,7550 | −0,5547 | |||
| AON / Aon plc | 0,00 | 61,03 | 0,48 | 65,86 | 0,7463 | 0,2912 | |||
| WMB / The Williams Companies, Inc. | 0,01 | 9,74 | 0,48 | 50,78 | 0,7459 | 0,2458 | |||
| GE / General Electric Company | 0,00 | −56,45 | 0,47 | −12,22 | 0,7349 | 0,0871 | |||
| MSTR / Strategy Inc | 0,00 | −57,89 | 0,47 | −40,99 | 0,7210 | −0,5229 | |||
| FIX / Comfort Systems USA, Inc. | 0,00 | 0,46 | 0,7148 | 0,7148 | |||||
| ROL / Rollins, Inc. | 0,01 | −31,66 | 0,45 | −28,59 | 0,7003 | −0,2993 | |||
| CRWD / CrowdStrike Holdings, Inc. | 0,00 | −27,12 | 0,45 | 5,13 | 0,6995 | 0,0227 | |||
| DUK / Duke Energy Corporation | 0,00 | 29,17 | 0,44 | 25,07 | 0,6884 | 0,1273 | |||
| NVDA / NVIDIA Corporation | 0,00 | −17,38 | 0,43 | 20,56 | 0,6722 | 0,1037 | |||
| WELL / Welltower Inc. | 0,00 | −93,54 | 0,43 | −89,68 | 0,6693 | −0,1250 | |||
| SNOW / Snowflake Inc. | 0,00 | −22,35 | 0,43 | 18,84 | 0,6656 | 0,0953 | |||
| AVGO / Broadcom Inc. | 0,00 | −6,84 | 0,43 | 53,41 | 0,6628 | 0,2226 | |||
| PG / The Procter & Gamble Company | 0,00 | 34,42 | 0,42 | 25,67 | 0,6532 | 0,1237 | |||
| TOST / Toast, Inc. | 0,01 | 0,42 | 0,6508 | 0,6508 | |||||
| ZS / Zscaler, Inc. | 0,00 | −19,50 | 0,42 | 27,44 | 0,6479 | 0,1297 | |||
| TTD / The Trade Desk, Inc. | 0,01 | 94,14 | 0,42 | 155,83 | 0,6461 | 0,3885 | |||
| AFL / Aflac Incorporated | 0,00 | 58,87 | 0,41 | 50,73 | 0,6402 | 0,2075 | |||
| KMB / Kimberly-Clark Corporation | 0,00 | 61,76 | 0,41 | 46,57 | 0,6290 | 0,1920 | |||
| LLY / Eli Lilly and Company | 0,00 | −16,91 | 0,41 | −21,47 | 0,6288 | −0,1879 | |||
| TMUS / T-Mobile US, Inc. | 0,00 | −24,51 | 0,40 | −12,83 | 0,6216 | −0,1004 | |||
| NOW / ServiceNow, Inc. | 0,00 | 23,96 | 0,40 | 59,84 | 0,6176 | 0,2246 | |||
| MSI / Motorola Solutions, Inc. | 0,00 | −59,26 | 0,39 | −60,88 | 0,6074 | −0,9738 | |||
| DDOG / Datadog, Inc. | 0,00 | 11,96 | 0,39 | 52,14 | 0,6054 | 0,1986 | |||
| BSX / Boston Scientific Corporation | 0,00 | 1,33 | 0,39 | 7,84 | 0,5965 | 0,0333 | |||
| LDOS / Leidos Holdings, Inc. | 0,00 | −28,20 | 0,38 | −16,15 | 0,5877 | −0,1254 | |||
| RMD / ResMed Inc. | 0,00 | −23,08 | 0,38 | 0,27 | 0,5856 | 0,0894 | |||
| FICO / Fair Isaac Corporation | 0,00 | −52,53 | 0,38 | −53,00 | 0,5830 | −0,6792 | |||
| JBL / Jabil Inc. | 0,00 | −53,61 | 0,37 | −24,44 | 0,5751 | −0,0714 | |||
| EQH / Equitable Holdings, Inc. | 0,01 | −72,37 | 0,37 | −15,12 | 0,5664 | 0,1421 | |||
| ADBE / Adobe Inc. | 0,00 | 103,89 | 0,37 | 106,21 | 0,5655 | 0,2854 | |||
| LIN / Linde plc | 0,00 | 0,37 | 0,5652 | 0,5652 | |||||
| SPG / Simon Property Group, Inc. | 0,00 | 0,36 | 0,5580 | 0,5580 | |||||
| ORCL / Oracle Corporation | 0,00 | −11,36 | 0,36 | 38,76 | 0,5545 | 0,1470 | |||
| IBM / International Business Machines Corporation | 0,00 | 0,36 | 0,5541 | 0,5541 | |||||
| ALNY / Alnylam Pharmaceuticals, Inc. | 0,00 | 0,46 | 0,36 | 21,43 | 0,5534 | 0,0888 | |||
| WAB / Westinghouse Air Brake Technologies Corporation | 0,00 | 0,36 | 0,5517 | 0,5517 | |||||
| MMC / Marsh & McLennan Companies, Inc. | 0,00 | 3,79 | 0,35 | −7,11 | 0,5474 | −0,0522 | |||
| VRSN / VeriSign, Inc. | 0,00 | −61,03 | 0,35 | −55,75 | 0,5433 | −0,7051 | |||
| CDNS / Cadence Design Systems, Inc. | 0,00 | 2,06 | 0,35 | 23,67 | 0,5425 | 0,0956 | |||
| SYK / Stryker Corporation | 0,00 | −62,01 | 0,35 | −59,65 | 0,5348 | −0,8143 | |||
| ANET / Arista Networks Inc | 0,00 | −60,53 | 0,34 | −47,96 | 0,5341 | −0,5099 | |||
| AMP / Ameriprise Financial, Inc. | 0,00 | 1,10 | 0,34 | 15,10 | 0,5314 | 0,0630 | |||
| ISRG / Intuitive Surgical, Inc. | 0,00 | −43,62 | 0,34 | −38,21 | 0,5242 | −0,3389 | |||
| TDG / TransDigm Group Incorporated | 0,00 | −55,60 | 0,34 | −51,23 | 0,5227 | −0,5681 | |||
| BR / Broadridge Financial Solutions, Inc. | 0,00 | −65,17 | 0,34 | −65,15 | 0,5215 | −1,0000 | |||
| TSLA / Tesla, Inc. | 0,00 | 0,34 | 0,5189 | 0,5189 | |||||
| PAYX / Paychex, Inc. | 0,00 | −65,52 | 0,33 | −67,49 | 0,5081 | −1,0837 | |||
| MSCI / MSCI Inc. | 0,00 | 7,22 | 0,33 | 9,43 | 0,5036 | 0,0345 | |||
| CSCO / Cisco Systems, Inc. | 0,00 | 70,17 | 0,32 | 91,12 | 0,5012 | 0,2344 | |||
| COR / Cencora, Inc. | 0,00 | −3,42 | 0,32 | 29,32 | 0,4986 | 0,1462 | |||
| INTU / Intuit Inc. | 0,00 | 13,41 | 0,32 | 45,66 | 0,4951 | 0,1485 | |||
| CBRE / CBRE Group, Inc. | 0,00 | 0,32 | 0,4946 | 0,4946 | |||||
| NTNX / Nutanix, Inc. | 0,00 | −63,33 | 0,31 | −52,71 | 0,4870 | −0,5552 | |||
| JNJ / Johnson & Johnson | 0,00 | −7,28 | 0,31 | −12,61 | 0,4728 | −0,0750 | |||
| PH / Parker-Hannifin Corporation | 0,00 | −27,29 | 0,31 | −16,44 | 0,4726 | −0,1036 | |||
| DTE / DTE Energy Company | 0,00 | 3,65 | 0,30 | −0,65 | 0,4713 | −0,0122 | |||
| CPAY / Corpay, Inc. | 0,00 | 103,79 | 0,30 | 93,59 | 0,4691 | 0,2227 | |||
| GRMN / Garmin Ltd. | 0,00 | 0,30 | 0,4663 | 0,4663 | |||||
| GS / The Goldman Sachs Group, Inc. | 0,00 | 0,30 | 0,4646 | 0,4646 | |||||
| O / Realty Income Corporation | 0,01 | 7,13 | 0,30 | 6,43 | 0,4625 | 0,0197 | |||
| L / Loews Corporation | 0,00 | −30,67 | 0,30 | −24,94 | 0,4622 | −0,0990 | |||
| HON / Honeywell International Inc. | 0,00 | 87,94 | 0,30 | 107,69 | 0,4608 | 0,2337 | |||
| MCK / McKesson Corporation | 0,00 | −13,98 | 0,30 | 27,47 | 0,4606 | 0,0948 | |||
| AJG / Arthur J. Gallagher & Co. | 0,00 | −2,32 | 0,30 | 25,42 | 0,4585 | 0,1471 | |||
| LH / Labcorp Holdings Inc. | 0,00 | 0,30 | 0,4581 | 0,4581 | |||||
| FAST / Fastenal Company | 0,01 | 72,63 | 0,30 | −6,65 | 0,4578 | −0,0410 | |||
| WM / Waste Management, Inc. | 0,00 | 100,94 | 0,29 | 98,65 | 0,4563 | 0,2223 | |||
| ADSK / Autodesk, Inc. | 0,00 | 11,35 | 0,29 | 31,84 | 0,4563 | 0,1033 | |||
| IRM / Iron Mountain Incorporated | 0,00 | −20,54 | 0,29 | −5,16 | 0,4559 | −0,0343 | |||
| STE / STERIS plc | 0,00 | −48,63 | 0,29 | −25,82 | 0,4545 | 0,3252 | |||
| NWSA / News Corporation | 0,01 | 0,29 | 0,4527 | 0,4527 | |||||
| OTIS / Otis Worldwide Corporation | 0,00 | −5,15 | 0,29 | −9,69 | 0,4489 | −0,0541 | |||
| EXC / Exelon Corporation | 0,01 | −3,99 | 0,29 | −9,46 | 0,4453 | −0,0561 | |||
| MSFT / Microsoft Corporation | 0,00 | 4,35 | 0,29 | 38,16 | 0,4436 | 0,1168 | |||
| ARES / Ares Management Corporation | 0,00 | −58,00 | 0,29 | −50,43 | 0,4435 | −0,4670 | |||
| MRVL / Marvell Technology, Inc. | 0,00 | −76,71 | 0,29 | −66,78 | 0,4426 | −0,3149 | |||
| SNPS / Synopsys, Inc. | 0,00 | 8,61 | 0,28 | 29,68 | 0,4405 | 0,0949 | |||
| CNP / CenterPoint Energy, Inc. | 0,01 | −88,32 | 0,28 | −85,53 | 0,4397 | −0,1055 | |||
| VLTO / Veralto Corporation | 0,00 | 0,28 | 0,4297 | 0,4297 | |||||
| MO / Altria Group, Inc. | 0,00 | −64,35 | 0,28 | −52,08 | 0,4294 | −0,3316 | |||
| LNT / Alliant Energy Corporation | 0,00 | −13,98 | 0,28 | −19,30 | 0,4286 | −0,1115 | |||
| J / Jacobs Solutions Inc. | 0,00 | 0,28 | 0,4282 | 0,4282 | |||||
| XEL / Xcel Energy Inc. | 0,00 | 0,28 | 0,4273 | 0,4273 | |||||
| ROP / Roper Technologies, Inc. | 0,00 | −4,89 | 0,28 | −8,64 | 0,4265 | −0,0486 | |||
| FTNT / Fortinet, Inc. | 0,00 | −25,49 | 0,28 | 1,48 | 0,4262 | 0,0014 | |||
| VICI / VICI Properties Inc. | 0,01 | −34,68 | 0,27 | −34,76 | 0,4255 | −0,2384 | |||
| HIG / The Hartford Insurance Group, Inc. | 0,00 | 4,42 | 0,27 | 20,89 | 0,4225 | 0,1047 | |||
| FI / Fiserv, Inc. | 0,00 | −45,18 | 0,27 | −57,26 | 0,4207 | −0,5806 | |||
| SYY / Sysco Corporation | 0,00 | −47,16 | 0,27 | −46,81 | 0,4147 | −0,3773 | |||
| ORLY / O'Reilly Automotive, Inc. | 0,00 | 1 094,69 | 0,26 | −24,86 | 0,4085 | −0,1451 | |||
| HLT / Hilton Worldwide Holdings Inc. | 0,00 | −23,86 | 0,26 | −12,12 | 0,4054 | −0,0611 | |||
| HUBS / HubSpot, Inc. | 0,00 | −5,81 | 0,26 | −8,42 | 0,4051 | −0,0445 | |||
| AME / AMETEK, Inc. | 0,00 | 88,93 | 0,25 | 99,21 | 0,3923 | 0,1911 | |||
| TSN / Tyson Foods, Inc. | 0,00 | −29,31 | 0,25 | −31,32 | 0,3885 | −0,1256 | |||
| CTSH / Cognizant Technology Solutions Corporation | 0,00 | 0,25 | 0,3883 | 0,3883 | |||||
| YUM / Yum! Brands, Inc. | 0,00 | −64,00 | 0,25 | −66,08 | 0,3857 | −0,7730 | |||
| UNP / Union Pacific Corporation | 0,00 | −0,92 | 0,25 | −7,81 | 0,3854 | −0,0365 | |||
| MDT / Medtronic plc | 0,00 | −7,73 | 0,25 | −10,47 | 0,3849 | −0,0531 | |||
| MAA / Mid-America Apartment Communities, Inc. | 0,00 | −29,50 | 0,25 | −20,83 | 0,3839 | −0,0272 | |||
| EQR / Equity Residential | 0,00 | 0,58 | 0,25 | −5,00 | 0,3825 | −0,0284 | |||
| PFE / Pfizer Inc. | 0,01 | −31,23 | 0,24 | −40,00 | 0,3728 | −0,1542 | |||
| PSA / Public Storage | 0,00 | 23,15 | 0,23 | 20,53 | 0,3553 | 0,0555 | |||
| MCD / McDonald's Corporation | 0,00 | −47,66 | 0,23 | −51,09 | 0,3488 | −0,3769 | |||
| AAPL / Apple Inc. | 0,00 | −40,67 | 0,23 | −45,12 | 0,3485 | −0,2993 | |||
| EQIX / Equinix, Inc. | 0,00 | −93,96 | 0,22 | −94,04 | 0,3436 | −0,9038 | |||
| BKNG / Booking Holdings Inc. | 0,00 | −2,63 | 0,21 | 22,29 | 0,3316 | 0,0556 | |||
| META / Meta Platforms, Inc. | 0,00 | −47,73 | 0,21 | −33,12 | 0,3291 | −0,1717 | |||
| BDX / Becton, Dickinson and Company | 0,00 | 1,61 | 0,21 | −23,42 | 0,3192 | −0,1063 | |||
| CASY / Casey's General Stores, Inc. | 0,00 | 0,20 | 0,3160 | 0,3160 | |||||
| APH / Amphenol Corporation | 0,00 | 0,20 | 0,3088 | 0,3088 | |||||
| SNA / Snap-on Incorporated | 0,00 | −53,48 | 0,18 | −43,49 | 0,2770 | −0,0012 | |||
| FTV / Fortive Corporation | 0,00 | 0,18 | 0,2741 | 0,2741 | |||||
| AIG / American International Group, Inc. | 0,00 | −60,46 | 0,17 | −53,55 | 0,2634 | −0,2529 | |||
| ETN / Eaton Corporation plc | 0,00 | −17,94 | 0,16 | 7,19 | 0,2554 | 0,0140 | |||
| WRB / W. R. Berkley Corporation | 0,00 | −28,51 | 0,16 | −7,51 | 0,2484 | −0,0232 | |||
| USFD / US Foods Holding Corp. | 0,00 | 0,16 | 0,2446 | 0,2446 | |||||
| CSL / Carlisle Companies Incorporated | 0,00 | −24,01 | 0,15 | −16,67 | 0,2324 | −0,0517 | |||
| CME / CME Group Inc. | 0,00 | 0,15 | 0,2275 | 0,2275 | |||||
| AMT / American Tower Corporation | 0,00 | −38,39 | 0,15 | −37,50 | 0,2252 | −0,1413 | |||
| SO / The Southern Company | 0,00 | −52,97 | 0,14 | −53,09 | 0,2239 | −0,2617 | |||
| AEP / American Electric Power Company, Inc. | 0,00 | −52,42 | 0,14 | −54,87 | 0,2159 | −0,2709 | |||
| AVY / Avery Dennison Corporation | 0,00 | −37,91 | 0,14 | −50,89 | 0,2149 | −0,2260 | |||
| LII / Lennox International Inc. | 0,00 | −41,71 | 0,14 | −40,17 | 0,2121 | −0,1505 | |||
| ZTS / Zoetis Inc. | 0,00 | −39,06 | 0,13 | −51,64 | 0,2072 | −0,2241 | |||
| ESS / Essex Property Trust, Inc. | 0,00 | 0,13 | 0,2014 | 0,2014 | |||||
| GIS / General Mills, Inc. | 0,00 | −35,19 | 0,12 | −44,14 | 0,1931 | −0,1571 | |||
| MRK / Merck & Co., Inc. | 0,00 | 0,12 | 0,1859 | 0,1859 | |||||
| WSO / Watsco, Inc. | 0,00 | 0,12 | 0,1853 | 0,1853 | |||||
| RAL / Ralliant Corporation | 0,00 | 0,05 | 0,0849 | 0,0849 | |||||
| US61747C5821 / Morgan Stanley Institutional Liquidity Funds - Treasury Portfolio | 0,03 | −22,50 | 0,03 | −23,08 | 0,0475 | −0,0149 | |||
| 1KO / The Coca-Cola Company | 0,00 | −100,00 | 0,00 | −100,00 | −0,5947 |