Grundläggande statistik
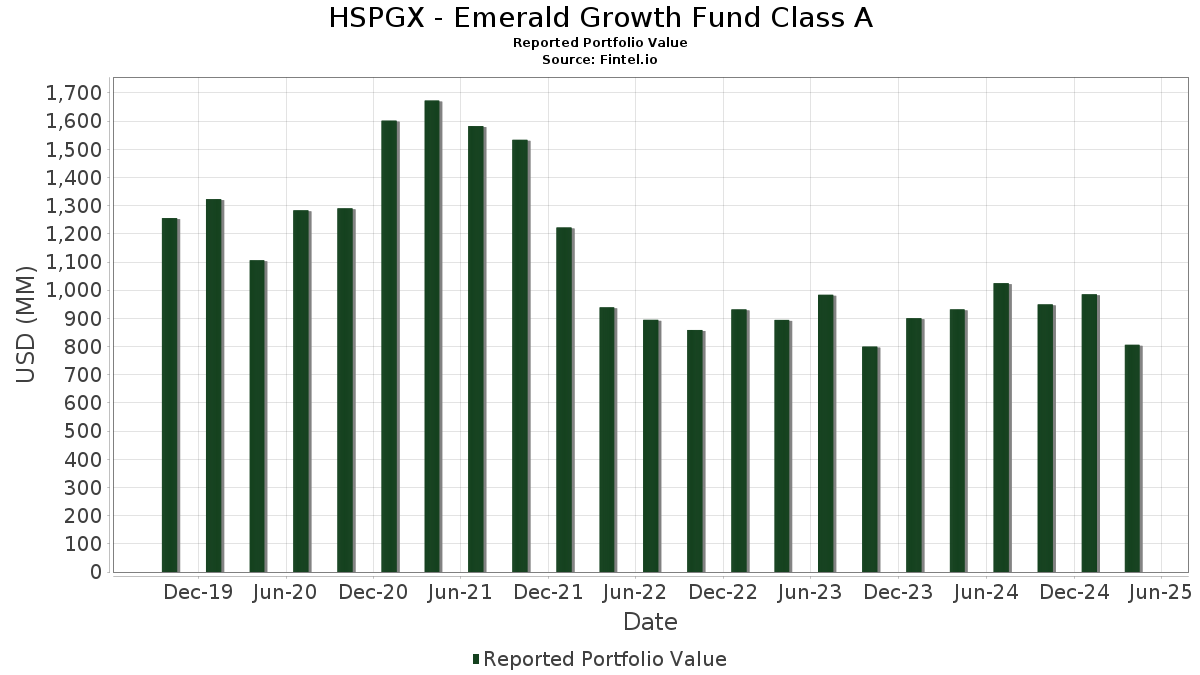
| Portföljvärde | $ 806 235 877 |
| Aktuella positioner | 121 |
Senaste innehav, resultat, förvaltat kapital (från 13F, 13D)
HSPGX - Emerald Growth Fund Class A har redovisat 121 totala innehav i sina senaste SEC-arkiveringar. Det senaste portföljvärdet beräknas vara $ 806 235 877 USD. Faktiskt förvaltade tillgångar (AUM) är detta värde plus likvida medel (som inte redovisas). HSPGX - Emerald Growth Fund Class As största innehav är The RBB Fund, Inc. - F/m Emerald Life Sciences Innovation ETF (US:LFSC) , Credo Technology Group Holding Ltd (US:CRDO) , Palomar Holdings, Inc. (US:PLMR) , Kratos Defense & Security Solutions, Inc. (US:KTOS) , and FTAI Aviation Ltd. (US:FTAI) . HSPGX - Emerald Growth Fund Class As nya positioner inkluderar VSE Corporation (US:VSEC) , Life Time Group Holdings, Inc. (US:LTH) , Corcept Therapeutics Incorporated (GB:0I3Q) , WesBanco, Inc. (US:WSBC) , and .
Största ökningarna detta kvartal
Vi använder förändringen i portföljallokeringen eftersom det är det mest meningsfulla måttet. Förändringar kan bero på transaktioner eller förändringar i aktiekurser.
| Värdepapper | Aktier (MM) |
Värde (MM$) |
Portfölj % av | ΔPortfölj % av |
|---|---|---|---|---|
| 0,08 | 9,42 | 1,1685 | 1,1685 | |
| 0,22 | 16,12 | 1,9992 | 1,0437 | |
| 0,26 | 7,83 | 0,9706 | 0,9706 | |
| 0,17 | 7,91 | 0,9808 | 0,8149 | |
| 0,32 | 16,83 | 2,0869 | 0,6572 | |
| 0,13 | 11,99 | 1,4866 | 0,5912 | |
| 0,22 | 5,21 | 0,6465 | 0,5516 | |
| 0,06 | 12,72 | 1,5770 | 0,5461 | |
| 0,18 | 8,89 | 1,1021 | 0,5195 | |
| 0,02 | 6,40 | 0,7931 | 0,4874 |
Största minskningarna detta kvartal
Vi använder förändringen i portföljallokeringen eftersom det är det mest meningsfulla måttet. Förändringar kan bero på transaktioner eller förändringar i aktiepriser.
| Värdepapper | Aktier (MM) |
Värde (MM$) |
Portfölj % av | ΔPortfölj % av |
|---|---|---|---|---|
| 0,20 | 14,64 | 1,8146 | −1,4232 | |
| 0,47 | 20,20 | 2,5052 | −0,8375 | |
| 0,09 | 3,23 | 0,4005 | −0,8094 | |
| 0,00 | 0,00 | −0,5942 | ||
| 0,10 | 8,04 | 0,9966 | −0,5095 | |
| 0,11 | 14,29 | 1,7718 | −0,5067 | |
| 0,12 | 6,45 | 0,7997 | −0,4686 | |
| 0,00 | 0,00 | −0,4613 | ||
| 0,02 | 0,91 | 0,1132 | −0,3841 | |
| 0,15 | 0,95 | 0,1174 | −0,3806 |
13F- och fond arkiveringar
Denna blankett lämnades in den 2025-06-25 för rapporteringsperioden 2025-04-30. Klicka på länksymbolen för att se hela transaktionshistoriken.
Uppgradera för att låsa upp premiumdata och exportera till Excel![]() .
.
| Värdepapper | Typ | Genomsnittligt aktiepris | Aktier (MM) |
ΔAktier (%) |
ΔAktier (%) |
Värde ($MM) |
Portfölj (%) |
ΔPortfölj (%) |
|
|---|---|---|---|---|---|---|---|---|---|
| LFSC / The RBB Fund, Inc. - F/m Emerald Life Sciences Innovation ETF | 2,00 | 0,00 | 45,97 | −12,08 | 5,6999 | 0,3814 | |||
| CRDO / Credo Technology Group Holding Ltd | 0,47 | 0,00 | 20,20 | −38,52 | 2,5052 | −0,8375 | |||
| PLMR / Palomar Holdings, Inc. | 0,13 | −30,87 | 19,57 | −7,06 | 2,4269 | 0,2848 | |||
| KTOS / Kratos Defense & Security Solutions, Inc. | 0,55 | 0,00 | 18,70 | 1,24 | 2,3183 | 0,4398 | |||
| FTAI / FTAI Aviation Ltd. | 0,16 | −24,09 | 17,52 | −19,13 | 2,1727 | −0,0312 | |||
| SKWD / Skyward Specialty Insurance Group, Inc. | 0,32 | −0,13 | 16,83 | 19,74 | 2,0869 | 0,6572 | |||
| SLNO / Soleno Therapeutics, Inc. | 0,22 | 15,17 | 16,12 | 71,64 | 1,9992 | 1,0437 | |||
| CRS / Carpenter Technology Corporation | 0,08 | 0,00 | 14,86 | 1,32 | 1,8425 | 0,3507 | |||
| FRPT / Freshpet, Inc. | 0,20 | 0,00 | 14,64 | −54,02 | 1,8146 | −1,4232 | |||
| GTLS / Chart Industries, Inc. | 0,11 | 0,00 | 14,29 | −36,21 | 1,7718 | −0,5067 | |||
| VRNS / Varonis Systems, Inc. | 0,33 | 0,00 | 14,21 | −5,56 | 1,7621 | 0,2315 | |||
| QTWO / Q2 Holdings, Inc. | 0,18 | 3,15 | 13,99 | −14,11 | 1,7351 | 0,0779 | |||
| BBIO / BridgeBio Pharma, Inc. | 0,36 | 0,00 | 13,74 | 12,13 | 1,7040 | 0,4573 | |||
| AX / Axos Financial, Inc. | 0,21 | 0,00 | 13,36 | −9,22 | 1,6570 | 0,1595 | |||
| AVAV / AeroVironment, Inc. | 0,09 | 7,94 | 12,93 | −9,22 | 1,6030 | 0,1545 | |||
| VITL / Vital Farms, Inc. | 0,38 | 13,41 | 12,89 | −11,50 | 1,5988 | 0,1169 | |||
| INSM / Insmed Incorporated | 0,18 | −10,39 | 12,89 | −15,75 | 1,5977 | 0,0419 | |||
| IDCC / InterDigital, Inc. | 0,06 | 14,24 | 12,72 | 25,50 | 1,5770 | 0,5461 | |||
| TMDX / TransMedics Group, Inc. | 0,13 | 0,00 | 11,99 | 36,21 | 1,4866 | 0,5912 | |||
| ATI / ATI Inc. | 0,22 | −7,30 | 11,96 | −11,71 | 1,4824 | 0,1051 | |||
| BWIN / The Baldwin Insurance Group, Inc. | 0,28 | −12,13 | 11,49 | −10,69 | 1,4246 | 0,1160 | |||
| RDNT / RadNet, Inc. | 0,21 | −3,70 | 11,25 | −22,95 | 1,3954 | −0,0904 | |||
| OLLI / Ollie's Bargain Outlet Holdings, Inc. | 0,11 | 2,16 | 11,18 | −2,79 | 1,3859 | 0,2163 | |||
| TTMI / TTM Technologies, Inc. | 0,56 | 30,58 | 11,13 | 6,31 | 1,3801 | 0,3151 | |||
| FN / Fabrinet | 0,05 | 11,92 | 11,05 | 6,15 | 1,3704 | 0,3113 | |||
| BPMC / Blueprint Medicines Corporation | 0,12 | −7,90 | 10,93 | −26,75 | 1,3551 | −0,1626 | |||
| MC / Moelis & Company | 0,20 | 0,00 | 10,83 | −31,56 | 1,3429 | −0,2669 | |||
| FGXXX / First American Funds Inc - First American Government Obligations Fund Class X | 10,81 | 26,34 | 10,81 | 26,34 | 1,3405 | 0,4701 | |||
| TVTX / Travere Therapeutics, Inc. | 0,48 | −2,77 | 10,00 | −1,10 | 1,2400 | 0,2114 | |||
| VSEC / VSE Corporation | 0,08 | 9,42 | 1,1685 | 1,1685 | |||||
| MOD / Modine Manufacturing Company | 0,11 | 0,00 | 9,15 | −19,53 | 1,1339 | −0,0220 | |||
| RMBS / Rambus Inc. | 0,18 | −20,84 | 8,93 | −37,32 | 1,1075 | −0,3421 | |||
| LITE / Lumentum Holdings Inc. | 0,15 | 0,00 | 8,89 | −30,59 | 1,1025 | −0,2006 | |||
| TBBK / The Bancorp, Inc. | 0,18 | 96,13 | 8,89 | 55,17 | 1,1021 | 0,5195 | |||
| FOUR / Shift4 Payments, Inc. | 0,10 | −20,47 | 8,04 | −45,72 | 0,9966 | −0,5095 | |||
| GH / Guardant Health, Inc. | 0,17 | 382,44 | 7,91 | 385,28 | 0,9808 | 0,8149 | |||
| LTH / Life Time Group Holdings, Inc. | 0,26 | 7,83 | 0,9706 | 0,9706 | |||||
| LPX / Louisiana-Pacific Corporation | 0,09 | 0,00 | 7,67 | −26,21 | 0,9508 | −0,1063 | |||
| WVE / Wave Life Sciences Ltd. | 0,96 | 0,00 | 7,43 | −33,28 | 0,9217 | −0,2115 | |||
| MMSI / Merit Medical Systems, Inc. | 0,08 | −14,64 | 7,38 | −25,95 | 0,9145 | −0,0986 | |||
| MTSI / MACOM Technology Solutions Holdings, Inc. | 0,07 | 0,00 | 7,35 | −21,55 | 0,9117 | −0,0417 | |||
| SPXC / SPX Technologies, Inc. | 0,05 | 0,00 | 7,13 | −9,68 | 0,8840 | 0,0811 | |||
| TREE / LendingTree, Inc. | 0,14 | 0,00 | 7,06 | 14,83 | 0,8758 | 0,2501 | |||
| COLL / Collegium Pharmaceutical, Inc. | 0,26 | −8,61 | 7,02 | −23,19 | 0,8707 | −0,0592 | |||
| FORM / FormFactor, Inc. | 0,24 | 0,00 | 6,83 | −29,75 | 0,8473 | −0,1420 | |||
| PDFS / PDF Solutions, Inc. | 0,36 | −3,20 | 6,66 | −36,25 | 0,8253 | −0,2366 | |||
| AIR / AAR Corp. | 0,12 | −34,44 | 6,45 | −48,28 | 0,7997 | −0,4686 | |||
| MDGL / Madrigal Pharmaceuticals, Inc. | 0,02 | 113,40 | 6,40 | 112,85 | 0,7931 | 0,4874 | |||
| BJRI / BJ's Restaurants, Inc. | 0,19 | 0,00 | 6,39 | −8,02 | 0,7926 | 0,0857 | |||
| AGYS / Agilysys, Inc. | 0,08 | 0,00 | 6,30 | −17,59 | 0,7814 | 0,0035 | |||
| OSW / OneSpaWorld Holdings Limited | 0,37 | 0,00 | 6,23 | −21,82 | 0,7727 | −0,0381 | |||
| FA / First Advantage Corporation | 0,44 | 0,00 | 6,22 | −25,32 | 0,7708 | −0,0759 | |||
| SITM / SiTime Corporation | 0,04 | 143,56 | 6,00 | 75,15 | 0,7439 | 0,3955 | |||
| RHP / Ryman Hospitality Properties, Inc. | 0,07 | 0,00 | 5,91 | −16,11 | 0,7322 | 0,0162 | |||
| TENB / Tenable Holdings, Inc. | 0,19 | −9,52 | 5,78 | −35,81 | 0,7168 | −0,1993 | |||
| ARLO / Arlo Technologies, Inc. | 0,58 | 18,29 | 5,66 | −0,68 | 0,7023 | 0,1221 | |||
| PI / Impinj, Inc. | 0,06 | 13,96 | 5,43 | −17,26 | 0,6735 | 0,0057 | |||
| BOOT / Boot Barn Holdings, Inc. | 0,05 | 55,96 | 5,43 | 1,17 | 0,6727 | 0,1272 | |||
| RARE / Ultragenyx Pharmaceutical Inc. | 0,14 | −17,54 | 5,28 | −25,30 | 0,6545 | −0,0643 | |||
| EVER / EverQuote, Inc. | 0,22 | 375,69 | 5,21 | 459,44 | 0,6465 | 0,5516 | |||
| UMBF / UMB Financial Corporation | 0,05 | 13,91 | 5,14 | −8,62 | 0,6377 | 0,0651 | |||
| PTLO / Portillo's Inc. | 0,49 | 0,00 | 5,09 | −25,66 | 0,6310 | −0,0654 | |||
| ATEC / Alphatec Holdings, Inc. | 0,46 | 21,30 | 5,04 | 12,97 | 0,6254 | 0,1712 | |||
| TRIN / Trinity Capital Inc. | 0,34 | 0,00 | 4,92 | −5,04 | 0,6103 | 0,0831 | |||
| KALV / KalVista Pharmaceuticals, Inc. | 0,36 | 0,00 | 4,92 | 54,57 | 0,6101 | 0,2862 | |||
| US60471A1016 / Mirion Technologies, Inc. | 0,30 | 273,06 | 4,80 | 271,83 | 0,5957 | 0,4642 | |||
| CCOI / Cogent Communications Holdings, Inc. | 0,08 | 0,00 | 4,57 | −27,86 | 0,5663 | −0,0777 | |||
| ALGT / Allegiant Travel Company | 0,09 | 35,52 | 4,45 | −37,91 | 0,5518 | −0,1773 | |||
| MPB / Mid Penn Bancorp, Inc. | 0,15 | 0,82 | 4,29 | −2,77 | 0,5314 | 0,0831 | |||
| RSI / Rush Street Interactive, Inc. | 0,35 | 102,92 | 4,23 | 68,84 | 0,5240 | 0,2694 | |||
| ARHS / Arhaus, Inc. | 0,53 | 0,00 | 4,18 | −35,99 | 0,5178 | −0,1459 | |||
| BOW / Bowhead Specialty Holdings Inc. | 0,10 | 0,00 | 4,03 | 24,29 | 0,5000 | 0,1700 | |||
| EYE / National Vision Holdings, Inc. | 0,31 | 24,37 | 3,89 | 34,71 | 0,4818 | 0,1884 | |||
| RXO / RXO, Inc. | 0,27 | −12,73 | 3,74 | −52,07 | 0,4635 | −0,3297 | |||
| 0I3Q / Corcept Therapeutics Incorporated | 0,05 | 3,66 | 0,4533 | 0,4533 | |||||
| CWAN / Clearwater Analytics Holdings, Inc. | 0,16 | 0,00 | 3,60 | −19,25 | 0,4458 | −0,0071 | |||
| LIF / Life360, Inc. | 0,08 | 29,46 | 3,59 | 21,49 | 0,4451 | 0,1445 | |||
| ETNB / 89bio, Inc. | 0,42 | −13,93 | 3,37 | −28,09 | 0,4184 | −0,0590 | |||
| KLIC / Kulicke and Soffa Industries, Inc. | 0,10 | −31,33 | 3,25 | −50,09 | 0,4031 | −0,2596 | |||
| LIVN / LivaNova PLC | 0,09 | −63,34 | 3,23 | −72,85 | 0,4005 | −0,8094 | |||
| CCB / Coastal Financial Corporation | 0,04 | 34,91 | 3,22 | 24,25 | 0,3997 | 0,1358 | |||
| SVRA / Savara Inc. | 1,00 | 33,88 | 3,21 | 58,65 | 0,3982 | 0,1923 | |||
| OFIX / Orthofix Medical Inc. | 0,23 | −19,69 | 3,19 | −39,06 | 0,3957 | −0,1370 | |||
| CHDN / Churchill Downs Incorporated | 0,03 | −23,42 | 3,10 | −43,97 | 0,3838 | −0,1782 | |||
| AAOI / Applied Optoelectronics, Inc. | 0,23 | −11,22 | 2,88 | −59,33 | 0,3571 | −0,3632 | |||
| MARA / MARA Holdings, Inc. | 0,21 | 109,34 | 2,85 | 52,68 | 0,3536 | 0,1635 | |||
| EE / Excelerate Energy, Inc. | 0,11 | −46,34 | 2,85 | −35,33 | 0,3529 | −0,0919 | |||
| CVLT / Commvault Systems, Inc. | 0,02 | 0,00 | 2,84 | 4,94 | 0,3527 | 0,0770 | |||
| NSSC / Napco Security Technologies, Inc. | 0,12 | −24,67 | 2,83 | −53,10 | 0,3515 | −0,2632 | |||
| BUSE / First Busey Corporation | 0,13 | 0,00 | 2,71 | −14,39 | 0,3357 | 0,0141 | |||
| ABCB / Ameris Bancorp | 0,04 | −71,97 | 2,61 | −59,14 | 0,3240 | −0,1621 | |||
| SKYT / SkyWater Technology, Inc. | 0,37 | 0,00 | 2,61 | −31,37 | 0,3232 | −0,0631 | |||
| SEI / Solaris Energy Infrastructure, Inc. | 0,11 | −35,79 | 2,37 | −50,25 | 0,2935 | −0,1906 | |||
| AKRO / Akero Therapeutics, Inc. | 0,05 | −53,72 | 2,36 | −60,98 | 0,2929 | −0,3228 | |||
| BE / Bloom Energy Corporation | 0,13 | 0,00 | 2,34 | −22,31 | 0,2907 | −0,0163 | |||
| SYRE / Spyre Therapeutics, Inc. | 0,14 | −29,73 | 2,18 | −53,46 | 0,2709 | −0,2065 | |||
| PAL / Proficient Auto Logistics, Inc. | 0,26 | 134,83 | 2,16 | 98,44 | 0,2677 | 0,1570 | |||
| ACAD / ACADIA Pharmaceuticals Inc. | 0,15 | −42,47 | 2,13 | −55,00 | 0,2640 | −0,2171 | |||
| SOC / Sable Offshore Corp. | 0,10 | 0,00 | 1,95 | −25,16 | 0,2420 | −0,0232 | |||
| SPT / Sprout Social, Inc. | 0,09 | 0,00 | 1,94 | −36,01 | 0,2411 | −0,0679 | |||
| PWP / Perella Weinberg Partners | 0,11 | 34,78 | 1,93 | −10,37 | 0,2390 | 0,0202 | |||
| UTZ / Utz Brands, Inc. | 0,14 | 0,00 | 1,93 | −0,52 | 0,2387 | 0,0418 | |||
| FFIN / First Financial Bankshares, Inc. | 0,06 | 0,00 | 1,85 | −10,08 | 0,2290 | 0,0201 | |||
| STC / Stewart Information Services Corporation | 0,03 | 0,00 | 1,74 | 0,46 | 0,2159 | 0,0396 | |||
| BHVN / Biohaven Ltd. | 0,08 | −31,63 | 1,74 | −60,48 | 0,2152 | −0,2314 | |||
| FLOC / Flowco Holdings Inc. | 0,09 | 0,00 | 1,66 | −31,00 | 0,2056 | −0,0389 | |||
| ITGR / Integer Holdings Corporation | 0,01 | −18,06 | 1,64 | −27,23 | 0,2032 | −0,0259 | |||
| INR / Infinity Natural Resources, Inc. | 0,10 | −40,34 | 1,53 | −56,54 | 0,1893 | −0,1679 | |||
| NVCR / NovoCure Limited | 0,08 | −49,38 | 1,51 | −62,55 | 0,1876 | −0,2234 | |||
| SWIM / Latham Group, Inc. | 0,21 | 7,47 | 1,15 | −19,53 | 0,1431 | −0,0028 | |||
| NWFL / Norwood Financial Corp. | 0,04 | 0,00 | 1,13 | −6,02 | 0,1395 | 0,0177 | |||
| FULT / Fulton Financial Corporation | 0,06 | −64,39 | 0,98 | −70,81 | 0,1213 | −0,2195 | |||
| NEO / NeoGenomics, Inc. | 0,15 | −56,75 | 0,95 | −80,66 | 0,1174 | −0,3806 | |||
| WHD / Cactus, Inc. | 0,02 | −70,61 | 0,91 | −81,33 | 0,1132 | −0,3841 | |||
| WSBC / WesBanco, Inc. | 0,03 | 0,90 | 0,1112 | 0,1112 | |||||
| ZVIA / Zevia PBC | 0,38 | 28,19 | 0,86 | −26,97 | 0,1068 | −0,0133 | |||
| FIVE / Five Below, Inc. | 0,01 | 0,80 | 0,0997 | 0,0997 | |||||
| CBLL / CeriBell, Inc. | 0,05 | 0,00 | 0,80 | −30,10 | 0,0994 | −0,0172 | |||
| ORRF / Orrstown Financial Services, Inc. | 0,03 | −46,12 | 0,78 | −55,56 | 0,0961 | −0,0813 | |||
| CVRX / CVRx, Inc. | 0,06 | −75,55 | 0,42 | −88,80 | 0,0515 | −0,3254 | |||
| BWMN / Bowman Consulting Group Ltd. | 0,02 | 0,00 | 0,35 | −13,07 | 0,0429 | 0,0024 | |||
| TDW / Tidewater Inc. | 0,00 | −100,00 | 0,00 | −100,00 | −0,5942 | ||||
| IBP / Installed Building Products, Inc. | 0,00 | −100,00 | 0,00 | −100,00 | −0,3205 | ||||
| UEC / Uranium Energy Corp. | 0,00 | −100,00 | 0,00 | −100,00 | −0,4613 |