Grundläggande statistik
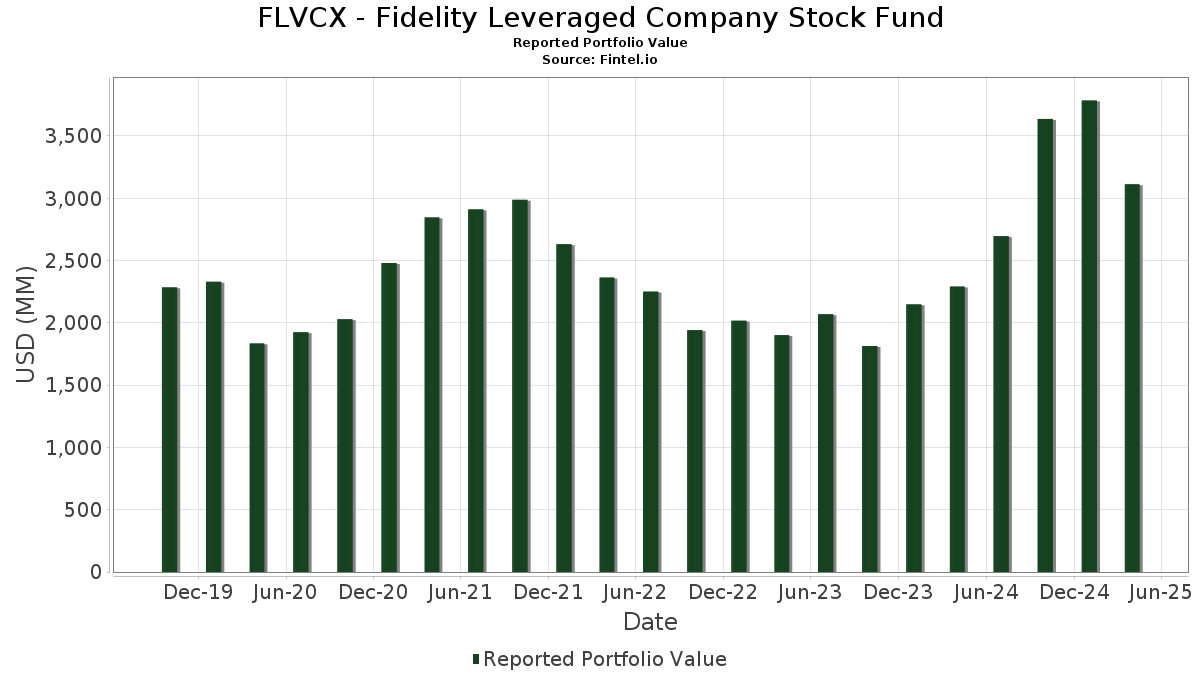
| Portföljvärde | $ 3 112 020 032 |
| Aktuella positioner | 88 |
Senaste innehav, resultat, förvaltat kapital (från 13F, 13D)
FLVCX - Fidelity Leveraged Company Stock Fund har redovisat 88 totala innehav i sina senaste SEC-arkiveringar. Det senaste portföljvärdet beräknas vara $ 3 112 020 032 USD. Faktiskt förvaltade tillgångar (AUM) är detta värde plus likvida medel (som inte redovisas). FLVCX - Fidelity Leveraged Company Stock Funds största innehav är Meta Platforms, Inc. (US:META) , NVIDIA Corporation (US:NVDA) , Vistra Corp. (US:VST) , Arthur J. Gallagher & Co. (US:AJG) , and Apollo Global Management, Inc. (US:APO) . FLVCX - Fidelity Leveraged Company Stock Funds nya positioner inkluderar IES Holdings, Inc. (US:IESC) , AppLovin Corporation (US:APP) , .
Största ökningarna detta kvartal
Vi använder förändringen i portföljallokeringen eftersom det är det mest meningsfulla måttet. Förändringar kan bero på transaktioner eller förändringar i aktiekurser.
| Värdepapper | Aktier (MM) |
Värde (MM$) |
Portfölj % av | ΔPortfölj % av |
|---|---|---|---|---|
| 0,07 | 79,79 | 2,5724 | 0,7406 | |
| 0,23 | 69,30 | 2,2342 | 0,6381 | |
| 0,08 | 16,62 | 0,5358 | 0,5358 | |
| 0,37 | 117,24 | 3,7801 | 0,4683 | |
| 1,40 | 152,13 | 4,9049 | 0,4438 | |
| 0,19 | 52,18 | 1,6824 | 0,4204 | |
| 0,22 | 86,01 | 2,7731 | 0,3705 | |
| 0,62 | 29,31 | 0,9448 | 0,3681 | |
| 0,04 | 11,01 | 0,3551 | 0,3551 | |
| 0,38 | 31,09 | 1,0024 | 0,3199 |
Största minskningarna detta kvartal
Vi använder förändringen i portföljallokeringen eftersom det är det mest meningsfulla måttet. Förändringar kan bero på transaktioner eller förändringar i aktiepriser.
| Värdepapper | Aktier (MM) |
Värde (MM$) |
Portfölj % av | ΔPortfölj % av |
|---|---|---|---|---|
| 2,29 | 2,29 | 0,0737 | −1,0199 | |
| 0,42 | 24,68 | 0,7959 | −0,4738 | |
| 9,05 | 9,05 | 0,2918 | −0,3175 | |
| 1,07 | 139,03 | 4,4825 | −0,3114 | |
| 0,48 | 28,31 | 0,9126 | −0,2569 | |
| 0,32 | 72,31 | 2,3312 | −0,2510 | |
| 0,66 | 56,68 | 1,8273 | −0,2390 | |
| 1,22 | 20,16 | 0,6498 | −0,2370 | |
| 0,64 | 27,43 | 0,8843 | −0,2360 | |
| 0,28 | 19,84 | 0,6398 | −0,2127 |
13F- och fond arkiveringar
Denna blankett lämnades in den 2025-06-26 för rapporteringsperioden 2025-04-30. Klicka på länksymbolen för att se hela transaktionshistoriken.
Uppgradera för att låsa upp premiumdata och exportera till Excel![]() .
.
| Värdepapper | Typ | Genomsnittligt aktiepris | Aktier (MM) |
ΔAktier (%) |
ΔAktier (%) |
Värde ($MM) |
Portfölj (%) |
ΔPortfölj (%) |
|
|---|---|---|---|---|---|---|---|---|---|
| META / Meta Platforms, Inc. | 0,31 | 0,00 | 167,61 | −20,34 | 5,4040 | −0,1931 | |||
| NVDA / NVIDIA Corporation | 1,40 | 0,00 | 152,13 | −9,29 | 4,9049 | 0,4438 | |||
| VST / Vistra Corp. | 1,07 | 0,00 | 139,03 | −22,85 | 4,4825 | −0,3114 | |||
| AJG / Arthur J. Gallagher & Co. | 0,37 | −11,37 | 117,24 | −5,83 | 3,7801 | 0,4683 | |||
| APO / Apollo Global Management, Inc. | 0,85 | 0,00 | 116,13 | −20,18 | 3,7442 | −0,1259 | |||
| MSFT / Microsoft Corporation | 0,22 | 0,00 | 86,01 | −4,77 | 2,7731 | 0,3705 | |||
| NFLX / Netflix, Inc. | 0,07 | 0,00 | 79,79 | 15,87 | 2,5724 | 0,7406 | |||
| FIX / Comfort Systems USA, Inc. | 0,19 | 0,00 | 75,22 | −8,98 | 2,4251 | 0,2269 | |||
| AMZN / Amazon.com, Inc. | 0,39 | 0,00 | 72,42 | −22,41 | 2,3350 | −0,1479 | |||
| CEG / Constellation Energy Corporation | 0,32 | 0,00 | 72,31 | −25,51 | 2,3312 | −0,2510 | |||
| BLD / TopBuild Corp. | 0,23 | 33,81 | 69,30 | 15,49 | 2,2342 | 0,6381 | |||
| GOOGL / Alphabet Inc. | 0,42 | 0,00 | 67,46 | −22,16 | 2,1750 | −0,1305 | |||
| PH / Parker-Hannifin Corporation | 0,11 | 0,00 | 67,34 | −14,42 | 2,1713 | 0,0779 | |||
| VRT / Vertiv Holdings Co | 0,66 | 0,00 | 56,68 | −27,04 | 1,8273 | −0,2390 | |||
| AVGO / Broadcom Inc. | 0,29 | 0,00 | 56,20 | −13,02 | 1,8120 | 0,0933 | |||
| MNDY / monday.com Ltd. | 0,19 | 0,00 | 52,18 | 9,99 | 1,6824 | 0,4204 | |||
| V / Visa Inc. | 0,15 | 0,00 | 51,38 | 1,08 | 1,6564 | 0,3044 | |||
| OMF / OneMain Holdings, Inc. | 1,00 | 0,00 | 47,31 | −15,25 | 1,5252 | 0,0404 | |||
| DKS / DICK'S Sporting Goods, Inc. | 0,25 | 0,00 | 46,60 | −21,79 | 1,5024 | −0,0826 | |||
| BSX / Boston Scientific Corporation | 0,45 | −19,41 | 46,52 | −19,01 | 1,4998 | −0,0280 | |||
| ETN / Eaton Corporation plc | 0,15 | 0,00 | 45,33 | −9,82 | 1,4616 | 0,1243 | |||
| EXP / Eagle Materials Inc. | 0,20 | 0,00 | 44,60 | −11,82 | 1,4379 | 0,0925 | |||
| BYD / Boyd Gaming Corporation | 0,64 | 0,00 | 44,41 | −9,80 | 1,4317 | 0,1222 | |||
| EME / EMCOR Group, Inc. | 0,10 | 0,00 | 41,99 | −10,57 | 1,3539 | 0,1048 | |||
| TT / Trane Technologies plc | 0,11 | 0,00 | 40,78 | 5,67 | 1,3149 | 0,2882 | |||
| FI / Fiserv, Inc. | 0,22 | 0,00 | 40,53 | −14,57 | 1,3068 | 0,0448 | |||
| ORCL / Oracle Corporation | 0,28 | 0,00 | 40,02 | −17,25 | 1,2903 | 0,0038 | |||
| CSL / Carlisle Companies Incorporated | 0,10 | 0,00 | 39,31 | −2,56 | 1,2675 | 0,1942 | |||
| ON / ON Semiconductor Corporation | 0,99 | 0,00 | 39,28 | −24,15 | 1,2665 | −0,1111 | |||
| ANET / Arista Networks Inc | 0,45 | 0,00 | 37,25 | −28,61 | 1,2011 | −0,1869 | |||
| TSM / Taiwan Semiconductor Manufacturing Company Limited - Depositary Receipt (Common Stock) | 0,22 | 0,00 | 36,89 | −20,37 | 1,1893 | −0,0429 | |||
| LRCX / Lam Research Corporation | 0,47 | 0,00 | 33,76 | −11,57 | 1,0884 | 0,0729 | |||
| MCO / Moody's Corporation | 0,07 | 0,00 | 33,17 | −9,28 | 1,0694 | 0,0969 | |||
| TDG / TransDigm Group Incorporated | 0,02 | 0,00 | 31,37 | 4,41 | 1,0114 | 0,2122 | |||
| UBER / Uber Technologies, Inc. | 0,38 | 0,00 | 31,09 | 21,18 | 1,0024 | 0,3199 | |||
| ARES / Ares Management Corporation | 0,20 | 0,00 | 30,00 | −23,05 | 0,9673 | −0,0698 | |||
| WSM / Williams-Sonoma, Inc. | 0,19 | 0,00 | 29,89 | −26,92 | 0,9637 | −0,1243 | |||
| MA / Mastercard Incorporated | 0,05 | 0,00 | 29,65 | −1,32 | 0,9560 | 0,1566 | |||
| BYDDY / BYD Company Limited - Depositary Receipt (Common Stock) | 0,62 | 0,00 | 29,31 | 35,16 | 0,9448 | 0,3681 | |||
| NVT / nVent Electric plc | 0,52 | 0,00 | 28,32 | −15,64 | 0,9130 | 0,0201 | |||
| XYZ / Block, Inc. | 0,48 | 0,00 | 28,31 | −35,62 | 0,9126 | −0,2569 | |||
| ATI / ATI Inc. | 0,51 | 0,00 | 27,65 | −4,75 | 0,8914 | 0,1193 | |||
| RRR / Red Rock Resorts, Inc. | 0,64 | −25,19 | 27,43 | −34,88 | 0,8843 | −0,2360 | |||
| OWL / Blue Owl Capital Inc. | 1,48 | 0,00 | 27,39 | −28,76 | 0,8830 | −0,1396 | |||
| USFD / US Foods Holding Corp. | 0,41 | 0,00 | 26,93 | −7,43 | 0,8682 | 0,0944 | |||
| NXPI / NXP Semiconductors N.V. | 0,14 | 0,00 | 26,65 | −11,62 | 0,8593 | 0,0571 | |||
| WSC / WillScot Holdings Corporation | 1,04 | 0,00 | 26,21 | −32,22 | 0,8449 | −0,1835 | |||
| MRVL / Marvell Technology, Inc. | 0,42 | 0,00 | 24,68 | −48,28 | 0,7959 | −0,4738 | |||
| BKNG / Booking Holdings Inc. | 0,00 | 0,00 | 24,48 | 7,63 | 0,7892 | 0,1842 | |||
| MU / Micron Technology, Inc. | 0,31 | 0,00 | 24,12 | −15,66 | 0,7778 | 0,0169 | |||
| MLM / Martin Marietta Materials, Inc. | 0,05 | 0,00 | 24,05 | −3,70 | 0,7754 | 0,1111 | |||
| DELL / Dell Technologies Inc. | 0,25 | 0,00 | 22,92 | −11,43 | 0,7390 | 0,0506 | |||
| ADBE / Adobe Inc. | 0,06 | 0,00 | 22,05 | −14,28 | 0,7109 | 0,0266 | |||
| PDYPF / Flutter Entertainment plc | 0,09 | 0,00 | 22,02 | −11,49 | 0,7100 | 0,0482 | |||
| PINS / Pinterest, Inc. | 0,85 | 0,00 | 21,65 | −23,18 | 0,6980 | −0,0517 | |||
| THC / Tenet Healthcare Corporation | 0,14 | 0,00 | 20,54 | 1,46 | 0,6623 | 0,1237 | |||
| PCG / PG&E Corporation | 1,22 | −42,73 | 20,16 | −39,55 | 0,6498 | −0,2370 | |||
| BLDR / Builders FirstSource, Inc. | 0,17 | 0,00 | 19,92 | −28,49 | 0,6422 | −0,0987 | |||
| MKSI / MKS Inc. | 0,28 | 0,00 | 19,84 | −38,08 | 0,6398 | −0,2127 | |||
| GPK / Graphic Packaging Holding Company | 0,78 | 0,00 | 19,80 | −7,73 | 0,6385 | 0,0676 | |||
| ASML / ASML Holding N.V. - Depositary Receipt (Common Stock) | 0,03 | 0,00 | 19,78 | −9,63 | 0,6376 | 0,0555 | |||
| COIN / Coinbase Global, Inc. | 0,09 | 0,00 | 18,85 | −30,36 | 0,6077 | −0,1122 | |||
| ET / Energy Transfer LP - Limited Partnership | 1,09 | 0,00 | 18,06 | −19,24 | 0,5823 | −0,0126 | |||
| CNM / Core & Main, Inc. | 0,32 | 0,00 | 16,80 | −6,66 | 0,5416 | 0,0629 | |||
| ABNB / Airbnb, Inc. | 0,14 | 0,00 | 16,75 | −7,05 | 0,5401 | 0,0607 | |||
| IESC / IES Holdings, Inc. | 0,08 | 16,62 | 0,5358 | 0,5358 | |||||
| AR / Antero Resources Corporation | 0,43 | 0,00 | 14,85 | −6,67 | 0,4789 | 0,0555 | |||
| KLAC / KLA Corporation | 0,02 | 0,00 | 14,83 | −4,82 | 0,4780 | 0,0637 | |||
| CRM / Salesforce, Inc. | 0,05 | 0,00 | 13,03 | −21,36 | 0,4202 | −0,0207 | |||
| APP / AppLovin Corporation | 0,04 | 11,01 | 0,3551 | 0,3551 | |||||
| PHM / PulteGroup, Inc. | 0,11 | 0,00 | 10,86 | −9,84 | 0,3502 | 0,0297 | |||
| CC / The Chemours Company | 0,82 | 0,00 | 10,12 | −34,81 | 0,3263 | −0,0867 | |||
| CELH / Celsius Holdings, Inc. | 0,29 | 0,00 | 10,02 | 39,97 | 0,3229 | 0,1326 | |||
| GEN / Gen Digital Inc. | 0,37 | 0,00 | 9,68 | −3,86 | 0,3121 | 0,0442 | |||
| PFGC / Performance Food Group Company | 0,12 | 0,00 | 9,39 | −10,69 | 0,3027 | 0,0231 | |||
| US31635A3032 / Fidelity Securities Lending Cash Central Fund | 9,05 | −60,49 | 9,05 | −60,49 | 0,2918 | −0,3175 | |||
| ELF / e.l.f. Beauty, Inc. | 0,14 | 0,00 | 8,84 | −38,08 | 0,2851 | −0,0947 | |||
| DHI / D.R. Horton, Inc. | 0,06 | 0,00 | 8,11 | −10,96 | 0,2615 | 0,0192 | |||
| MCHP / Microchip Technology Incorporated | 0,17 | 0,00 | 8,06 | −15,14 | 0,2599 | 0,0072 | |||
| SATS / EchoStar Corporation | 0,32 | 7,22 | 0,2326 | 0,2326 | |||||
| NXT / Nextracker Inc. | 0,15 | 0,00 | 6,12 | −19,47 | 0,1974 | −0,0048 | |||
| MSC / Studio City International Holdings Limited - Depositary Receipt (Common Stock) | 1,09 | 0,00 | 3,21 | −39,38 | 0,1034 | −0,0373 | |||
| STUDIO CITY INTERNATIONAL HOLDINGS LTD ADR 144A / EC (N/A) | 0,99 | 2,92 | 0,0941 | 0,0941 | |||||
| ALSN / Allison Transmission Holdings, Inc. | 0,03 | 0,00 | 2,32 | −21,54 | 0,0749 | −0,0038 | |||
| US31635A1051 / Fidelity Cash Central Fund | 2,29 | −94,44 | 2,29 | −94,44 | 0,0737 | −1,0199 | |||
| NEW COTAI LLC PIK CONV 5% 02/24/2027 / DBT (N/A) | 0,55 | 0,0176 | 0,0176 | ||||||
| NEW COTAI LLC/NEW COTAI CAPITAL CORP P/P / EC (N/A) | 0,41 | 0,09 | 0,0028 | 0,0028 | |||||
| GNK / Genco Shipping & Trading Limited | 0,00 | 0,00 | 0,02 | −9,52 | 0,0006 | 0,0000 |