Grundläggande statistik
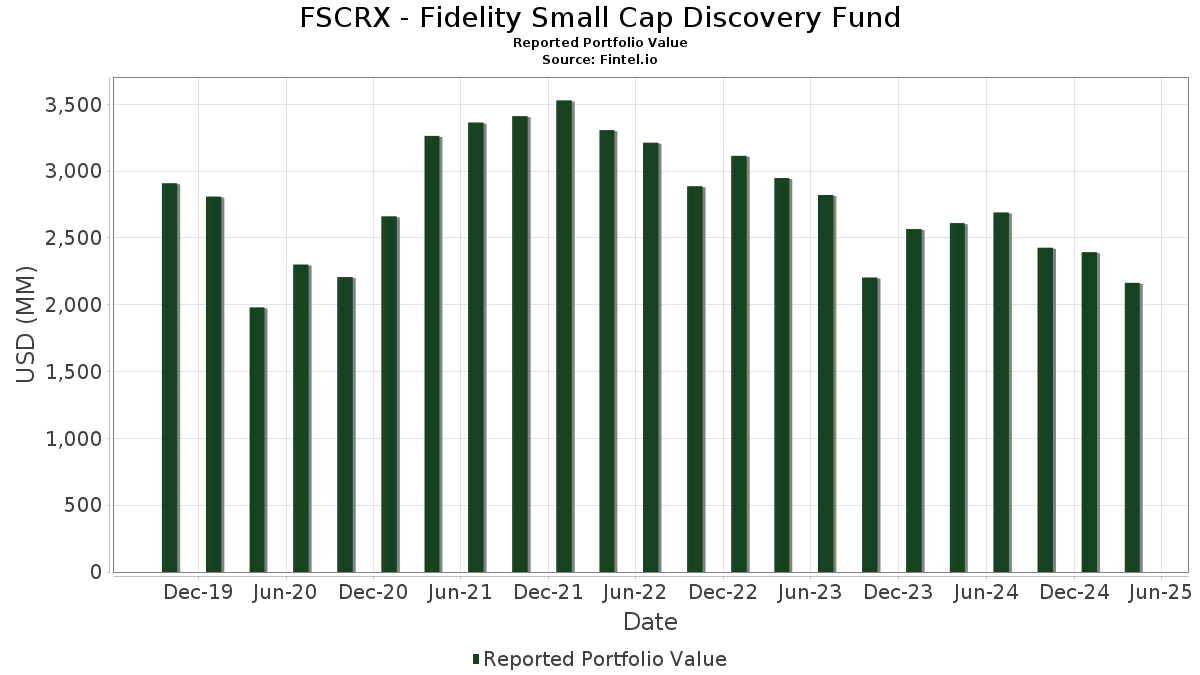
| Portföljvärde | $ 2 163 309 297 |
| Aktuella positioner | 140 |
Senaste innehav, resultat, förvaltat kapital (från 13F, 13D)
FSCRX - Fidelity Small Cap Discovery Fund har redovisat 140 totala innehav i sina senaste SEC-arkiveringar. Det senaste portföljvärdet beräknas vara $ 2 163 309 297 USD. Faktiskt förvaltade tillgångar (AUM) är detta värde plus likvida medel (som inte redovisas). FSCRX - Fidelity Small Cap Discovery Funds största innehav är Genpact Limited (US:G) , Fidelity Cash Central Fund (US:US31635A1051) , Performance Food Group Company (US:PFGC) , Laureate Education, Inc. (US:LAUR) , and Fidelity Securities Lending Cash Central Fund (US:US31635A3032) . FSCRX - Fidelity Small Cap Discovery Funds nya positioner inkluderar F.N.B. Corporation (US:FNB) , KBR, Inc. (US:KBR) , SLM Corporation (US:SLM) , AXIS Capital Holdings Limited (US:AXS) , and BankUnited, Inc. (DE:BNU) .
Största ökningarna detta kvartal
Vi använder förändringen i portföljallokeringen eftersom det är det mest meningsfulla måttet. Förändringar kan bero på transaktioner eller förändringar i aktiekurser.
| Värdepapper | Aktier (MM) |
Värde (MM$) |
Portfölj % av | ΔPortfölj % av |
|---|---|---|---|---|
| 2,05 | 42,14 | 2,0041 | 1,3988 | |
| 2,14 | 27,99 | 1,3313 | 1,3313 | |
| 0,49 | 26,03 | 1,2382 | 1,2382 | |
| 0,90 | 25,89 | 1,2314 | 1,2314 | |
| 0,24 | 23,13 | 1,1000 | 1,1000 | |
| 93,25 | 93,27 | 4,4364 | 1,0051 | |
| 0,77 | 45,73 | 2,1752 | 0,9080 | |
| 0,52 | 16,94 | 0,8060 | 0,8060 | |
| 0,71 | 16,25 | 0,7728 | 0,7728 | |
| 0,34 | 26,47 | 1,2590 | 0,5712 |
Största minskningarna detta kvartal
Vi använder förändringen i portföljallokeringen eftersom det är det mest meningsfulla måttet. Förändringar kan bero på transaktioner eller förändringar i aktiepriser.
| Värdepapper | Aktier (MM) |
Värde (MM$) |
Portfölj % av | ΔPortfölj % av |
|---|---|---|---|---|
| 0,00 | 0,00 | −1,5224 | ||
| 60,84 | 60,84 | 2,8938 | −1,2493 | |
| 0,43 | 13,12 | 0,6241 | −0,9734 | |
| 0,72 | 36,30 | 1,7264 | −0,8041 | |
| 0,36 | 48,22 | 2,2934 | −0,6623 | |
| 0,06 | 6,27 | 0,2984 | −0,6222 | |
| 0,00 | 0,00 | −0,4995 | ||
| 0,08 | 2,50 | 0,1189 | −0,4918 | |
| 0,07 | 4,97 | 0,2363 | −0,4757 | |
| 0,00 | 0,00 | −0,4328 |
13F- och fond arkiveringar
Denna blankett lämnades in den 2025-06-26 för rapporteringsperioden 2025-04-30. Klicka på länksymbolen för att se hela transaktionshistoriken.
Uppgradera för att låsa upp premiumdata och exportera till Excel![]() .
.
| Värdepapper | Typ | Genomsnittligt aktiepris | Aktier (MM) |
ΔAktier (%) |
ΔAktier (%) |
Värde ($MM) |
Portfölj (%) |
ΔPortfölj (%) |
|
|---|---|---|---|---|---|---|---|---|---|
| G / Genpact Limited | 2,16 | −7,90 | 108,63 | −4,93 | 5,1667 | 0,1924 | |||
| US31635A1051 / Fidelity Cash Central Fund | 93,25 | 18,34 | 93,27 | 18,34 | 4,4364 | 1,0051 | |||
| PFGC / Performance Food Group Company | 1,05 | 0,78 | 85,04 | −9,98 | 4,0448 | −0,0681 | |||
| LAUR / Laureate Education, Inc. | 3,12 | 0,00 | 62,59 | 7,21 | 2,9768 | 0,4354 | |||
| US31635A3032 / Fidelity Securities Lending Cash Central Fund | 60,84 | −36,07 | 60,84 | −36,07 | 2,8938 | −1,2493 | |||
| NSIT / Insight Enterprises, Inc. | 0,42 | 3,31 | 57,45 | −17,31 | 2,7328 | −0,2920 | |||
| FCFS / FirstCash Holdings, Inc. | 0,36 | −42,13 | 48,22 | −28,98 | 2,2934 | −0,6623 | |||
| LITE / Lumentum Holdings Inc. | 0,77 | 126,36 | 45,73 | 57,12 | 2,1752 | 0,9080 | |||
| WBS / Webster Financial Corporation | 0,91 | 17,74 | 43,14 | −7,55 | 2,0518 | 0,0204 | |||
| PRI / Primerica, Inc. | 0,16 | 0,00 | 43,06 | −9,68 | 2,0481 | −0,0275 | |||
| ONB / Old National Bancorp | 2,05 | 251,01 | 42,14 | 203,04 | 2,0041 | 1,3988 | |||
| CROX / Crocs, Inc. | 0,42 | 9,58 | 40,71 | 3,51 | 1,9364 | 0,2241 | |||
| IESC / IES Holdings, Inc. | 0,19 | 10,98 | 37,98 | −1,36 | 1,8063 | 0,1302 | |||
| MMS / Maximus, Inc. | 0,56 | −1,18 | 37,67 | −12,11 | 1,7918 | −0,0742 | |||
| SF / Stifel Financial Corp. | 0,44 | 14,79 | 37,51 | −15,09 | 1,7840 | −0,1391 | |||
| ASGN / ASGN Incorporated | 0,72 | 9,33 | 36,30 | −37,56 | 1,7264 | −0,8041 | |||
| BCO / The Brink's Company | 0,38 | 14,50 | 34,32 | 9,49 | 1,6323 | 0,2677 | |||
| WNS / WNS (Holdings) Limited | 0,56 | 28,15 | 33,92 | 26,62 | 1,6133 | 0,4471 | |||
| EVTC / EVERTEC, Inc. | 0,94 | 0,00 | 31,77 | 4,53 | 1,5112 | 0,1879 | |||
| BIPC / Brookfield Infrastructure Corporation | 0,84 | −19,50 | 31,40 | −27,76 | 1,4933 | −0,3987 | |||
| PKIUF / Parkland Corporation | 1,23 | 0,00 | 31,11 | 13,18 | 1,4796 | 0,2830 | |||
| FNB / F.N.B. Corporation | 2,14 | 27,99 | 1,3313 | 1,3313 | |||||
| BRC / Brady Corporation | 0,39 | 15,25 | 27,73 | 8,75 | 1,3190 | 0,2089 | |||
| SANM / Sanmina Corporation | 0,34 | 82,68 | 26,47 | 67,54 | 1,2590 | 0,5712 | |||
| ASO / Academy Sports and Outdoors, Inc. | 0,69 | 2,89 | 26,13 | −25,88 | 1,2431 | −0,2921 | |||
| KBR / KBR, Inc. | 0,49 | 26,03 | 1,2382 | 1,2382 | |||||
| SLM / SLM Corporation | 0,90 | 25,89 | 1,2314 | 1,2314 | |||||
| FN / Fabrinet | 0,12 | 24,52 | 24,16 | 18,10 | 1,1490 | 0,2585 | |||
| LNTH / Lantheus Holdings, Inc. | 0,23 | 14,62 | 24,13 | 29,27 | 1,1479 | 0,3352 | |||
| VEC / V2X Inc | 0,47 | 3,31 | 23,60 | −1,39 | 1,1224 | 0,0806 | |||
| CADE / Cadence Bank | 0,79 | 0,00 | 23,15 | −16,88 | 1,1011 | −0,1113 | |||
| AXS / AXIS Capital Holdings Limited | 0,24 | 23,13 | 1,1000 | 1,1000 | |||||
| SNX / TD SYNNEX Corporation | 0,21 | 23,84 | 22,74 | −3,71 | 1,0814 | 0,0534 | |||
| TGLS / Tecnoglass Inc. | 0,31 | 3,32 | 22,38 | −3,11 | 1,0647 | 0,0589 | |||
| EXLS / ExlService Holdings, Inc. | 0,46 | 3,31 | 22,38 | −0,35 | 1,0646 | 0,0868 | |||
| GMS / GMS Inc. | 0,30 | 3,33 | 21,85 | −10,25 | 1,0394 | −0,0206 | |||
| BWIN / The Baldwin Insurance Group, Inc. | 0,52 | 3,32 | 21,51 | 5,01 | 1,0233 | 0,1313 | |||
| AIZ / Assurant, Inc. | 0,11 | 3,34 | 21,46 | −7,44 | 1,0207 | 0,0114 | |||
| EXP / Eagle Materials Inc. | 0,08 | 3,30 | 18,43 | −8,91 | 0,8765 | −0,0043 | |||
| UFPI / UFP Industries, Inc. | 0,18 | 3,32 | 18,17 | −11,69 | 0,8642 | −0,0315 | |||
| SIGI / Selective Insurance Group, Inc. | 0,20 | 3,33 | 17,86 | 7,14 | 0,8496 | 0,1238 | |||
| THC / Tenet Healthcare Corporation | 0,12 | 40,16 | 17,81 | 42,20 | 0,8472 | 0,3019 | |||
| BNU / BankUnited, Inc. | 0,52 | 16,94 | 0,8060 | 0,8060 | |||||
| RGA / Reinsurance Group of America, Incorporated | 0,09 | 46,13 | 16,61 | 20,12 | 0,7902 | 0,1881 | |||
| KFRC / Kforce Inc. | 0,43 | 0,00 | 16,60 | −31,46 | 0,7897 | −0,2648 | |||
| HAFC / Hanmi Financial Corporation | 0,71 | 16,25 | 0,7728 | 0,7728 | |||||
| BDC / Belden Inc. | 0,15 | 3,34 | 15,96 | −8,52 | 0,7592 | −0,0004 | |||
| KD / Kyndryl Holdings, Inc. | 0,49 | 21,99 | 15,81 | 4,18 | 0,7520 | 0,0913 | |||
| CSV / Carriage Services, Inc. | 0,38 | 28,90 | 15,14 | 25,78 | 0,7203 | 0,1962 | |||
| CYTK / Cytokinetics, Incorporated | 0,34 | 3,32 | 14,55 | −10,52 | 0,6922 | −0,0158 | |||
| ROCK / Gibraltar Industries, Inc. | 0,27 | 17,83 | 14,32 | 1,66 | 0,6811 | 0,0679 | |||
| MLI / Mueller Industries, Inc. | 0,18 | 7,09 | 13,56 | 0,04 | 0,6448 | 0,0548 | |||
| HAE / Haemonetics Corporation | 0,21 | 3,33 | 13,47 | −5,69 | 0,6409 | 0,0189 | |||
| TENB / Tenable Holdings, Inc. | 0,43 | −49,60 | 13,12 | −64,24 | 0,6241 | −0,9734 | |||
| PLUS / ePlus inc. | 0,20 | 3,30 | 12,50 | −19,38 | 0,5945 | −0,0804 | |||
| WEX / WEX Inc. | 0,10 | 3,35 | 12,48 | −26,73 | 0,5934 | −0,1479 | |||
| MTX / Minerals Technologies Inc. | 0,23 | 17,78 | 12,03 | −20,77 | 0,5722 | −0,0888 | |||
| ENSG / The Ensign Group, Inc. | 0,09 | 31,75 | 11,72 | 21,69 | 0,5575 | 0,1382 | |||
| LPX / Louisiana-Pacific Corporation | 0,13 | 3,32 | 11,28 | −23,76 | 0,5366 | −0,1076 | |||
| PENG / Penguin Solutions, Inc. | 0,65 | 3,31 | 11,14 | −13,04 | 0,5299 | −0,0279 | |||
| BLD / TopBuild Corp. | 0,04 | 3,40 | 10,80 | −10,76 | 0,5135 | −0,0132 | |||
| ATI / ATI Inc. | 0,20 | 47,40 | 10,79 | 40,40 | 0,5132 | 0,1786 | |||
| ELAN / Elanco Animal Health Incorporated | 1,14 | 17,36 | 10,79 | −7,52 | 0,5131 | 0,0053 | |||
| VOYA / Voya Financial, Inc. | 0,18 | 65,60 | 10,46 | 38,10 | 0,4975 | 0,1678 | |||
| NOG / Northern Oil and Gas, Inc. | 0,42 | 3,30 | 10,19 | −30,18 | 0,4846 | −0,1506 | |||
| OUT / OUTFRONT Media Inc. | 0,66 | 18,49 | 10,00 | −2,57 | 0,4757 | 0,0288 | |||
| DIOD / Diodes Incorporated | 0,26 | 3,31 | 9,93 | −32,74 | 0,4725 | −0,1704 | |||
| CBZ / CBIZ, Inc. | 0,14 | 22,44 | 9,84 | −2,82 | 0,4680 | 0,0272 | |||
| CHRD / Chord Energy Corporation | 0,11 | 3,32 | 9,56 | −17,10 | 0,4545 | −0,0473 | |||
| SPSC / SPS Commerce, Inc. | 0,07 | 3,27 | 9,51 | −19,75 | 0,4526 | −0,0636 | |||
| WEAV / Weave Communications, Inc. | 0,90 | 1 173,47 | 9,50 | 727,70 | 0,4520 | 0,4020 | |||
| REVG / REV Group, Inc. | 0,29 | −0,72 | 9,44 | −6,45 | 0,4489 | 0,0097 | |||
| CVCO / Cavco Industries, Inc. | 0,02 | 32,03 | 9,36 | 28,19 | 0,4454 | 0,1274 | |||
| OVV / Ovintiv Inc. | 0,27 | 3,32 | 9,19 | −17,82 | 0,4373 | −0,0498 | |||
| GPOR / Gulfport Energy Corporation | 0,05 | 3,29 | 8,68 | −0,20 | 0,4127 | 0,0342 | |||
| HASI / HA Sustainable Infrastructure Capital, Inc. | 0,35 | 3,31 | 8,65 | −7,87 | 0,4112 | 0,0027 | |||
| IBP / Installed Building Products, Inc. | 0,05 | 3,38 | 8,63 | −13,78 | 0,4103 | −0,0253 | |||
| UGI / UGI Corporation | 0,25 | 14,24 | 8,30 | 21,91 | 0,3947 | 0,0983 | |||
| DXPE / DXP Enterprises, Inc. | 0,09 | 3,29 | 8,05 | −9,80 | 0,3828 | −0,0056 | |||
| ANF / Abercrombie & Fitch Co. | 0,12 | 8,00 | 0,3807 | 0,3807 | |||||
| GTES / Gates Industrial Corporation plc | 0,42 | −13,30 | 7,88 | −20,72 | 0,3747 | −0,0579 | |||
| CRS / Carpenter Technology Corporation | 0,04 | 3,34 | 7,26 | 4,72 | 0,3452 | 0,0434 | |||
| ATGE / Adtalem Global Education Inc. | 0,07 | 71,88 | 6,93 | 70,36 | 0,3298 | 0,1526 | |||
| CLDX / Celldex Therapeutics, Inc. | 0,33 | 3,32 | 6,93 | −12,12 | 0,3296 | −0,0137 | |||
| WHD / Cactus, Inc. | 0,17 | 4,87 | 6,64 | −33,37 | 0,3157 | −0,1179 | |||
| AZZ / AZZ Inc. | 0,07 | −58,09 | 6,31 | −57,61 | 0,3001 | −0,3480 | |||
| WTFC / Wintrust Financial Corporation | 0,06 | −83,87 | 6,27 | −79,74 | 0,2984 | −0,6222 | |||
| US82983N1081 / Sitio Royalties Corp | 0,37 | 0,00 | 6,20 | −15,79 | 0,2947 | −0,0256 | |||
| PNTG / The Pennant Group, Inc. | 0,23 | 3,80 | 6,02 | 0,47 | 0,2863 | 0,0255 | |||
| PCVX / Vaxcyte, Inc. | 0,15 | 3,34 | 5,55 | −58,07 | 0,2639 | −0,3121 | |||
| RUSHA / Rush Enterprises, Inc. | 0,10 | −7,34 | 5,35 | −22,22 | 0,2544 | −0,0450 | |||
| CAL / Caleres, Inc. | 0,35 | 8,14 | 5,28 | −10,08 | 0,2512 | −0,0045 | |||
| JBTM / JBT Marel Corporation | 0,05 | 3,97 | 5,23 | −17,71 | 0,2488 | −0,0279 | |||
| CEU / CES Energy Solutions Corp. | 1,18 | 3,31 | 5,19 | −23,09 | 0,2469 | −0,0469 | |||
| CIEN / Ciena Corporation | 0,07 | −60,58 | 4,97 | −69,62 | 0,2363 | −0,4757 | |||
| KNF / Knife River Corporation | 0,05 | 4,93 | 4,77 | −5,41 | 0,2270 | 0,0074 | |||
| VRNS / Varonis Systems, Inc. | 0,11 | 4,96 | 4,53 | −0,87 | 0,2156 | 0,0165 | |||
| VMI / Valmont Industries, Inc. | 0,02 | 4,79 | 4,49 | −7,37 | 0,2134 | 0,0025 | |||
| CNR / Core Natural Resources, Inc. | 0,06 | 5,03 | 4,38 | −16,06 | 0,2081 | −0,0188 | |||
| ARCB / ArcBest Corporation | 0,07 | −38,90 | 4,14 | −62,61 | 0,1967 | −0,2848 | |||
| BOOT / Boot Barn Holdings, Inc. | 0,04 | 4,56 | 4,07 | −32,17 | 0,1936 | −0,0677 | |||
| SLNO / Soleno Therapeutics, Inc. | 0,05 | 31,06 | 3,89 | 95,32 | 0,1848 | 0,0982 | |||
| MWA / Mueller Water Products, Inc. | 0,14 | 3,69 | 0,1757 | 0,1757 | |||||
| PRMB / Primo Brands Corporation | 0,11 | 6,01 | 3,57 | 7,01 | 0,1700 | 0,0246 | |||
| GG00BMG42V42 / Super Group SGHC Ltd. | 0,43 | 200,11 | 3,53 | 201,28 | 0,1680 | 0,1169 | |||
| AEO / American Eagle Outfitters, Inc. | 0,31 | 5,17 | 3,30 | −31,38 | 0,1570 | −0,0524 | |||
| WK / Workiva Inc. | 0,04 | 3,19 | 0,1518 | 0,1518 | |||||
| KBH / KB Home | 0,06 | 3,09 | 0,1470 | 0,1470 | |||||
| EBC / Eastern Bankshares, Inc. | 0,20 | 3,05 | 0,1451 | 0,1451 | |||||
| SHOO / Steven Madden, Ltd. | 0,14 | 2,98 | 0,1418 | 0,1418 | |||||
| TVTX / Travere Therapeutics, Inc. | 0,14 | 7,89 | 2,85 | 9,71 | 0,1354 | 0,0225 | |||
| SMPL / The Simply Good Foods Company | 0,07 | −49,42 | 2,69 | −51,94 | 0,1280 | −0,1157 | |||
| NSSC / Napco Security Technologies, Inc. | 0,12 | 0,00 | 2,68 | −37,73 | 0,1275 | −0,0599 | |||
| ADUS / Addus HomeCare Corporation | 0,03 | 71,86 | 2,66 | 43,57 | 0,1265 | 0,0458 | |||
| TPH / Tri Pointe Homes, Inc. | 0,08 | −91,87 | 2,50 | −78,23 | 0,1189 | −0,4918 | |||
| HWKN / Hawkins, Inc. | 0,02 | 0,00 | 2,41 | 13,93 | 0,1148 | 0,0226 | |||
| OLO / Olo Inc. | 0,37 | 9,47 | 2,28 | −8,03 | 0,1084 | 0,0005 | |||
| INTA / Intapp, Inc. | 0,04 | 9,03 | 2,23 | −17,02 | 0,1060 | −0,0109 | |||
| CGON / CG Oncology, Inc. | 0,08 | 0,00 | 2,15 | −10,39 | 0,1021 | −0,0022 | |||
| CORZ / Core Scientific, Inc. | 0,26 | 9,01 | 2,08 | −28,05 | 0,0989 | −0,0269 | |||
| BLBD / Blue Bird Corporation | 0,06 | 0,00 | 1,93 | −2,13 | 0,0916 | 0,0060 | |||
| PAR / PAR Technology Corporation | 0,03 | 0,00 | 1,91 | −19,55 | 0,0908 | −0,0125 | |||
| CSTM / Constellium SE | 0,18 | −0,54 | 1,85 | 1,26 | 0,0881 | 0,0085 | |||
| IRON / Disc Medicine, Inc. | 0,04 | 0,00 | 1,73 | −11,44 | 0,0825 | −0,0028 | |||
| TKR / The Timken Company | 0,03 | 0,00 | 1,63 | −19,97 | 0,0776 | −0,0111 | |||
| NRIX / Nurix Therapeutics, Inc. | 0,11 | 0,00 | 1,27 | −41,52 | 0,0604 | −0,0341 | |||
| DAWN / Day One Biopharmaceuticals, Inc. | 0,16 | 0,00 | 1,25 | −37,09 | 0,0595 | −0,0271 | |||
| AEHR / Aehr Test Systems, Inc. | 0,14 | 0,00 | 1,17 | −24,68 | 0,0557 | −0,0120 | |||
| VRDN / Viridian Therapeutics, Inc. | 0,08 | 0,00 | 1,04 | −30,09 | 0,0496 | −0,0153 | |||
| LILAB / Liberty Latin America Ltd. | 0,19 | 0,00 | 1,02 | −10,27 | 0,0486 | −0,0010 | |||
| ATXS / Astria Therapeutics, Inc. | 0,19 | 0,00 | 0,98 | −34,31 | 0,0467 | −0,0184 | |||
| ULH / Universal Logistics Holdings, Inc. | 0,04 | 0,00 | 0,95 | −50,83 | 0,0452 | −0,0389 | |||
| BTSG / BrightSpring Health Services, Inc. | 0,05 | 0,00 | 0,90 | −25,70 | 0,0426 | −0,0099 | |||
| SZ2 / Signet Jewelers Limited | 0,01 | 0,84 | 0,0401 | 0,0401 | |||||
| PAL / Proficient Auto Logistics, Inc. | 0,10 | 0,00 | 0,81 | −15,50 | 0,0386 | −0,0032 | |||
| UPB / Upstream Bio, Inc. | 0,07 | 0,00 | 0,61 | −14,13 | 0,0292 | −0,0019 | |||
| FLOC / Flowco Holdings Inc. | 0,03 | 0,00 | 0,58 | −31,01 | 0,0278 | −0,0091 | |||
| CATX / Perspective Therapeutics, Inc. | 0,21 | 0,00 | 0,50 | −31,04 | 0,0239 | −0,0078 | |||
| JANX / Janux Therapeutics, Inc. | 0,00 | 0,00 | 0,08 | −24,04 | 0,0038 | −0,0008 | |||
| ELVN / Enliven Therapeutics, Inc. | 0,00 | 0,00 | 0,08 | −13,19 | 0,0038 | −0,0002 | |||
| OMI / Owens & Minor, Inc. | 0,00 | −100,00 | 0,00 | −100,00 | −1,5224 | ||||
| FTRE / Fortrea Holdings Inc. | 0,00 | −100,00 | 0,00 | −100,00 | −0,2958 | ||||
| ACHC / Acadia Healthcare Company, Inc. | 0,00 | −100,00 | 0,00 | −100,00 | −0,4328 | ||||
| INFA / Informatica Inc. | 0,00 | −100,00 | 0,00 | −100,00 | −0,4995 |