Grundläggande statistik
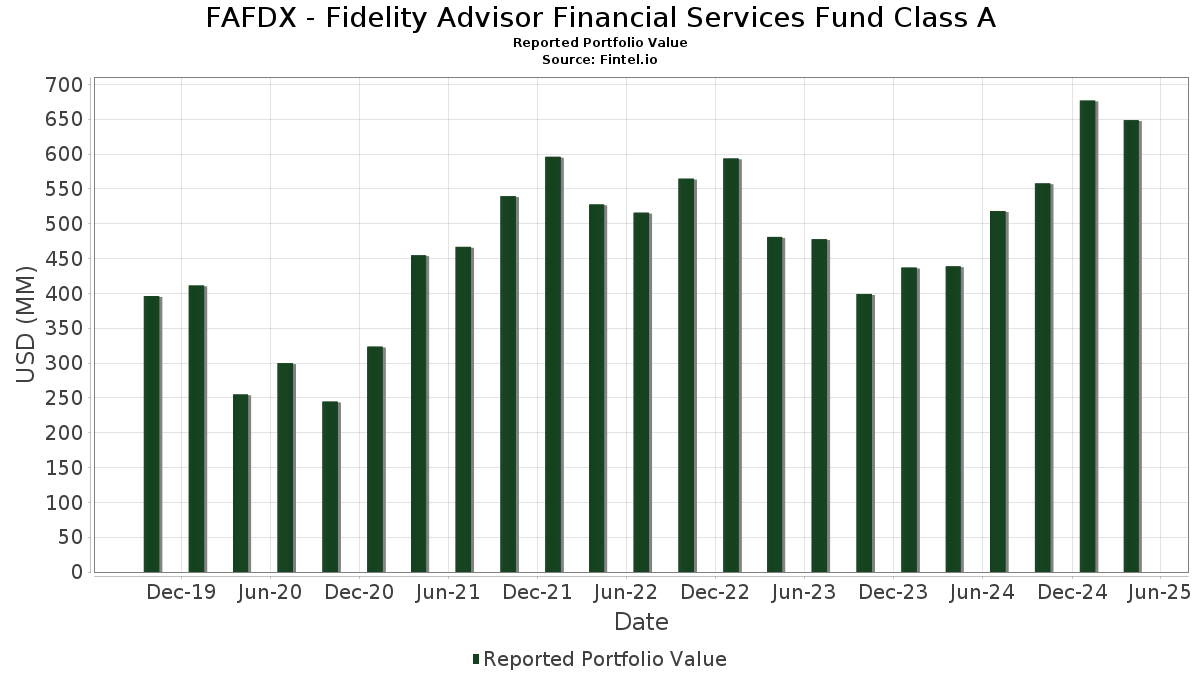
| Portföljvärde | $ 648 630 265 |
| Aktuella positioner | 65 |
Senaste innehav, resultat, förvaltat kapital (från 13F, 13D)
FAFDX - Fidelity Advisor Financial Services Fund Class A har redovisat 65 totala innehav i sina senaste SEC-arkiveringar. Det senaste portföljvärdet beräknas vara $ 648 630 265 USD. Faktiskt förvaltade tillgångar (AUM) är detta värde plus likvida medel (som inte redovisas). FAFDX - Fidelity Advisor Financial Services Fund Class As största innehav är Mastercard Incorporated (US:MA) , Wells Fargo & Company (US:WFC) , Bank of America Corporation (US:BAC) , Reinsurance Group of America, Incorporated (US:RGA) , and The Charles Schwab Corporation (US:SCHW) . FAFDX - Fidelity Advisor Financial Services Fund Class As nya positioner inkluderar The Charles Schwab Corporation (US:SCHW) , TransUnion (DE:1TU) , AUB Group Limited (US:AUBBF) , United Community Banks, Inc. (US:UCBI) , and .
Största ökningarna detta kvartal
Vi använder förändringen i portföljallokeringen eftersom det är det mest meningsfulla måttet. Förändringar kan bero på transaktioner eller förändringar i aktiekurser.
| Värdepapper | Aktier (MM) |
Värde (MM$) |
Portfölj % av | ΔPortfölj % av |
|---|---|---|---|---|
| 0,28 | 22,47 | 3,5765 | 3,5765 | |
| 20,49 | 20,49 | 3,2624 | 2,3939 | |
| 0,12 | 65,71 | 10,4609 | 2,0210 | |
| 0,24 | 9,38 | 1,4929 | 1,2822 | |
| 0,10 | 7,89 | 1,2559 | 1,2559 | |
| 0,34 | 6,86 | 1,0928 | 1,0928 | |
| 0,07 | 21,06 | 3,3519 | 0,8788 | |
| 0,10 | 13,16 | 2,0957 | 0,5336 | |
| 0,12 | 3,24 | 0,5164 | 0,5164 | |
| 0,07 | 12,66 | 2,0156 | 0,5047 |
Största minskningarna detta kvartal
Vi använder förändringen i portföljallokeringen eftersom det är det mest meningsfulla måttet. Förändringar kan bero på transaktioner eller förändringar i aktiepriser.
| Värdepapper | Aktier (MM) |
Värde (MM$) |
Portfölj % av | ΔPortfölj % av |
|---|---|---|---|---|
| 0,01 | 2,59 | 0,4125 | −1,8097 | |
| 0,00 | 0,00 | −1,4454 | ||
| 0,31 | 21,12 | 3,3626 | −1,0064 | |
| 0,14 | 5,46 | 0,8699 | −0,5745 | |
| 0,02 | 3,21 | 0,5116 | −0,5675 | |
| 0,14 | 4,14 | 0,6594 | −0,5287 | |
| 0,03 | 2,68 | 0,4270 | −0,4299 | |
| 0,09 | 12,11 | 1,9271 | −0,2885 | |
| 0,55 | 39,01 | 6,2109 | −0,2453 | |
| 0,18 | 7,37 | 1,1734 | −0,2439 |
13F- och fond arkiveringar
Denna blankett lämnades in den 2025-06-26 för rapporteringsperioden 2025-04-30. Klicka på länksymbolen för att se hela transaktionshistoriken.
Uppgradera för att låsa upp premiumdata och exportera till Excel![]() .
.
| Värdepapper | Typ | Genomsnittligt aktiepris | Aktier (MM) |
ΔAktier (%) |
ΔAktier (%) |
Värde ($MM) |
Portfölj (%) |
ΔPortfölj (%) |
|
|---|---|---|---|---|---|---|---|---|---|
| MA / Mastercard Incorporated | 0,12 | 17,66 | 65,71 | 16,10 | 10,4609 | 2,0210 | |||
| WFC / Wells Fargo & Company | 0,55 | 0,00 | 39,01 | −9,89 | 6,2109 | −0,2453 | |||
| BAC / Bank of America Corporation | 0,80 | 11,49 | 31,85 | −3,97 | 5,0710 | 0,1244 | |||
| RGA / Reinsurance Group of America, Incorporated | 0,12 | 12,22 | 22,53 | −7,75 | 3,5871 | −0,0553 | |||
| SCHW / The Charles Schwab Corporation | 0,28 | 22,47 | 3,5765 | 3,5765 | |||||
| C / Citigroup Inc. | 0,31 | −14,15 | 21,12 | −27,91 | 3,3626 | −1,0064 | |||
| CB / Chubb Limited | 0,07 | 20,66 | 21,06 | 26,96 | 3,3519 | 0,8788 | |||
| US31635A3032 / Fidelity Securities Lending Cash Central Fund | 20,49 | 251,87 | 20,49 | 251,87 | 3,2624 | 2,3939 | |||
| MMC / Marsh & McLennan Companies, Inc. | 0,06 | −1,24 | 14,36 | 2,67 | 2,2864 | 0,2004 | |||
| STT / State Street Corporation | 0,16 | 14,87 | 14,09 | −0,41 | 2,2426 | 0,1332 | |||
| MS / Morgan Stanley | 0,12 | 2,02 | 13,97 | −14,94 | 2,2232 | −0,2250 | |||
| FCFS / FirstCash Holdings, Inc. | 0,10 | 2,40 | 13,16 | 25,67 | 2,0957 | 0,5336 | |||
| DFS / Discover Financial Services | 0,07 | 1,99 | 13,13 | −7,36 | 2,0908 | −0,0232 | |||
| FI / Fiserv, Inc. | 0,07 | 46,27 | 12,66 | 24,96 | 2,0156 | 0,5047 | |||
| NDAQ / Nasdaq, Inc. | 0,16 | 36,54 | 12,22 | 26,38 | 1,9448 | 0,5033 | |||
| APO / Apollo Global Management, Inc. | 0,09 | 2,07 | 12,11 | −18,53 | 1,9271 | −0,2885 | |||
| LPLA / LPL Financial Holdings Inc. | 0,04 | −4,75 | 11,54 | −16,98 | 1,8378 | −0,2357 | |||
| AJG / Arthur J. Gallagher & Co. | 0,03 | −5,48 | 11,06 | 0,43 | 1,7613 | 0,1185 | |||
| USB / U.S. Bancorp | 0,27 | 2,04 | 10,91 | −13,85 | 1,7365 | −0,1517 | |||
| SLM / SLM Corporation | 0,37 | −8,83 | 10,80 | −5,57 | 1,7199 | 0,0139 | |||
| MTB / M&T Bank Corporation | 0,06 | 2,75 | 10,13 | −13,32 | 1,6130 | −0,1301 | |||
| MKTX / MarketAxess Holdings Inc. | 0,04 | 9,85 | 9,64 | 10,34 | 1,5345 | 0,2316 | |||
| AFG / American Financial Group, Inc. | 0,07 | 12,75 | 9,41 | 4,57 | 1,4981 | 0,1562 | |||
| BPOP / Popular, Inc. | 0,10 | −2,77 | 9,39 | −9,87 | 1,4943 | −0,0587 | |||
| TFC / Truist Financial Corporation | 0,24 | 906,58 | 9,38 | 928,18 | 1,4929 | 1,2822 | |||
| MCO / Moody's Corporation | 0,02 | 3,03 | 9,24 | −6,52 | 1,4715 | −0,0031 | |||
| NTRS / Northern Trust Corporation | 0,10 | −0,52 | 9,07 | −16,74 | 1,4437 | −0,1805 | |||
| VIRT / Virtu Financial, Inc. | 0,23 | −14,31 | 9,05 | −16,27 | 1,4400 | −0,1708 | |||
| VOYA / Voya Financial, Inc. | 0,15 | 13,33 | 8,91 | −5,49 | 1,4183 | 0,0125 | |||
| H2X3 / Hiscox Ltd | 0,60 | 1,93 | 8,72 | 10,17 | 1,3882 | 0,2078 | |||
| OMF / OneMain Holdings, Inc. | 0,18 | −5,38 | 8,53 | −19,81 | 1,3585 | −0,2283 | |||
| 1TU / TransUnion | 0,10 | 7,89 | 1,2559 | 1,2559 | |||||
| BWIN / The Baldwin Insurance Group, Inc. | 0,18 | −23,70 | 7,37 | −22,44 | 1,1734 | −0,2439 | |||
| UMBF / UMB Financial Corporation | 0,07 | 33,35 | 7,01 | 6,96 | 1,1162 | 0,1387 | |||
| AUBBF / AUB Group Limited | 0,34 | 6,86 | 1,0928 | 1,0928 | |||||
| ONB / Old National Bancorp | 0,33 | 2,58 | 6,79 | −11,44 | 1,0808 | −0,0624 | |||
| LNH / Lancashire Holdings Limited | 0,89 | 41,73 | 6,65 | 32,14 | 1,0585 | 0,3082 | |||
| EWBC / East West Bancorp, Inc. | 0,08 | 2,52 | 6,61 | −14,81 | 1,0527 | −0,1050 | |||
| CG / The Carlyle Group Inc. | 0,17 | 41,77 | 6,39 | −2,46 | 1,0168 | 0,0403 | |||
| AB / AllianceBernstein Holding L.P. - Limited Partnership | 0,14 | −42,64 | 5,46 | −43,59 | 0,8699 | −0,5745 | |||
| LAZ / Lazard, Inc. | 0,14 | 76,15 | 5,30 | 26,04 | 0,8437 | 0,2166 | |||
| EBC / Eastern Bankshares, Inc. | 0,35 | 1,01 | 5,20 | −17,92 | 0,8277 | −0,1168 | |||
| ASB / Associated Banc-Corp | 0,24 | 0,00 | 5,20 | −12,24 | 0,8272 | −0,0558 | |||
| FIBK / First Interstate BancSystem, Inc. | 0,19 | 1,09 | 5,08 | −19,63 | 0,8088 | −0,1339 | |||
| FNF / Fidelity National Financial, Inc. | 0,07 | 1,63 | 4,79 | 11,89 | 0,7627 | 0,1243 | |||
| BOKF / BOK Financial Corporation | 0,05 | −0,40 | 4,58 | −15,97 | 0,7297 | −0,0837 | |||
| KEY / KeyCorp | 0,30 | −1,38 | 4,47 | −18,60 | 0,7108 | −0,1072 | |||
| FLT / Corpay, Inc. | 0,01 | 1,56 | 4,23 | −13,16 | 0,6734 | −0,0529 | |||
| US21871X1090 / Corebridge Financial, Inc. | 0,14 | −40,76 | 4,14 | −48,01 | 0,6594 | −0,5287 | |||
| BRDG / Bridge Investment Group Holdings Inc. | 0,42 | 1,51 | 4,06 | 21,54 | 0,6468 | 0,1483 | |||
| WSBC / WesBanco, Inc. | 0,13 | 1,50 | 3,84 | −13,74 | 0,6106 | −0,0525 | |||
| US31635A1051 / Fidelity Cash Central Fund | 3,72 | 39,73 | 3,73 | 39,72 | 0,5931 | 0,1955 | |||
| BOLSAA / Bolsa Mexicana de Valores SAB de CV | 1,76 | −0,17 | 3,70 | 36,13 | 0,5891 | 0,1837 | |||
| FHB / First Hawaiian, Inc. | 0,15 | 1,77 | 3,41 | −15,77 | 0,5426 | −0,0608 | |||
| UCBI / United Community Banks, Inc. | 0,12 | 3,24 | 0,5164 | 0,5164 | |||||
| OWL / Blue Owl Capital Inc. | 0,17 | 1,75 | 3,23 | −27,52 | 0,5144 | −0,1503 | |||
| RJF / Raymond James Financial, Inc. | 0,02 | −45,40 | 3,21 | −55,60 | 0,5116 | −0,5675 | |||
| PAX / Patria Investments Limited | 0,28 | 0,00 | 2,95 | −11,84 | 0,4693 | −0,0295 | |||
| TCBK / TriCo Bancshares | 0,08 | −0,13 | 2,90 | −12,19 | 0,4612 | −0,0307 | |||
| ZION / Zions Bancorporation, National Association | 0,06 | 2,13 | 2,80 | −20,61 | 0,4453 | −0,0802 | |||
| SF / Stifel Financial Corp. | 0,03 | −36,90 | 2,68 | −53,32 | 0,4270 | −0,4299 | |||
| V / Visa Inc. | 0,01 | −82,80 | 2,59 | −82,61 | 0,4125 | −1,8097 | |||
| PWP / Perella Weinberg Partners | 0,13 | 2,35 | 2,25 | −31,95 | 0,3578 | −0,1347 | |||
| WTFC / Wintrust Financial Corporation | 0,02 | 0,00 | 2,16 | −15,00 | 0,3445 | −0,0352 | |||
| CADE / Cadence Bank | 0,07 | 0,00 | 2,11 | −16,86 | 0,3360 | −0,0426 | |||
| NMIH / NMI Holdings, Inc. | 0,00 | −100,00 | 0,00 | −100,00 | −0,1877 | ||||
| ESNT / Essent Group Ltd. | 0,00 | −100,00 | 0,00 | −100,00 | −1,4454 |